


方案详情
文
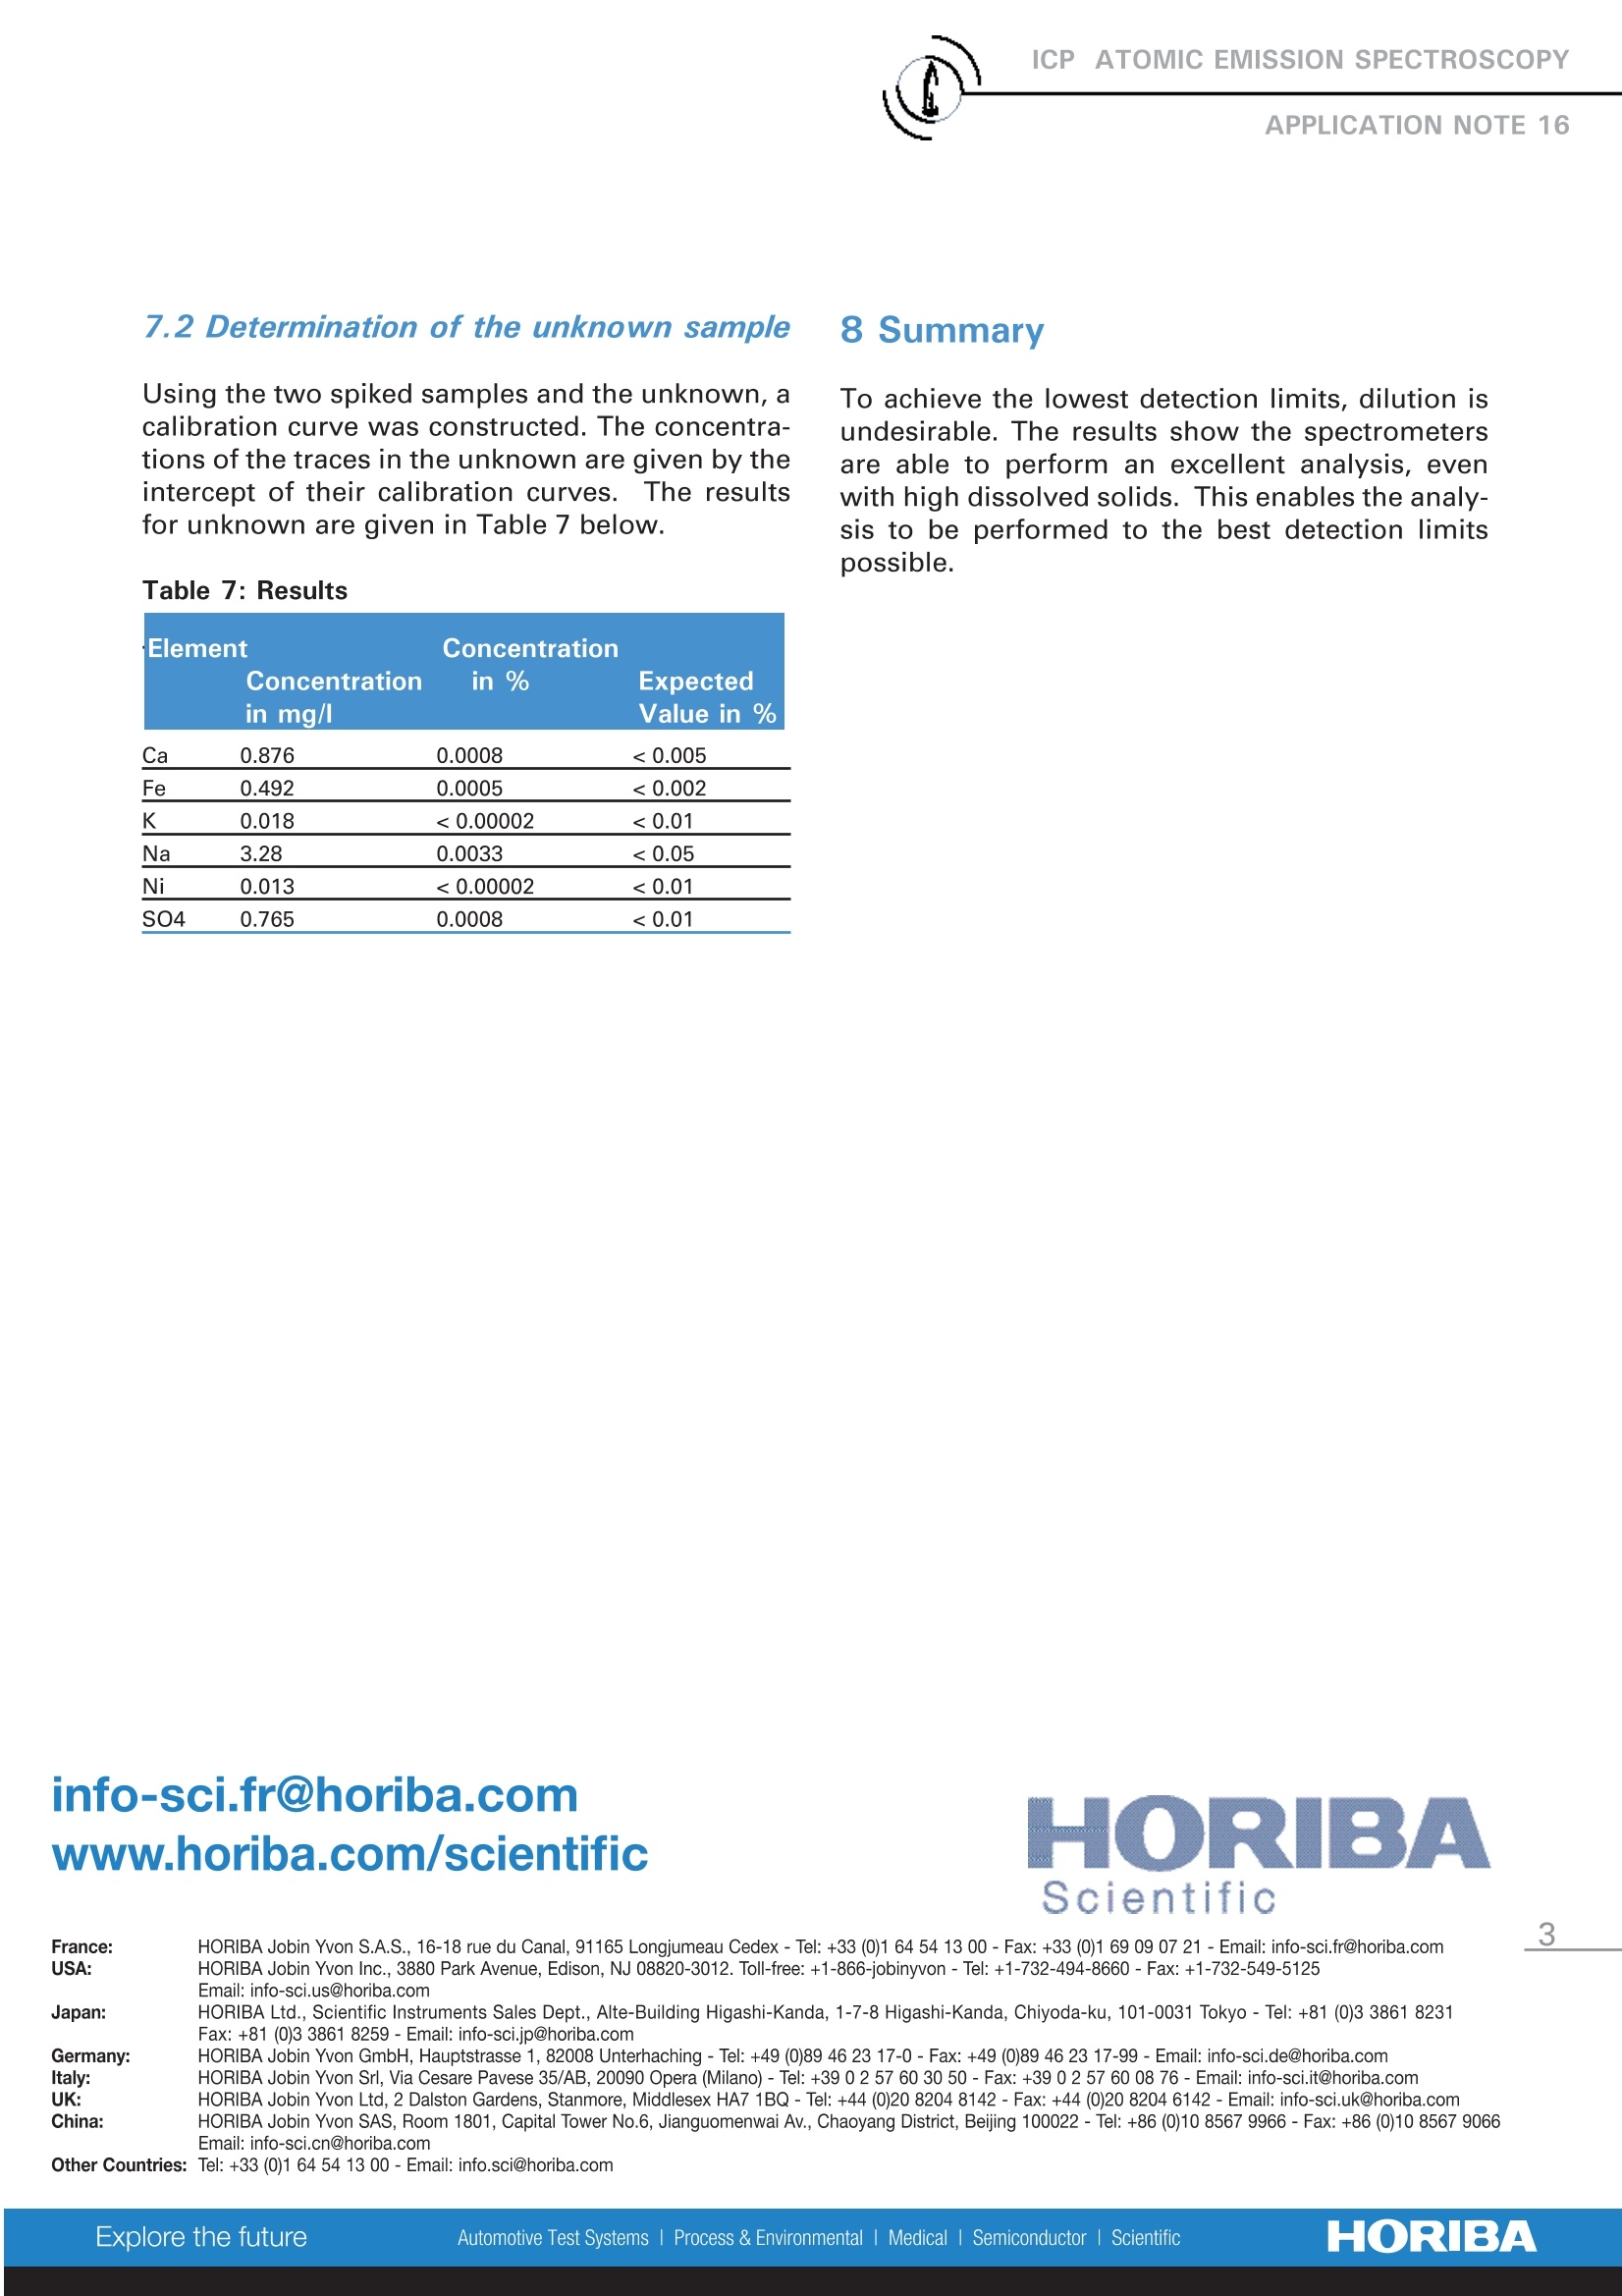
To achieve the lowest detection limits, dilution is undesirable. The results show the spectrometers are able to perform an excellent analysis, even with high dissolved solids. This enables the analysis to be performed to the best detection limits possible.
方案详情

ICP ATOMIC EMISSION SPECTROSCOPY ICP)ATOMIC EMISSION SPECTROSCOPYAPPLICATION NOTE 16 Analysis of Metals in 100 g/l Copper Acetate Nathalie Le CorreHORIBA Scientific .Longjumeau, France Keywords: chemicals, inorganic 1 Introduction A sample with 100 g/L Cu (CH3COO)2.H20 waspresented to this laboratory for trace determina-tion. As there was only one sample to be ana-lyzed, which had a complex matrix, the standardaddition method was used for analysis. 2 Principle 2.1 Technique used The elemental analysisofa 100 g/L Cu(CH3COO)2.H20 solution was undertaken byInductively Coupled Plasma Atomic EmissionSpectrometry (ICP-AES). The sample is nebu-lized then transferred to an argon plasma. It isdecomposed, atomized and ionized wherebythe atoms and ions are excited. We measure theintensity of the light emitted when the atoms orions return to lower levels of energy. Each ele-ment emits light at characteristic wavelengthsand these lines can be used for quantitativeanalysis after a calibration. 2.2 Wavelength choice The choice of the wavelength in a given matrixcan be made using the “profile"function, or byusing Win-IMAGE, which is rapid semi-quantita-tive analysis mode using multiple wavelengths.The principle is the same in either case: recordthe scans of analytes at low concentration, andof the matrix. By superimposing the spectra, wesee possible interferences. 2.3 Limit of detection estimation The limits of detection are calculated using thefollowing formula: With: LOD = limits of detection, k= 3 for the normal 3-sigma values, BEC= Background equivalent concentration, RSDo= relative standard deviation of the blank. To calculate the LOD, a calibration curve is con-structed using two points, 0 ppm and 5 ppm, orsome concentration where the calibration is lin-ear; this gives the BEC. The RSDo is evaluatedby running the blank ten times. 3 Sample preparation 10 g of sample was weighed and dissolved with5mL69% HNO3 and diluted up to 100 mL withdeionized water. Two spiked samples were prepared for the stan-dard addition method. Addition 1: 0.1 mL of standard"A" with 25 mL ofdissolved Cu (CH3COO)2.H20. Addition 2: 0.2 mL of standard "A" with 25 mL ofdissolved Cu (CH3COO)2.H20. Standard "A" contained: 1 g/L of Na, 0.5 g/L of Ca, 0.2 g/L of S, Fe, Ni, K The concentrations of the spiked samples arelisted in Table 1 below. Table 1: Standard addition concentration Element Concentration of Wavelength Unknown Addition1 Addition2 sample Ca 315.885 X X+2 X+4 Fe 259.940 X+0.8 X+1.6 K 766.490 X X+0.8 X+1.6 Na 589.592 X X+4 X+8 Ni 231.604 X X+0.8 X+1.6 S 182.568 X+0.8 X+1.6 4 Instrument specification The work was done on a ULTIMA.The specifica-tions of this instrument are listed below in Table 2and 3. Table 2: Specification of spectrometer Parameters Specifications Mounting Czerny Turner Focal length 1m Nitrogen purge Yes Variable resolution Yes Grating number of grooves 2400 gr/mm Order 2nd order Table 3: Specification of RF Generator Parameters Specifications Type of generator Solid state Observation Radial Frequency 40.68 MHz Control of gas flowrate by computer Control of pump flow by computer Cooling air 5 Operating conditions The operating conditions are listed in Table 4below. Table 4: Operating conditions Parameter Condition RF Generator power 1200 W Plasma gas flowrate 12 L/min Auxiliary gas flowrate 0 L/min Sheath gas flowrate 0.2 L/min Nebulizer gas flowrate 0.8 L/min Nebulizer flowrate 3 bars (45 psi) Sample uptake 1 mL/min Type of nebulizer Parallel Type of spray chamber Cyclonic Argon humidifier No Injector tube diameter 3.0 mm 6 Wavelength selection and analyti-cal conditionsS For each element, the line with the highest sensi-tivity was used for analysis, because there were noproblems with interferences.The analysis condi-tions were the same for all elements except thealkali elements. Table 5: Analytical conditions Element Slits Analysis Integration (um) mode time (sec) All elements 20x15 Direct peaking 8 K 20x80 Gaussian 0.5 The use of the parallel nebulizer and the largeinternal diameter (ID) of the injector tube enabledtrouble free analysis, even with the high dissolvedsalts. The larger the ID injector tube also ensures aminimization of the interferences. Due to the highdissolved salts, an initial conditioning of the spraychamber is advised for maximum stability. It isalso imperative to use matched standards or stan-dard addition because of the viscosity of solutionswith high dissolved solids. 7 Discussion 7.1 Limits of Detection The limits of detection were calculated using theformula in paragraph 2.3. They were calculated inug/kg in the solid sample. Table 6: Limits of detection Elements LOD (ug/kg) Ca 40 Fe 5 K 90 Na 60 Ni 15 SO4 90 Using the two spiked samples and the unknown, acalibration curve was constructed. The concentra-tions of the traces in the unknown are given by theintercept of their calibration curves. The resultsfor unknown are given in Table 7 below. Table 7: Results Element Concentration Concentration in% Expected in mg/l Value in % Ca 0.876 0.0008 <0.005 Fe 0.492 0.0005 <0.002 SK 0.018 <0.00002 < 0.01 Na 3.28 0.0033 <0.05 Ni 0.013 <0.00002 <0.01 SO4 0.765 0.0008 <0.01 8 Summary To achieve the lowest detection limits, dilution isundesirable. The results show the spectrometersare able to perform an excellent analysis, evenwith high dissolved solids. This enables the analy-sis to be performed to the best detection limitspossible. France: HORIBA Jobin Yvon S.A.S., 16-18 rue du Canal,91165 Longjumeau Cedex-Tel:+33 (0)1 64 54 13 00 - Fax:+33 (0)1 69 09 07 21-Email: info-sci.fr@horiba.comUSA: HORIBA Jobin Yvon Inc., 3880 Park Avenue, Edison, NJ 08820-3012. Toll-free: +1-866-jobinyvon - Tel: +1-732-494-8660-Fax: +1-732-549-5125Email: info-sci.us@horiba.com Japan: HORIBA Ltd., Scientific Instruments Sales Dept., Alte-Building Higashi-Kanda,1-7-8Higashi-Kanda, Chiyoda-ku, 101-0031 Tokyo - Tel: +81 (0)3 3861 8231 Fax: +81 (0)3 3861 8259-Email: info-sci.jp@horiba.comGermany: HORIBA Jobin Yvon GmbH, Hauptstrasse 1, 82008 Unterhaching - Tel: +49 (0)89 46 23 17-0-Fax: +49 (0)89 46 23 17-99-Email: info-sci.de@horiba.com Italy: HORIBA Jobin Yvon Srl, Via Cesare Pavese 35/AB, 20090 Opera (Milano)- Tel: +39 0 2 57 60 30 50-Fax: +39 0 2 57 60 08 76 -Email: info-sci.it@horiba.com UK: HORIBA Jobin Yvon Ltd, 2 Dalston Gardens, Stanmore, Middlesex HA7 1BQ- Tel:+44 (0)20 8204 8142 - Fax:+44 (0)208204 6142-Email: info-sci.uk@horiba.com China: HORIBA Jobin Yvon SAS, Room 1801, Capital Tower No.6, Jianguomenwai Av., Chaoyang District, Beijing 100022 - Tel:+86 (0)10 8567 9966-Fax:+86 (0)10 8567 9066 Email: info-sci.cn@horiba.com Other Countries: Tel: +33 (0)1 64 54 1300-Email: info.sci@horiba.com HORIBAScientific ORIBAScientific To achieve the lowest detection limits, dilution is undesirable. The results show the spectrometers are able to perform an excellent analysis, even with high dissolved solids. This enables the analysis to be performed to the best detection limits possible.
确定

还剩1页未读,是否继续阅读?

产品配置单

HORIBA(中国)为您提供《乙酸铜溶液中金属元素检测方案(ICP-AES)》,该方案主要用于无机酸中金属元素检测,参考标准--,《乙酸铜溶液中金属元素检测方案(ICP-AES)》用到的仪器有HORIBA Ultima Expert高性能ICP光谱仪
相关方案
更多
该厂商其他方案
更多