


方案详情
文
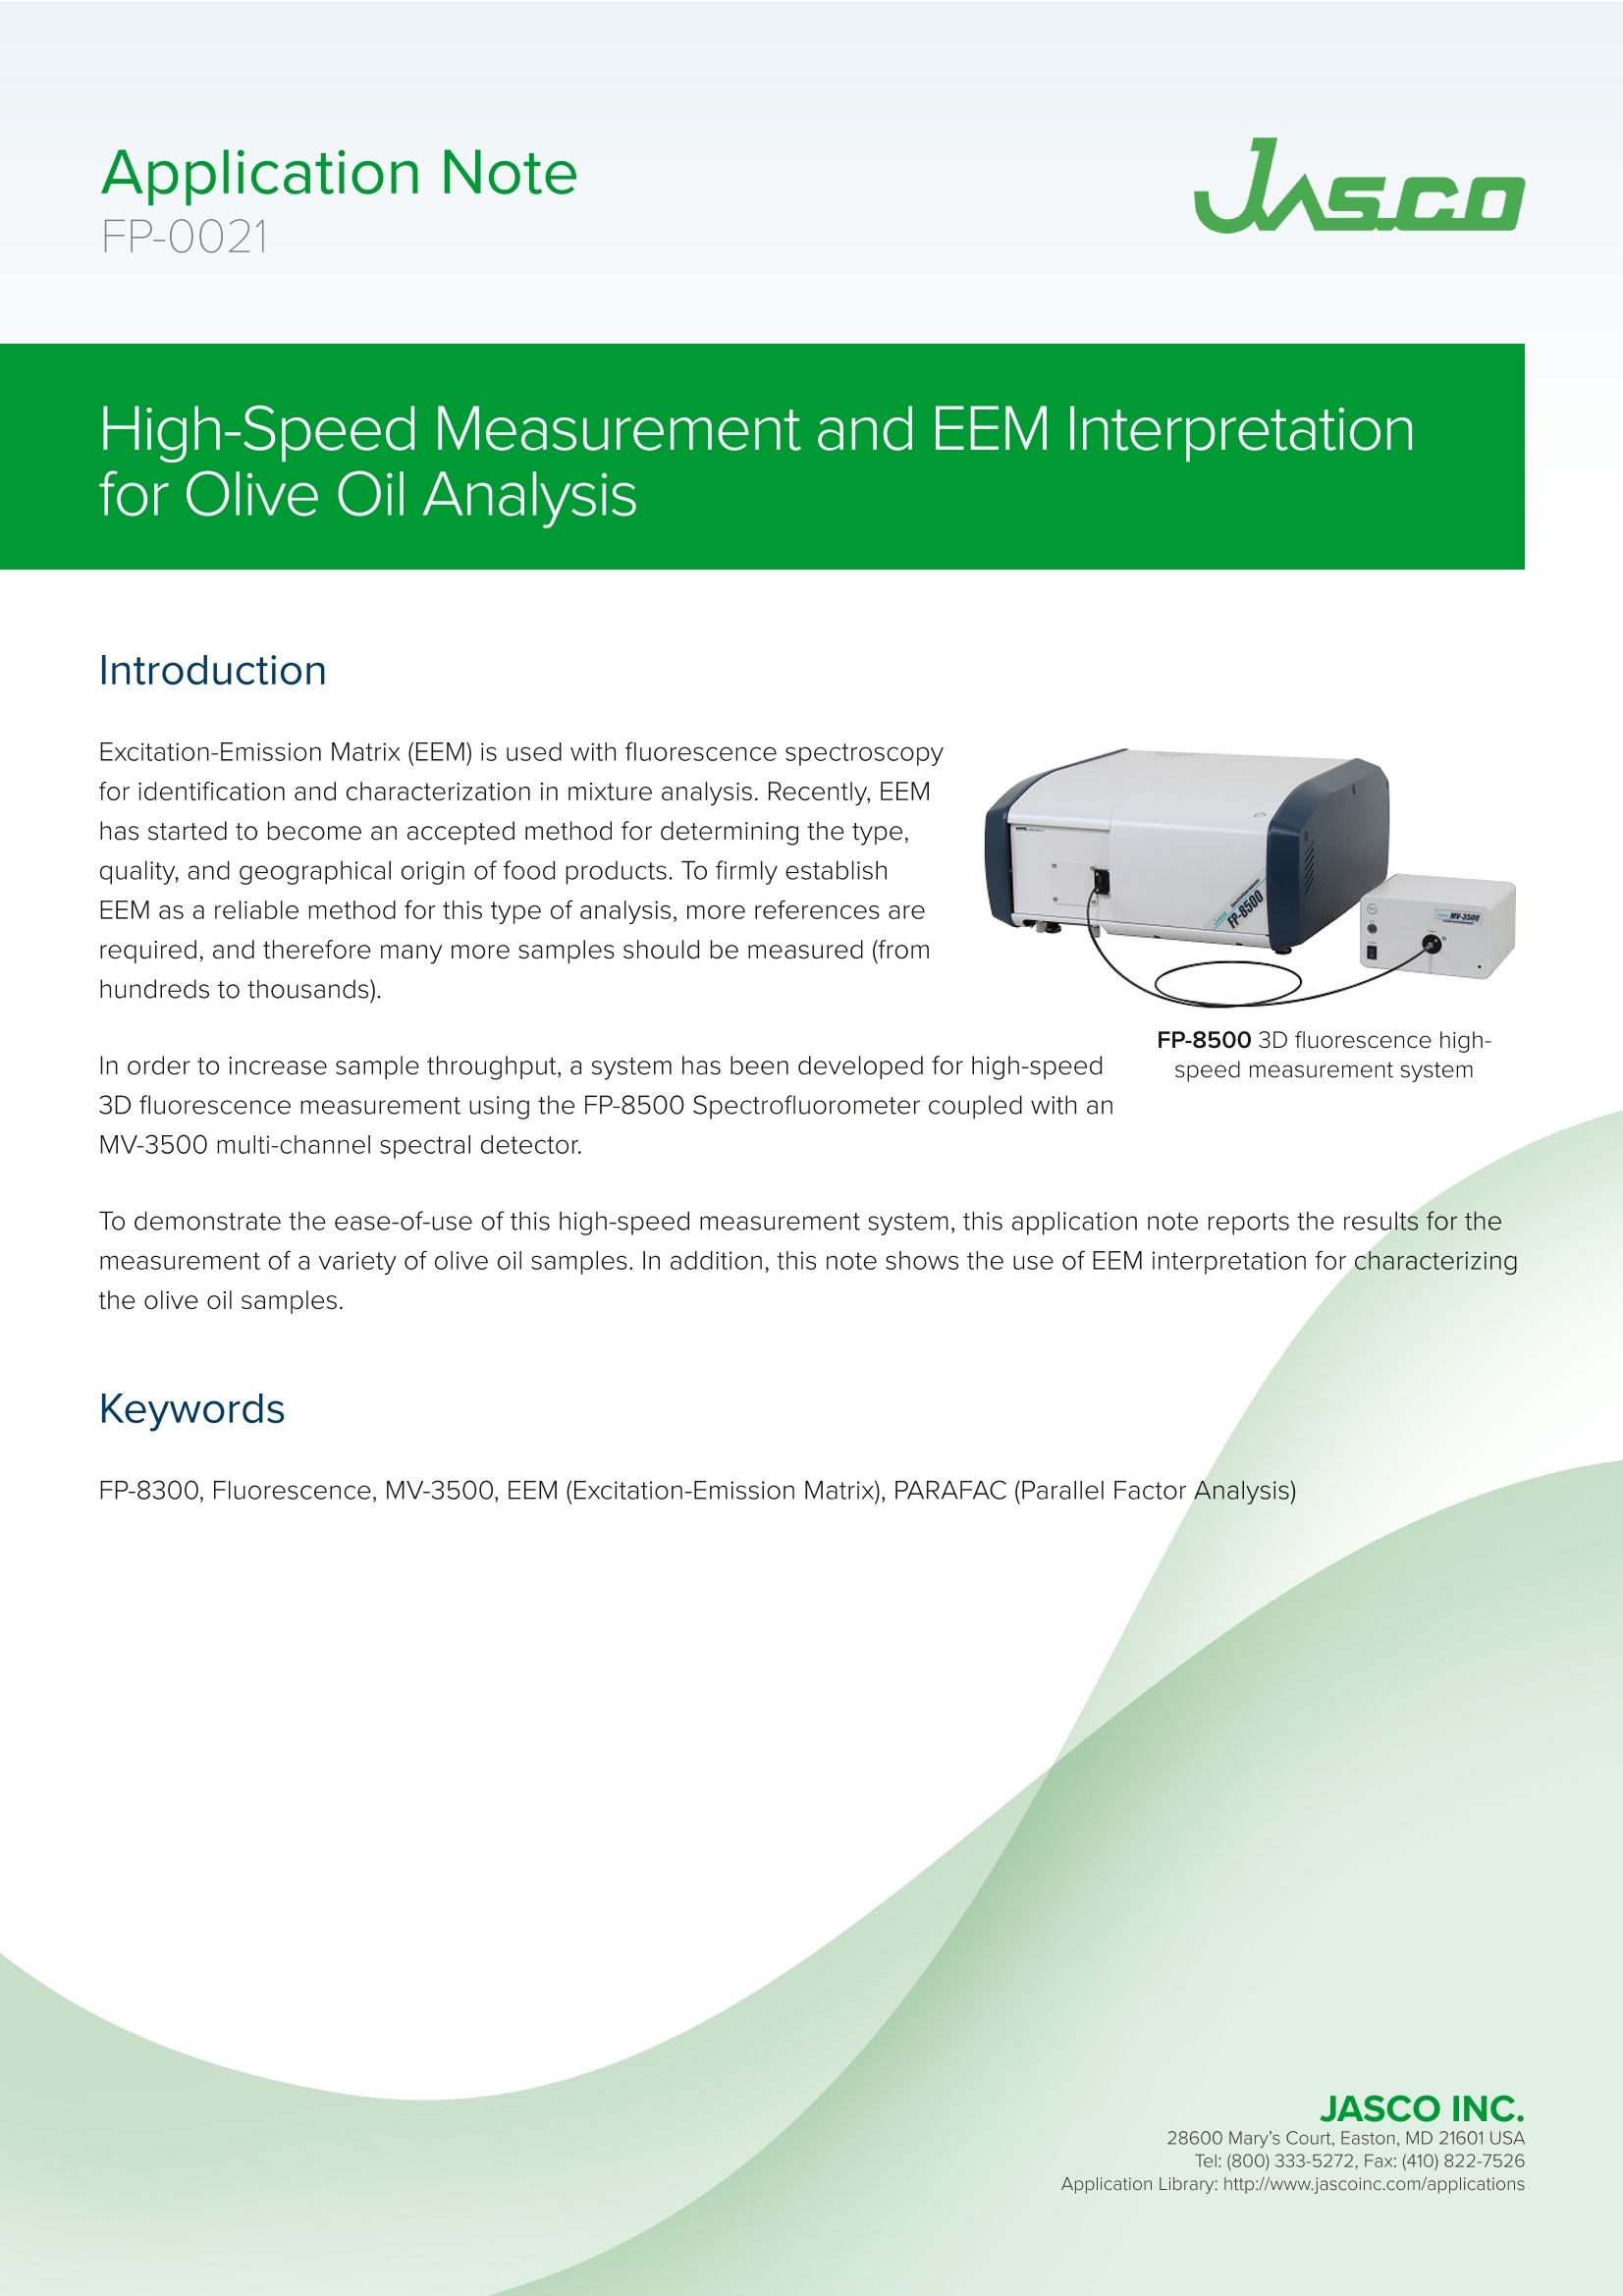
为了演示该高速测量系统的易用性,本应用说明报告了各种橄榄油样品的测量结果。此外,本说明还显示了使用EEM解释来表征橄榄油样品。
关键词:FP-8300、荧光、MV-3500、EEM(激发-发射矩阵)、对分析(平行因子分析)
方案详情

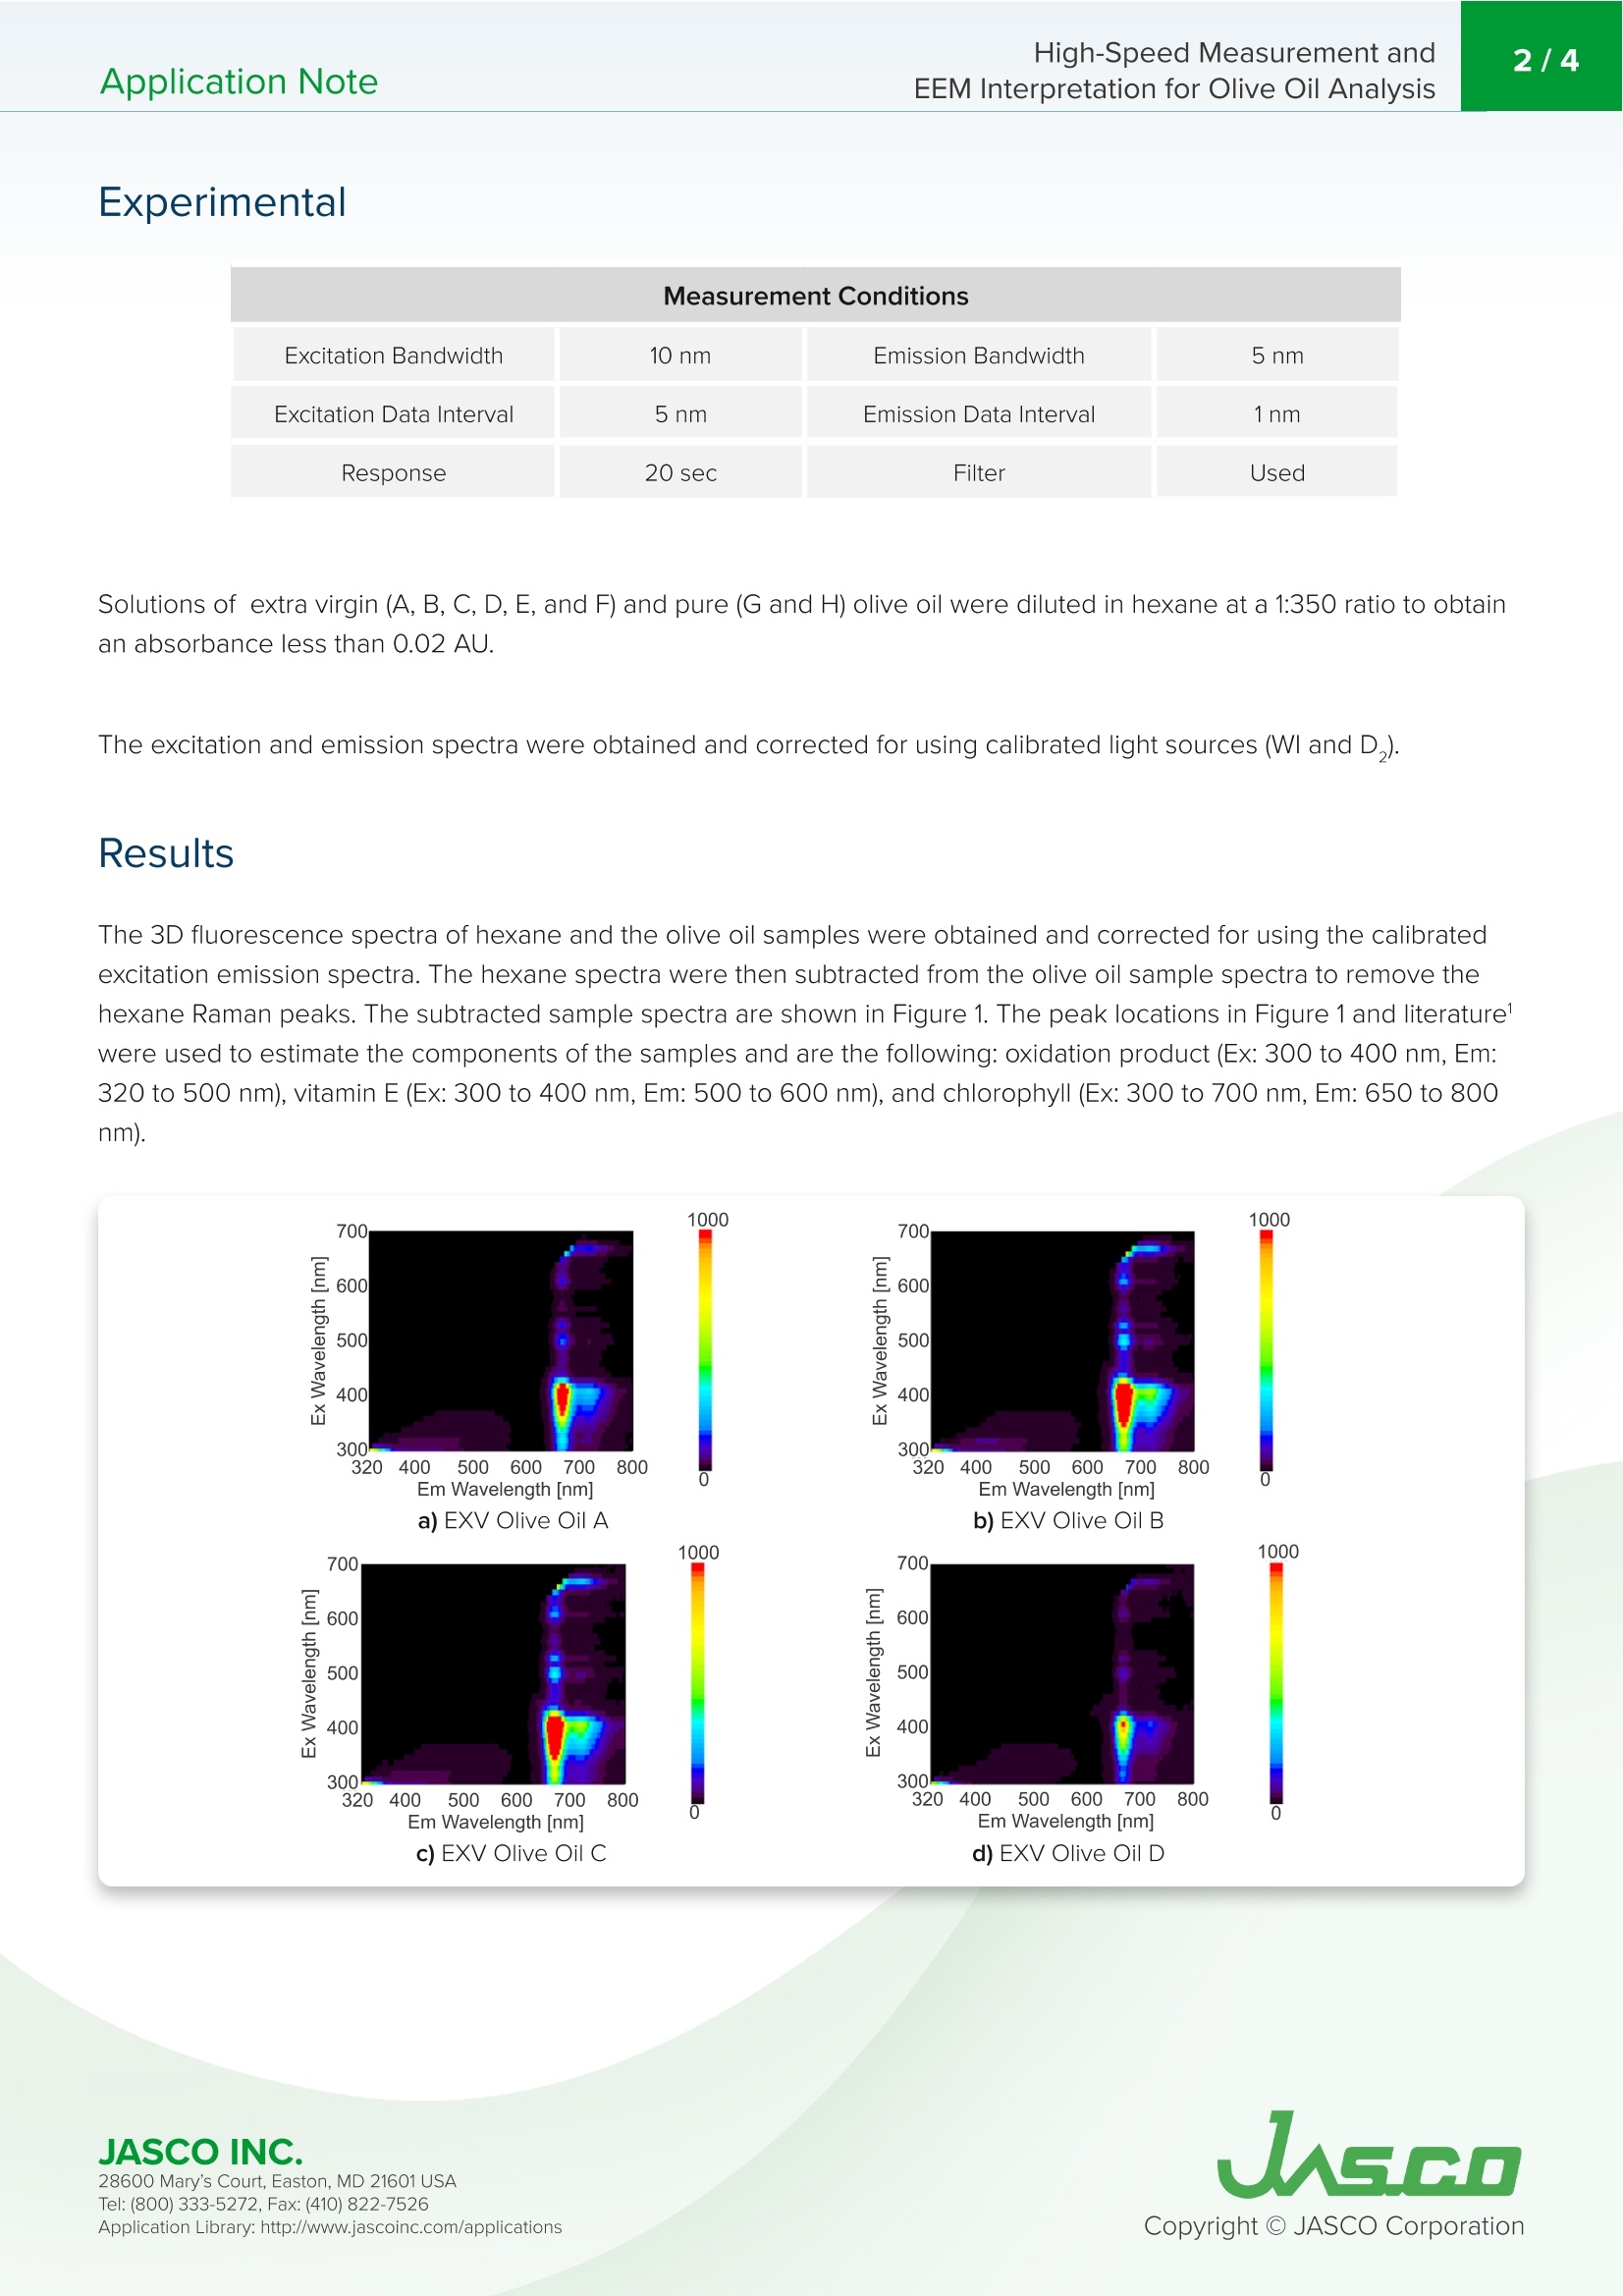
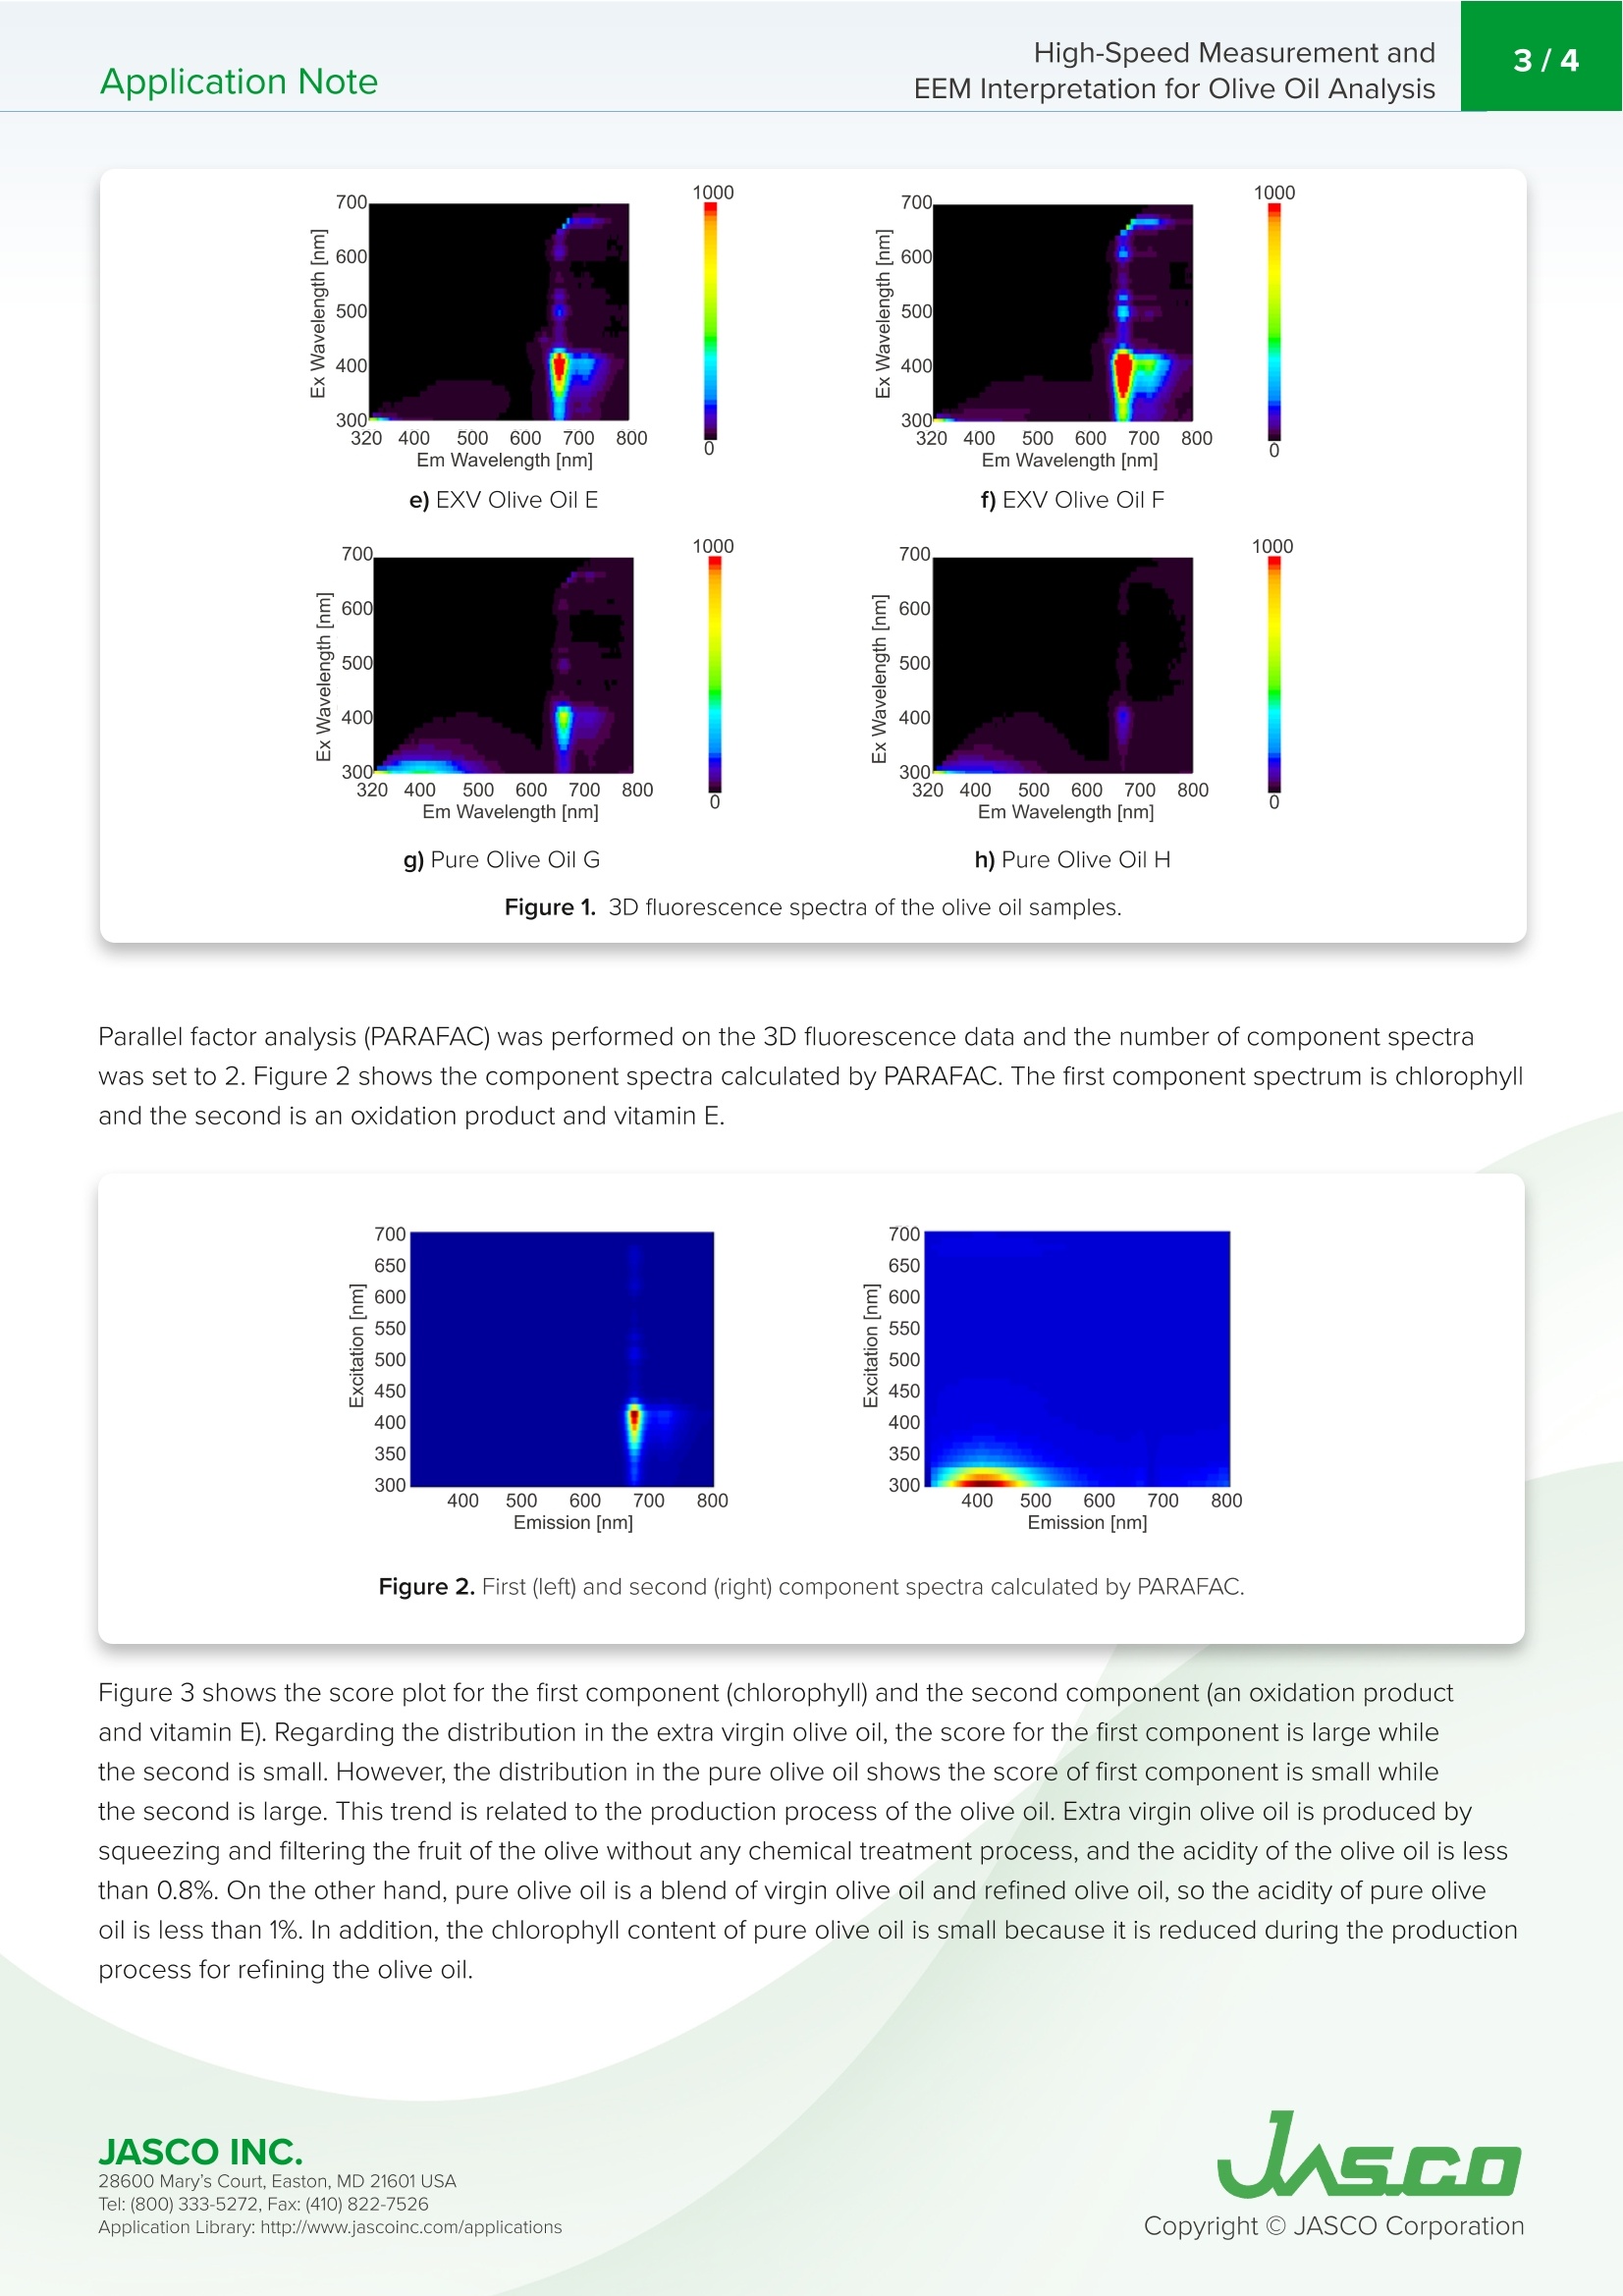
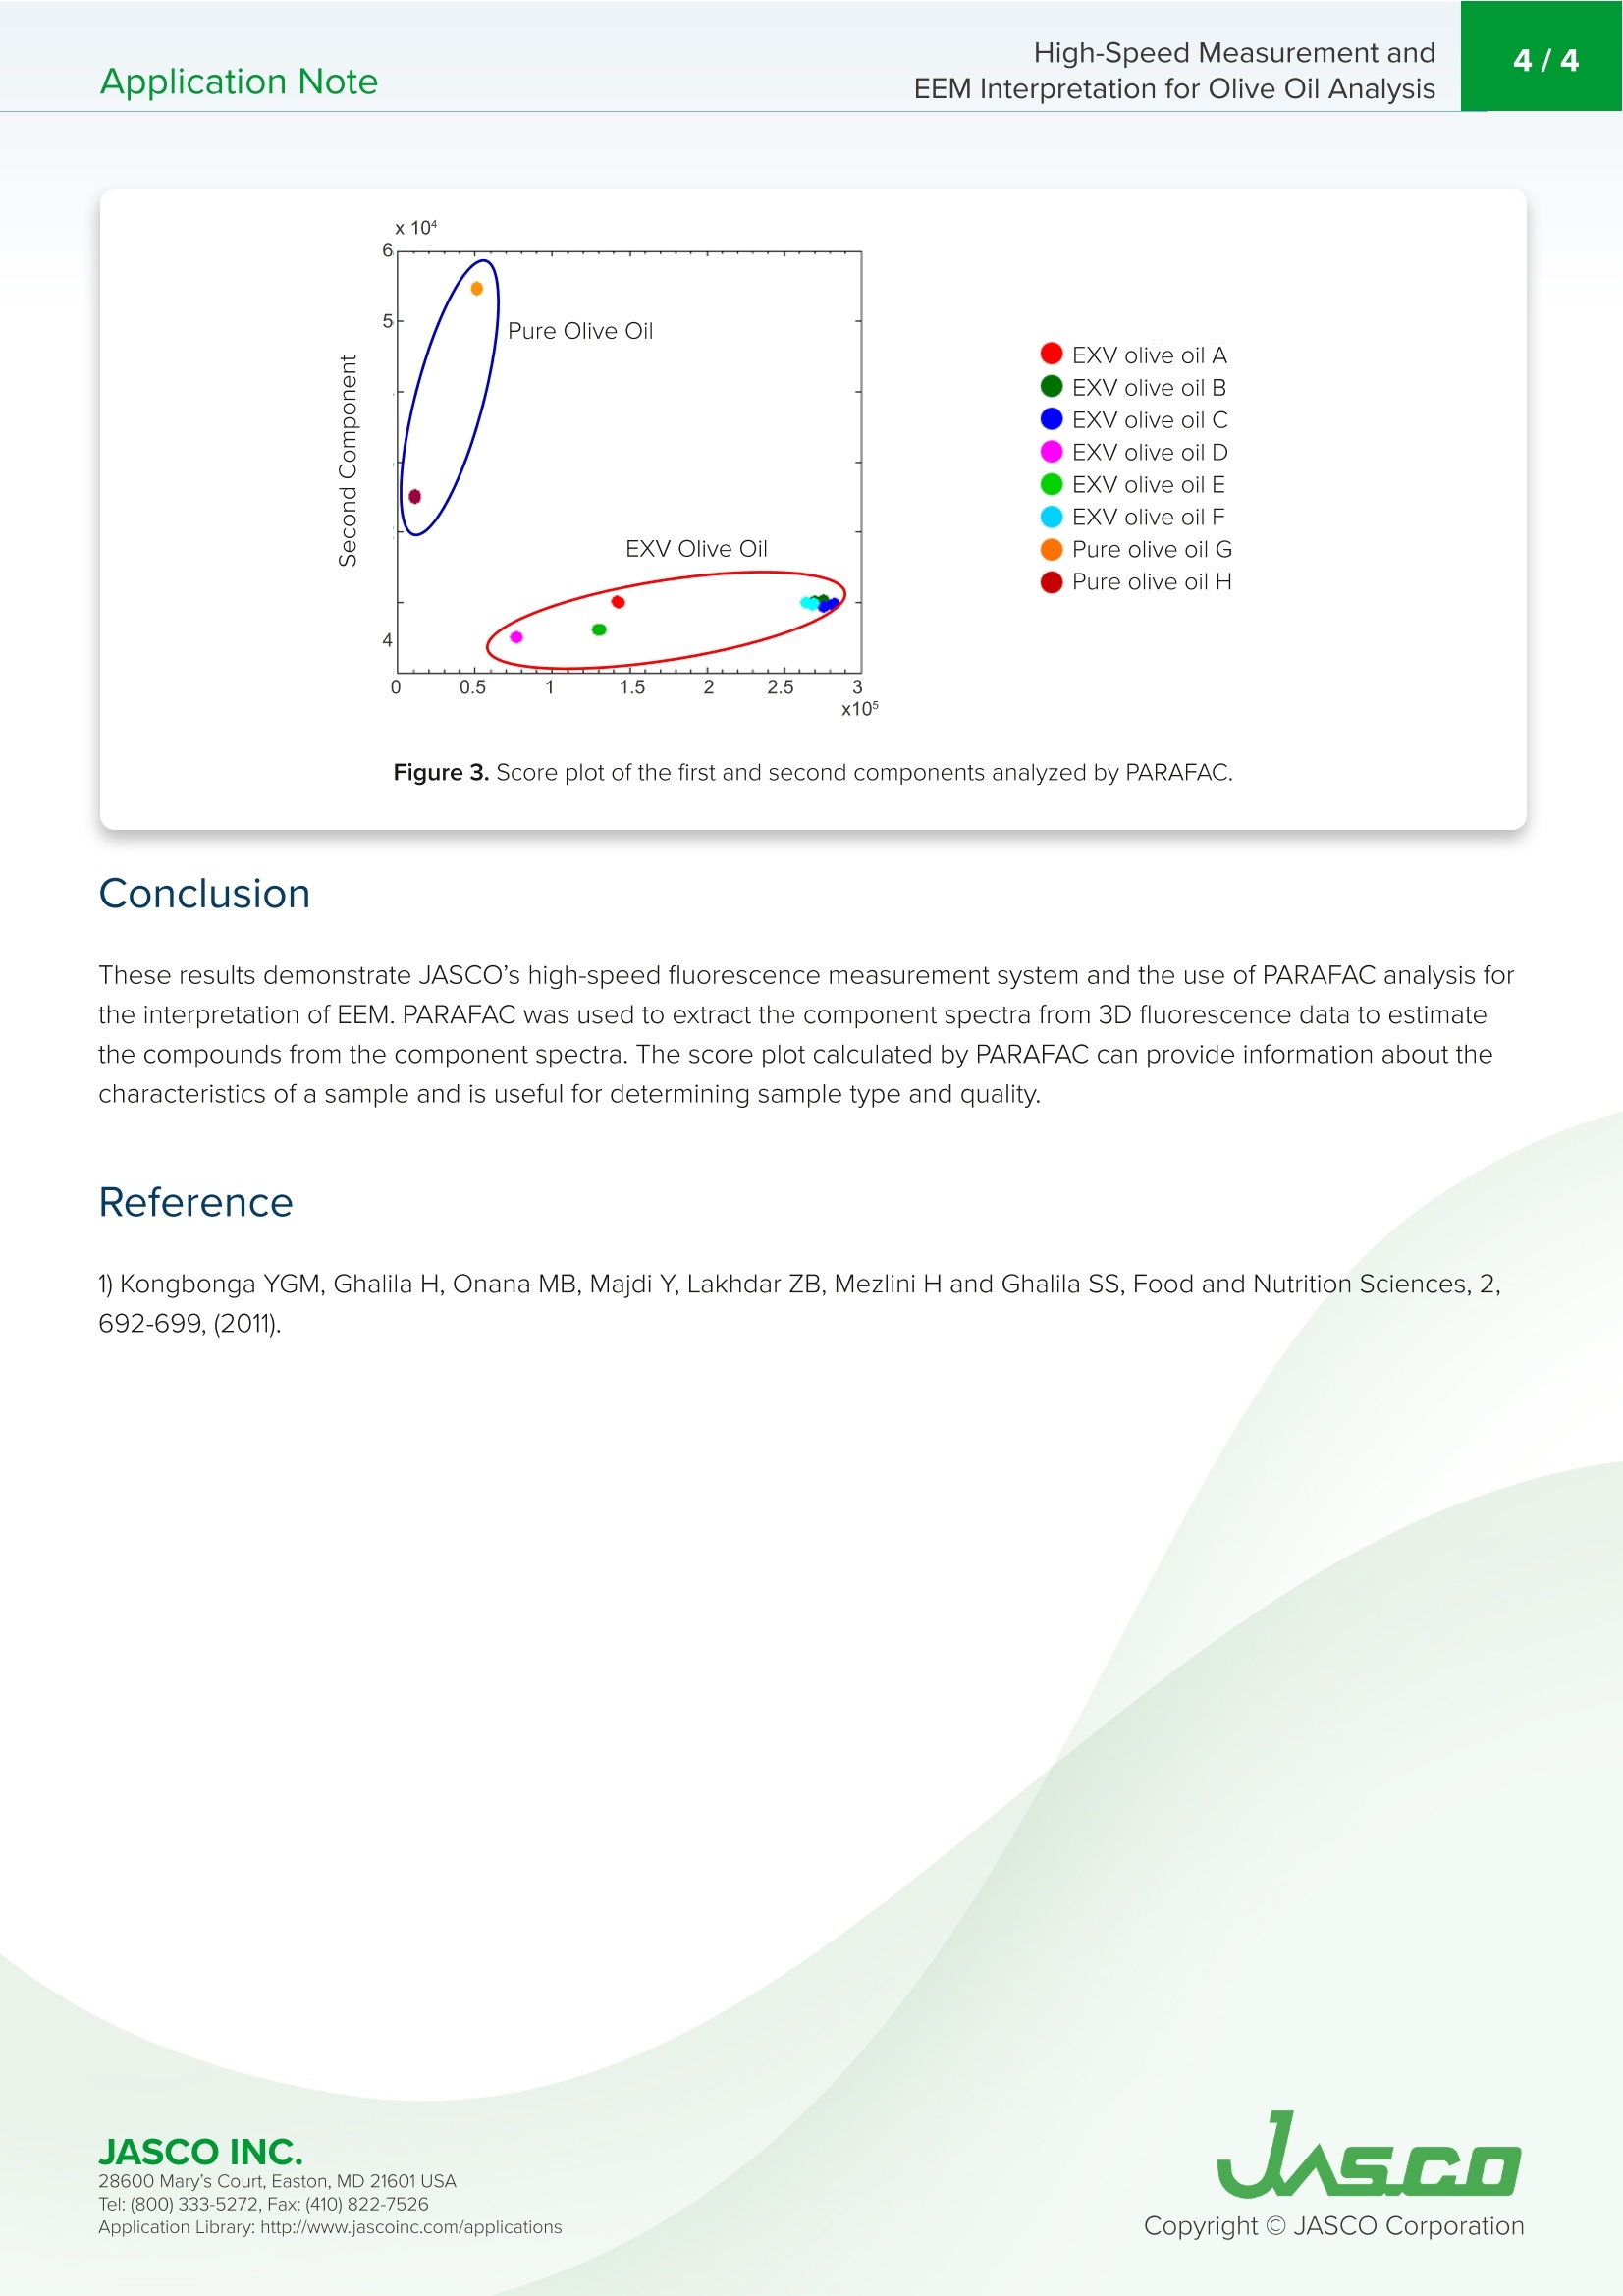
激发发射矩阵(EEM)与荧光光谱一起用于混合物分析中的识别和表征。最近,EEM已经开始成为一种公认的确定食品类型、质量和地理来源的方法。为了将EEM牢固地确立为这类分析的可靠方法,需要更多的参考文献,因此应该测量更多的样本(从数百到数千)。为了增加样品吞吐量,已经开发了一种使用FP-8500光谱荧光计和MV-3500多通道光谱检测器进行高速3D荧光测量的系统。Application NoteFP-0021 High-Speed Measurement andEEM Interpretation for Olive Oil Analysis2/4Application Note High-Speed Measurement and EEM Interpretatio n for Olive Oil Analysis Excitat i on-Emission Matrix (EEM) is used with fluorescence spectroscopy for ident i fication and cha r acterization in mixture ana l ys i s. Recent l y,EEM has sta r ted to become an accepted met h od for determining the type,q u ality, and geographical origin of food prod u cts. To f irm l y estab li sh EEM as a reliable method for thi s type of ana l ysis, more references are req u ired, and there f ore many more sam p les should be mea s ured (f rom hundreds to thousands). FP-8500 3D f l uo r escenc e high-speed measu r emen t sys t e m In order to inc r ease sample throughput, a system has bee n developed for h i g h -speed 3D f l uorescence measurement using t h e FP-8500 Spectrof l uorometer coupled with an MV-3500 multi-channel spectral detector. To demonstrate the ease-of-use of th i s high-speed m easurement system, this application note reports the r esults for the measurement of a variety of ol i ve oil samples. I n addi ti on, th i s note shows t h e use of EEM interpretation for characterizing the olive oil samples. 28600 Ma r y 's C ou r t, Easton, M D 21601 US A Experimen t al Excitation Bandwidth 10nm Emission Bandwidth 5nm Excitation Data Interval 5nm Emission Data Interval 1nm Response 20 sec Filter Used Solutions of extra virgin (A, B, C, D, E , and F ) and pure (G and H) olive oil were d il uted i n hexane at a 1:350 ratio to obtain a n absorbance l ess t h a n 0.02 AU. The excitat i on and emission spectra were obtained and corrected for using cal i brated li ght sources (Wl and D,). Results The 3D f l uoresce n ce spectra of h exane and t h e ol i ve oil samples we r e obtained and corrected for us in g the calibrated excitation em i ssion spectra. The hexane spectra were the n subtracted from t h e ol i ve oil sample spectra t o remove t he hexane Raman peaks. T h e su b tracted sample spectra are shown i n F i gure 1. T h e pea k l ocations in Figure 1 and literature were used to estimate t h e co m ponents of the samples and a r e the following: oxidation product (Ex: 300 to 400 nm,Em:320 to 500 nm), vitamin E (Ex: 300 to 400 nm, Em: 500 to 600 nm), and chlorophyll (Ex: 300 to 700 n m, E m : 650 to 800n m). 28600 Mary's Cour t , E a s to n , M D 21601US A UASGO Figure 1. 3D fluo re sce n ce spectra of th e olive oil samples. Parallel factor analys i s (PARAFAC) was performed on the 3D f lu orescence data and the numbe r of componen t spect r a wa s set to 2. F i gure 2 shows the compone n t spectra calcu l ated by PARAFAC. T h e f ir st component spectrum i s chlorophyll and the second is an ox i dat i o n product a n d vitami n E . Figure 2. Fi rst (l e f t ) a n d seco n d (r ight) com p o nen t s pe c t ra calc ul ated b y PARAFAC. Figur e 3 shows th e sco r e p lot for t h e f irst compon e nt (chlorophyll ) a n d t h e s e co n d component (an oxidation product a n d vitamin E). Rega r ding the dis t ribut i on i n the ext r a virgi n olive oil, th e score for the f irst compo n e n t is large whi l e the secon d is smal l. H owever, th e dis t ribut i on i n t he pure olive oi l shows the score of first compon e nt i s small while the second is l a rge. T h is t re n d i s relat e d to th e p roduc t ion p rocess of the olive oil . Extra virgi n olive oil i s produced by sq u eezing and f ilteri n g th e f ru i t of th e olive without a n y ch e mical tr e atment p rocess, and the acid i ty of t h e ol i ve oil is less tha n 0.8%. On th e other ha n d, pure olive oil i s a bl e nd of virgin ol i ve oi l and ref i ned olive oil , so the acidity of p ure olive oi l i s l ess t han 1%. In add i t i o n , the c hl o r ophyll content of pure olive oi l is small because i t is reduced dur i ng the produc t ion process f or ref i n in g th e olive oi l. 28600 Mary's Cour t , E a s to n , M D 21601US A Figure 3. Sco r e plot o f t he f i rs t a n d second compone n ts a n alyzed by PARAFAC. Conclu s io n T h ese results d e monstrate JASCO's h igh -spe e d f luoresc e nce measur e men t syste m and t he use of PARAFAC an a lysis fo r the in t erpretat i on of EEM. PARAFAC was us e d to e xtrac t t h e co m ponent spect r a fr om 3D fluo r escence data to estima t e the compounds f r o m t h e compone n t s p ec tr a. T h e score plot ca l c u lat e d by PARAFAC can provide i n format i on about th e cha r act e rist i cs of a sample a n d is us e ful for det e rmining sampl e type and qual it y. JASCO INC. 28600 Mary's Cour t , E a s to n , M D 21601US A
确定
还剩2页未读,是否继续阅读?

产品配置单

佳士科商贸有限公司为您提供《橄榄油分析的高速测量与EEM解释》,该方案主要用于食用植物油中高速测量、光谱、EEM、荧光检测,参考标准--,《橄榄油分析的高速测量与EEM解释》用到的仪器有JASCOFP-8000系列荧光光谱仪、JASCO便携式分光光度计MV-3000
相关方案
更多
该厂商其他方案
更多