


方案详情
文
Lipid profiling from complex lipid extracts can be a challenging and time consuming task. The high complexity of samples and co-elution of isobaric or isomeric compounds complicate the confident annotation of lipids. The presented 4D-Lipidomics workflow simplifies and
streamlines the annotation and validation process using
mobility-enhanced MS data.
方案详情

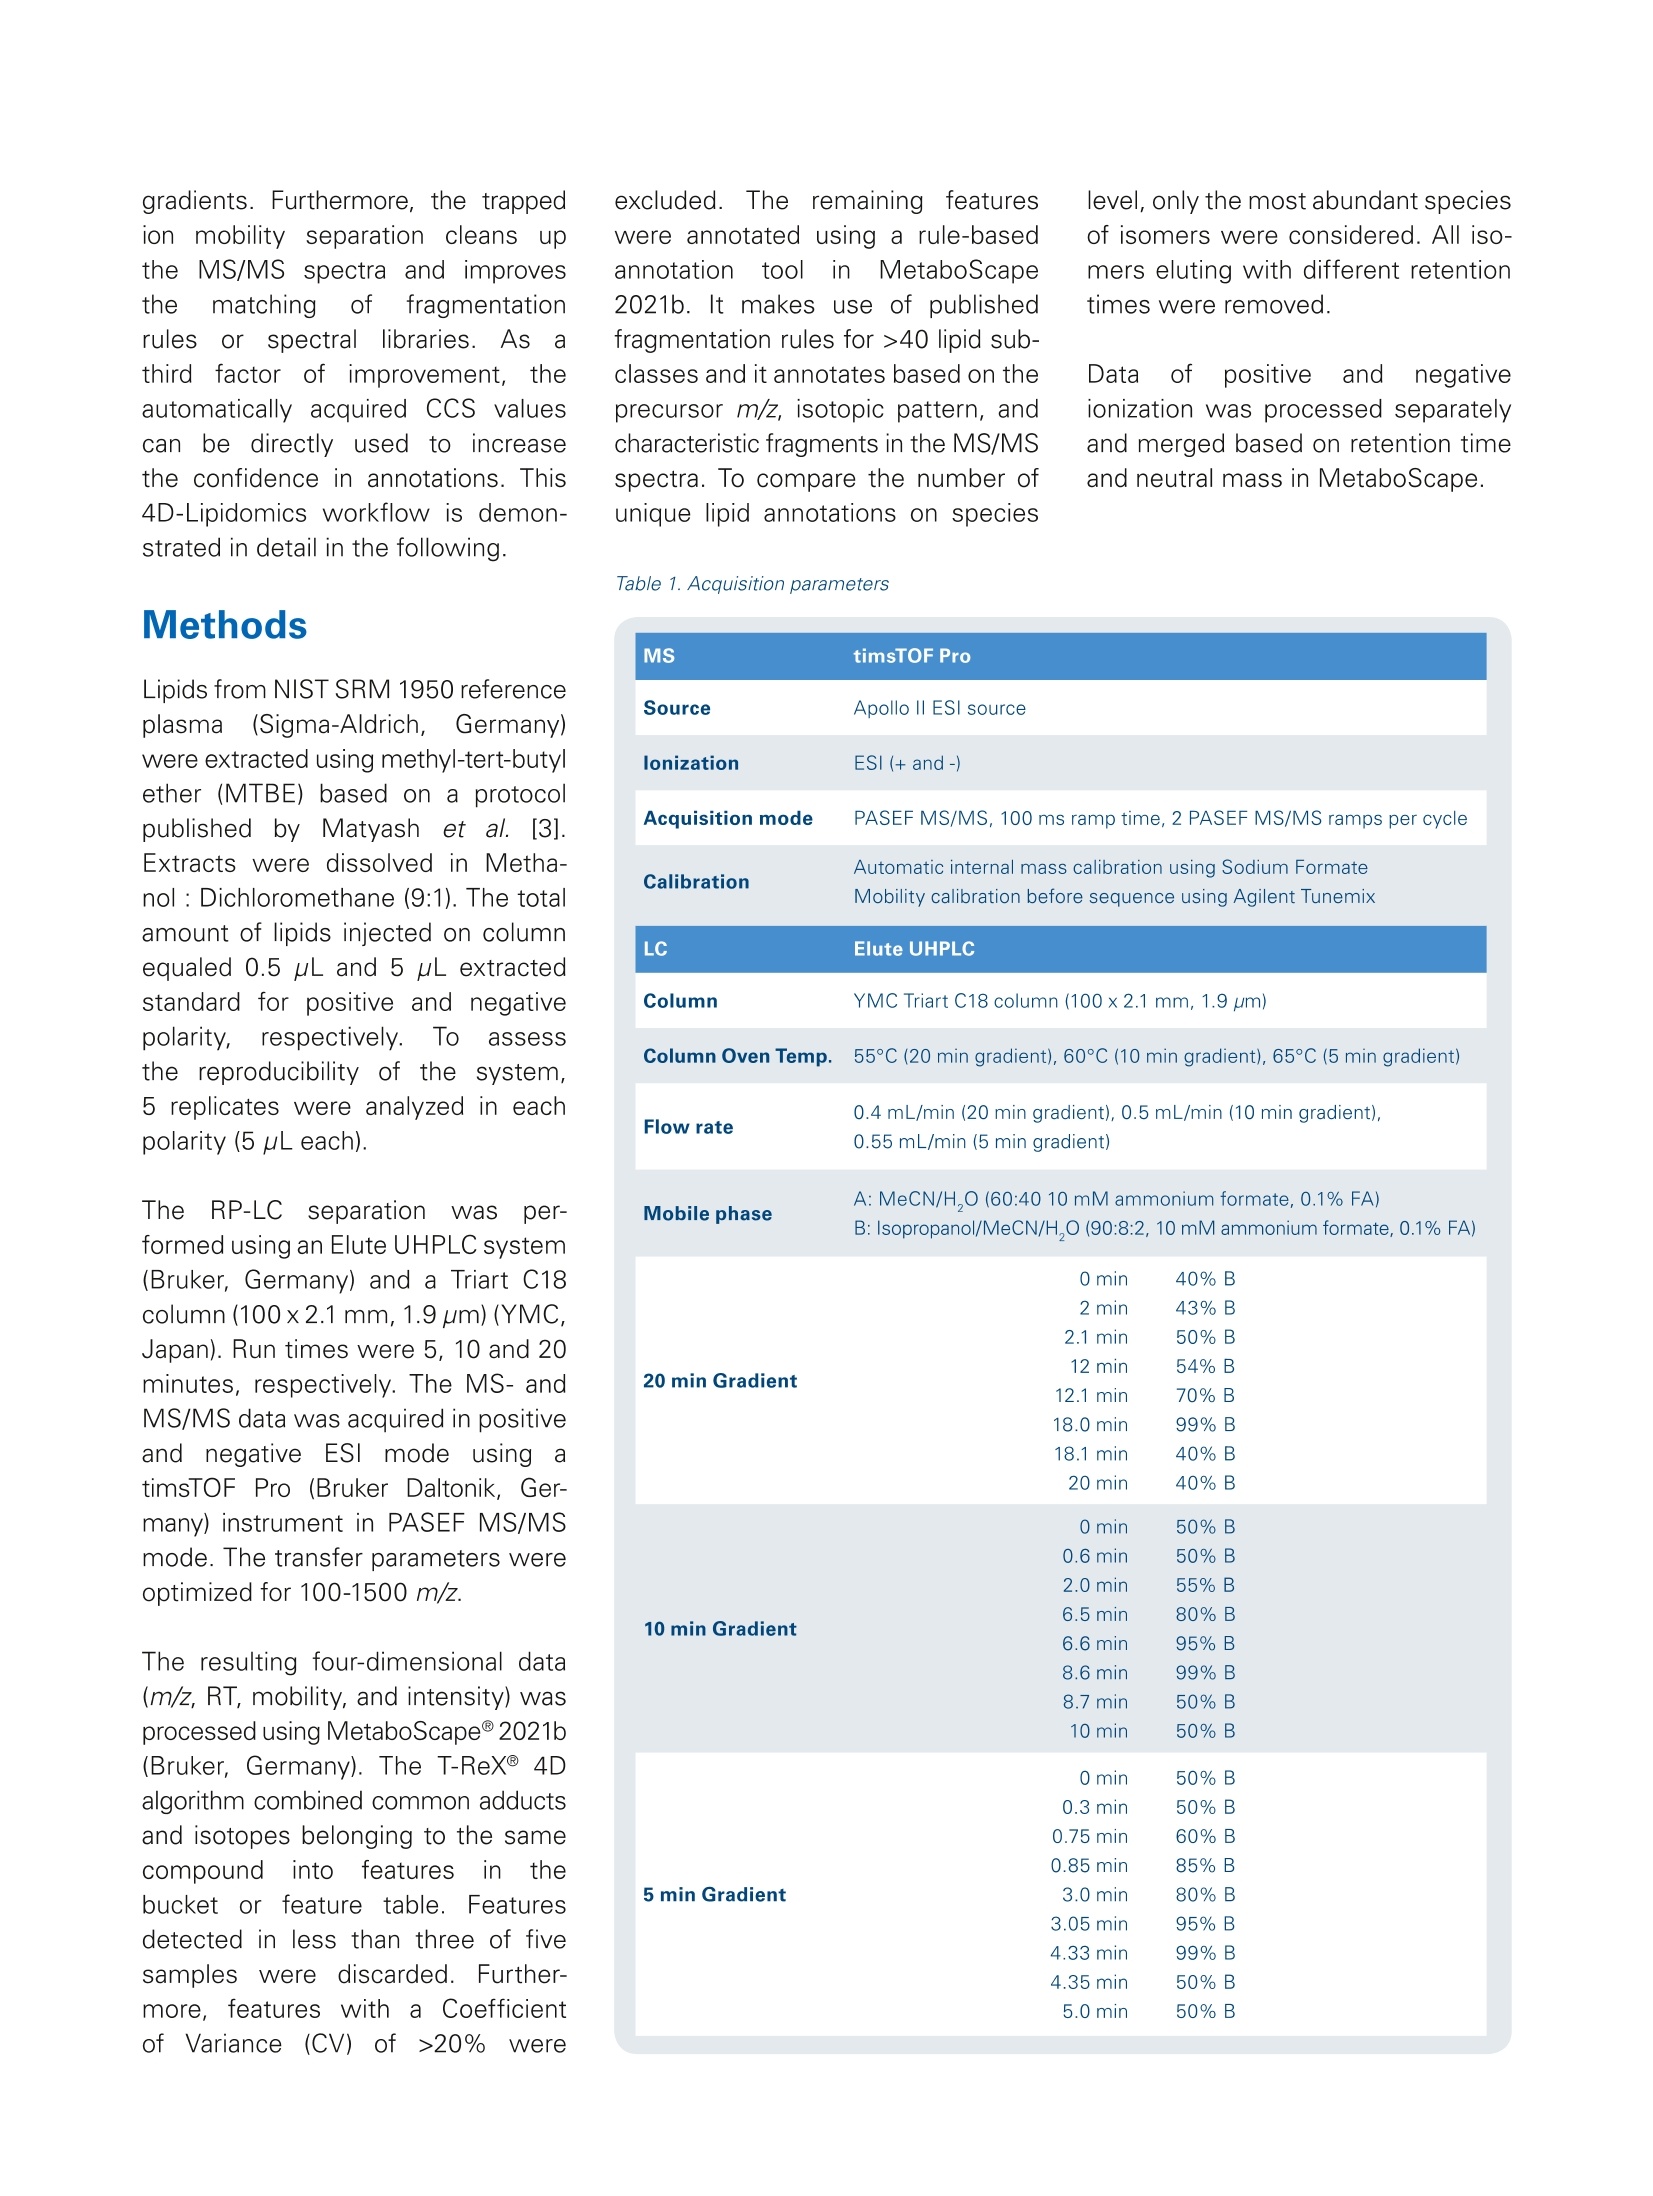
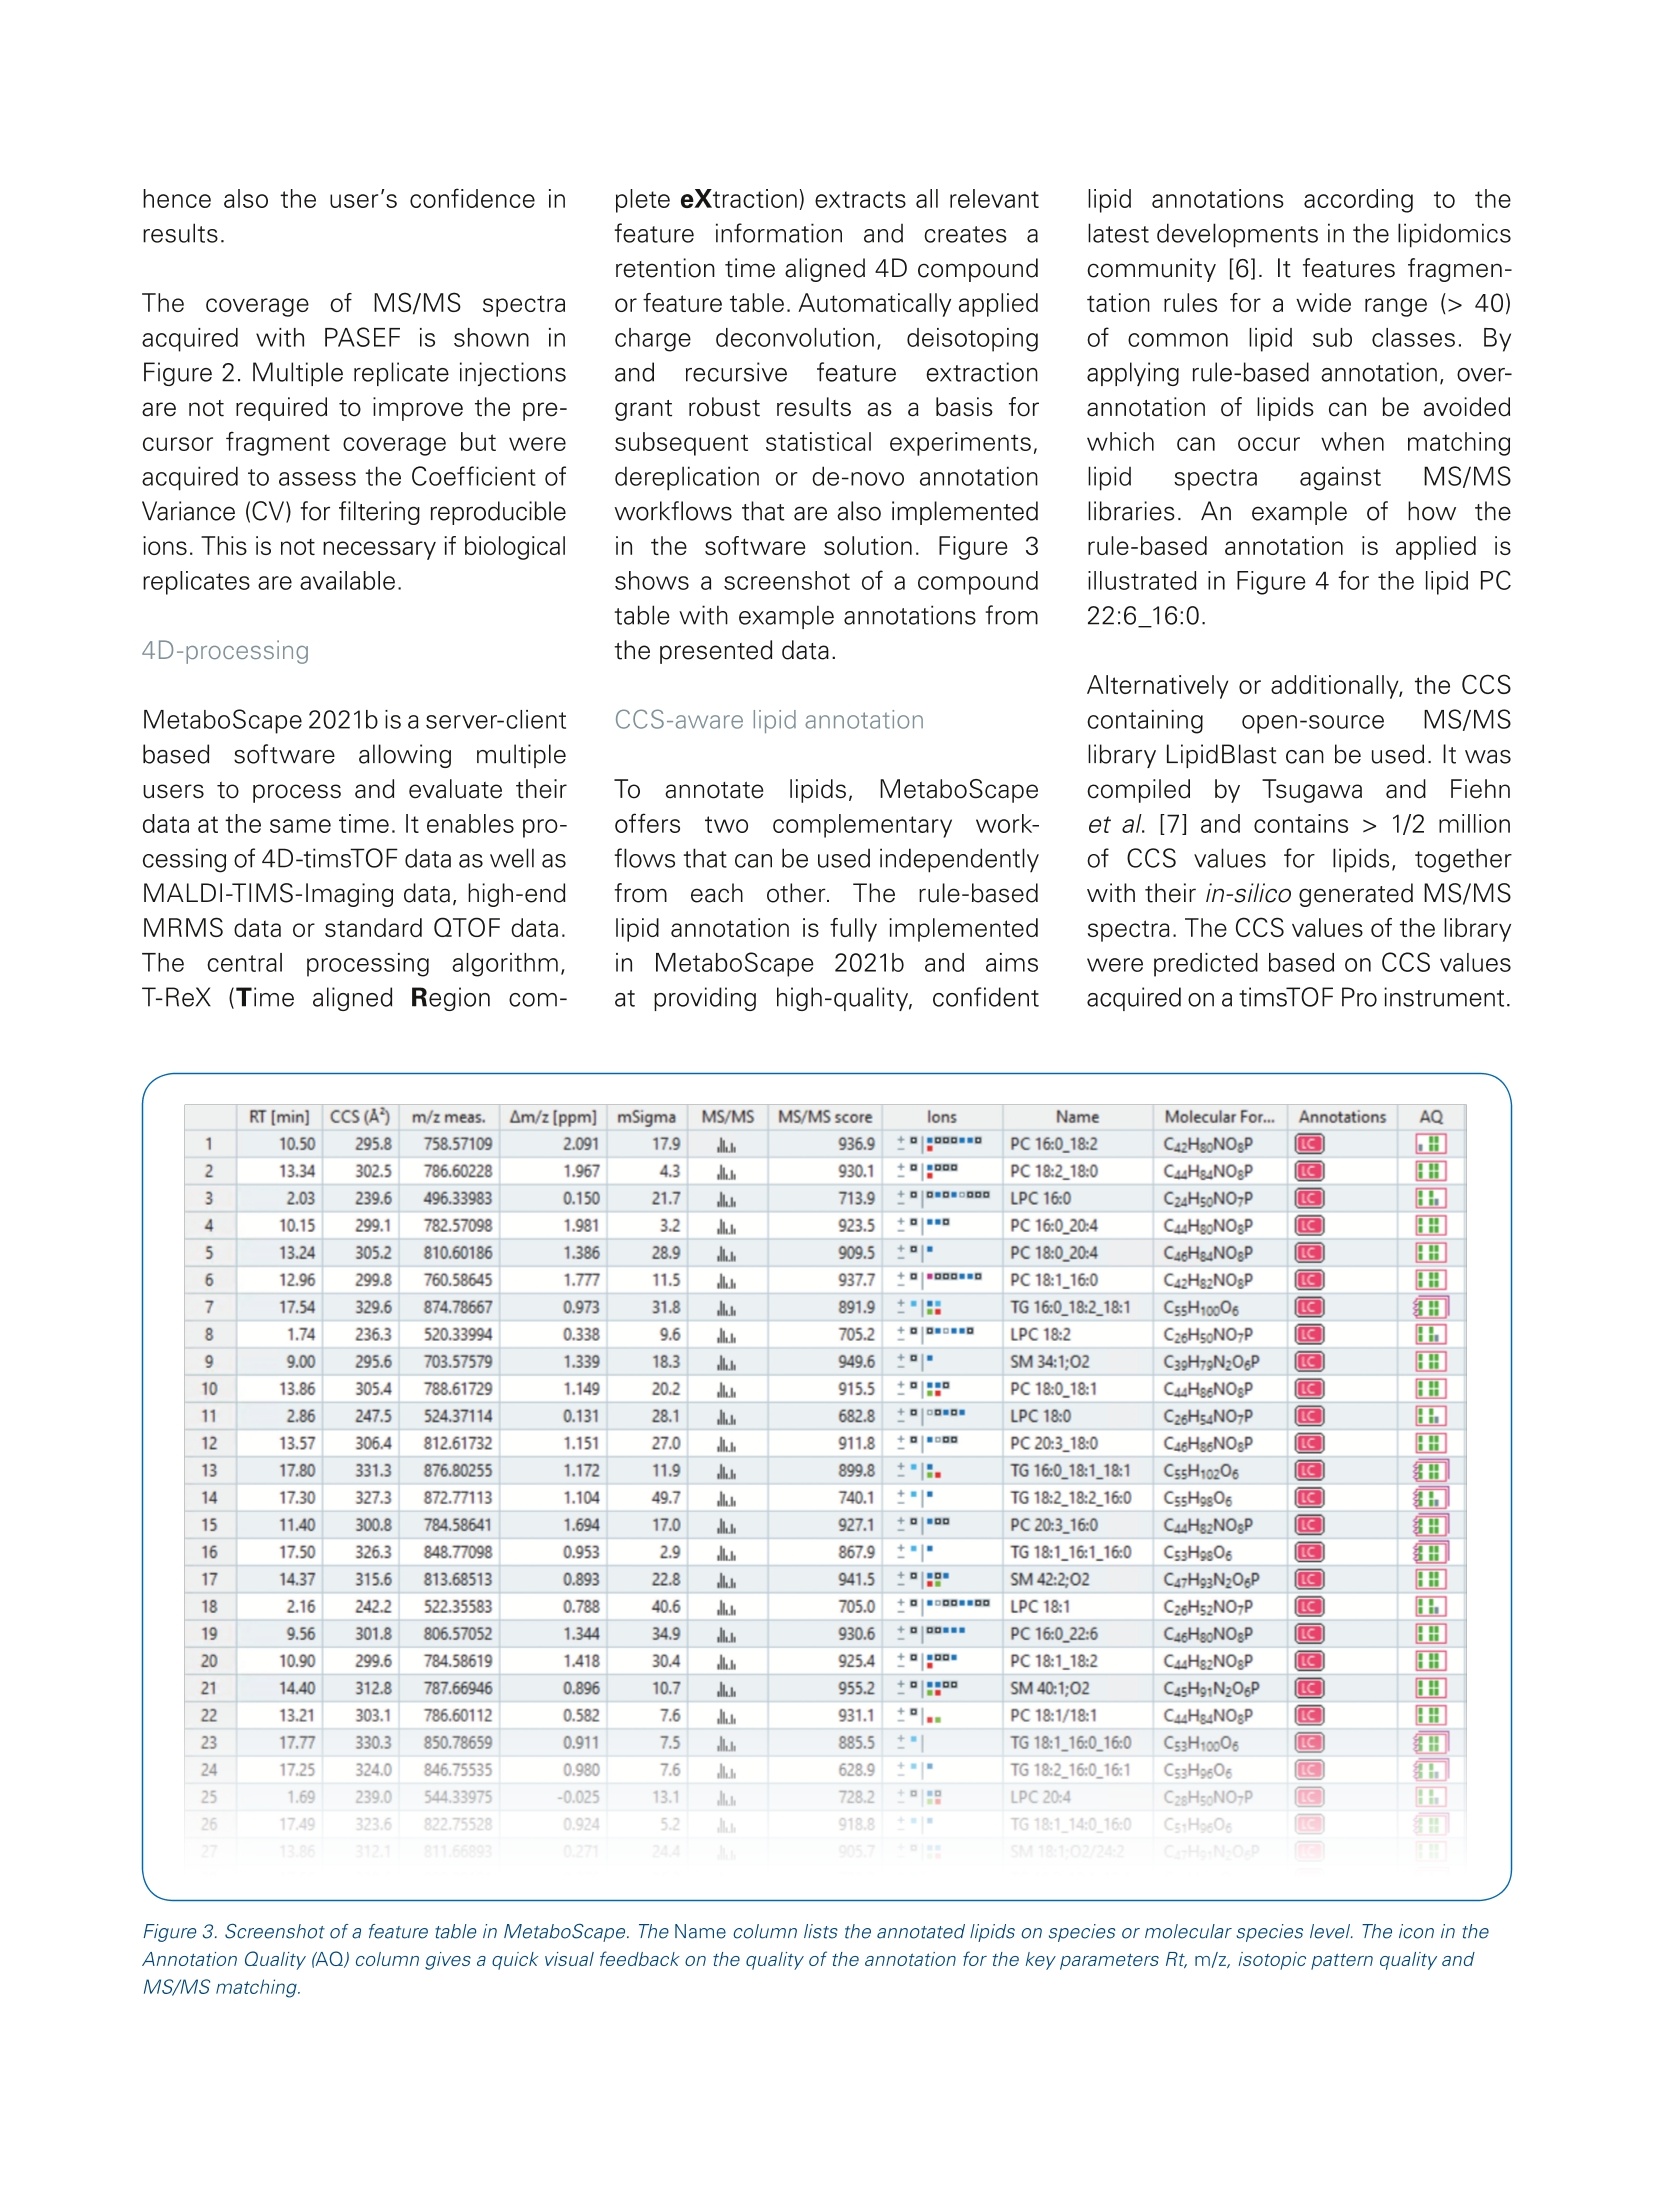
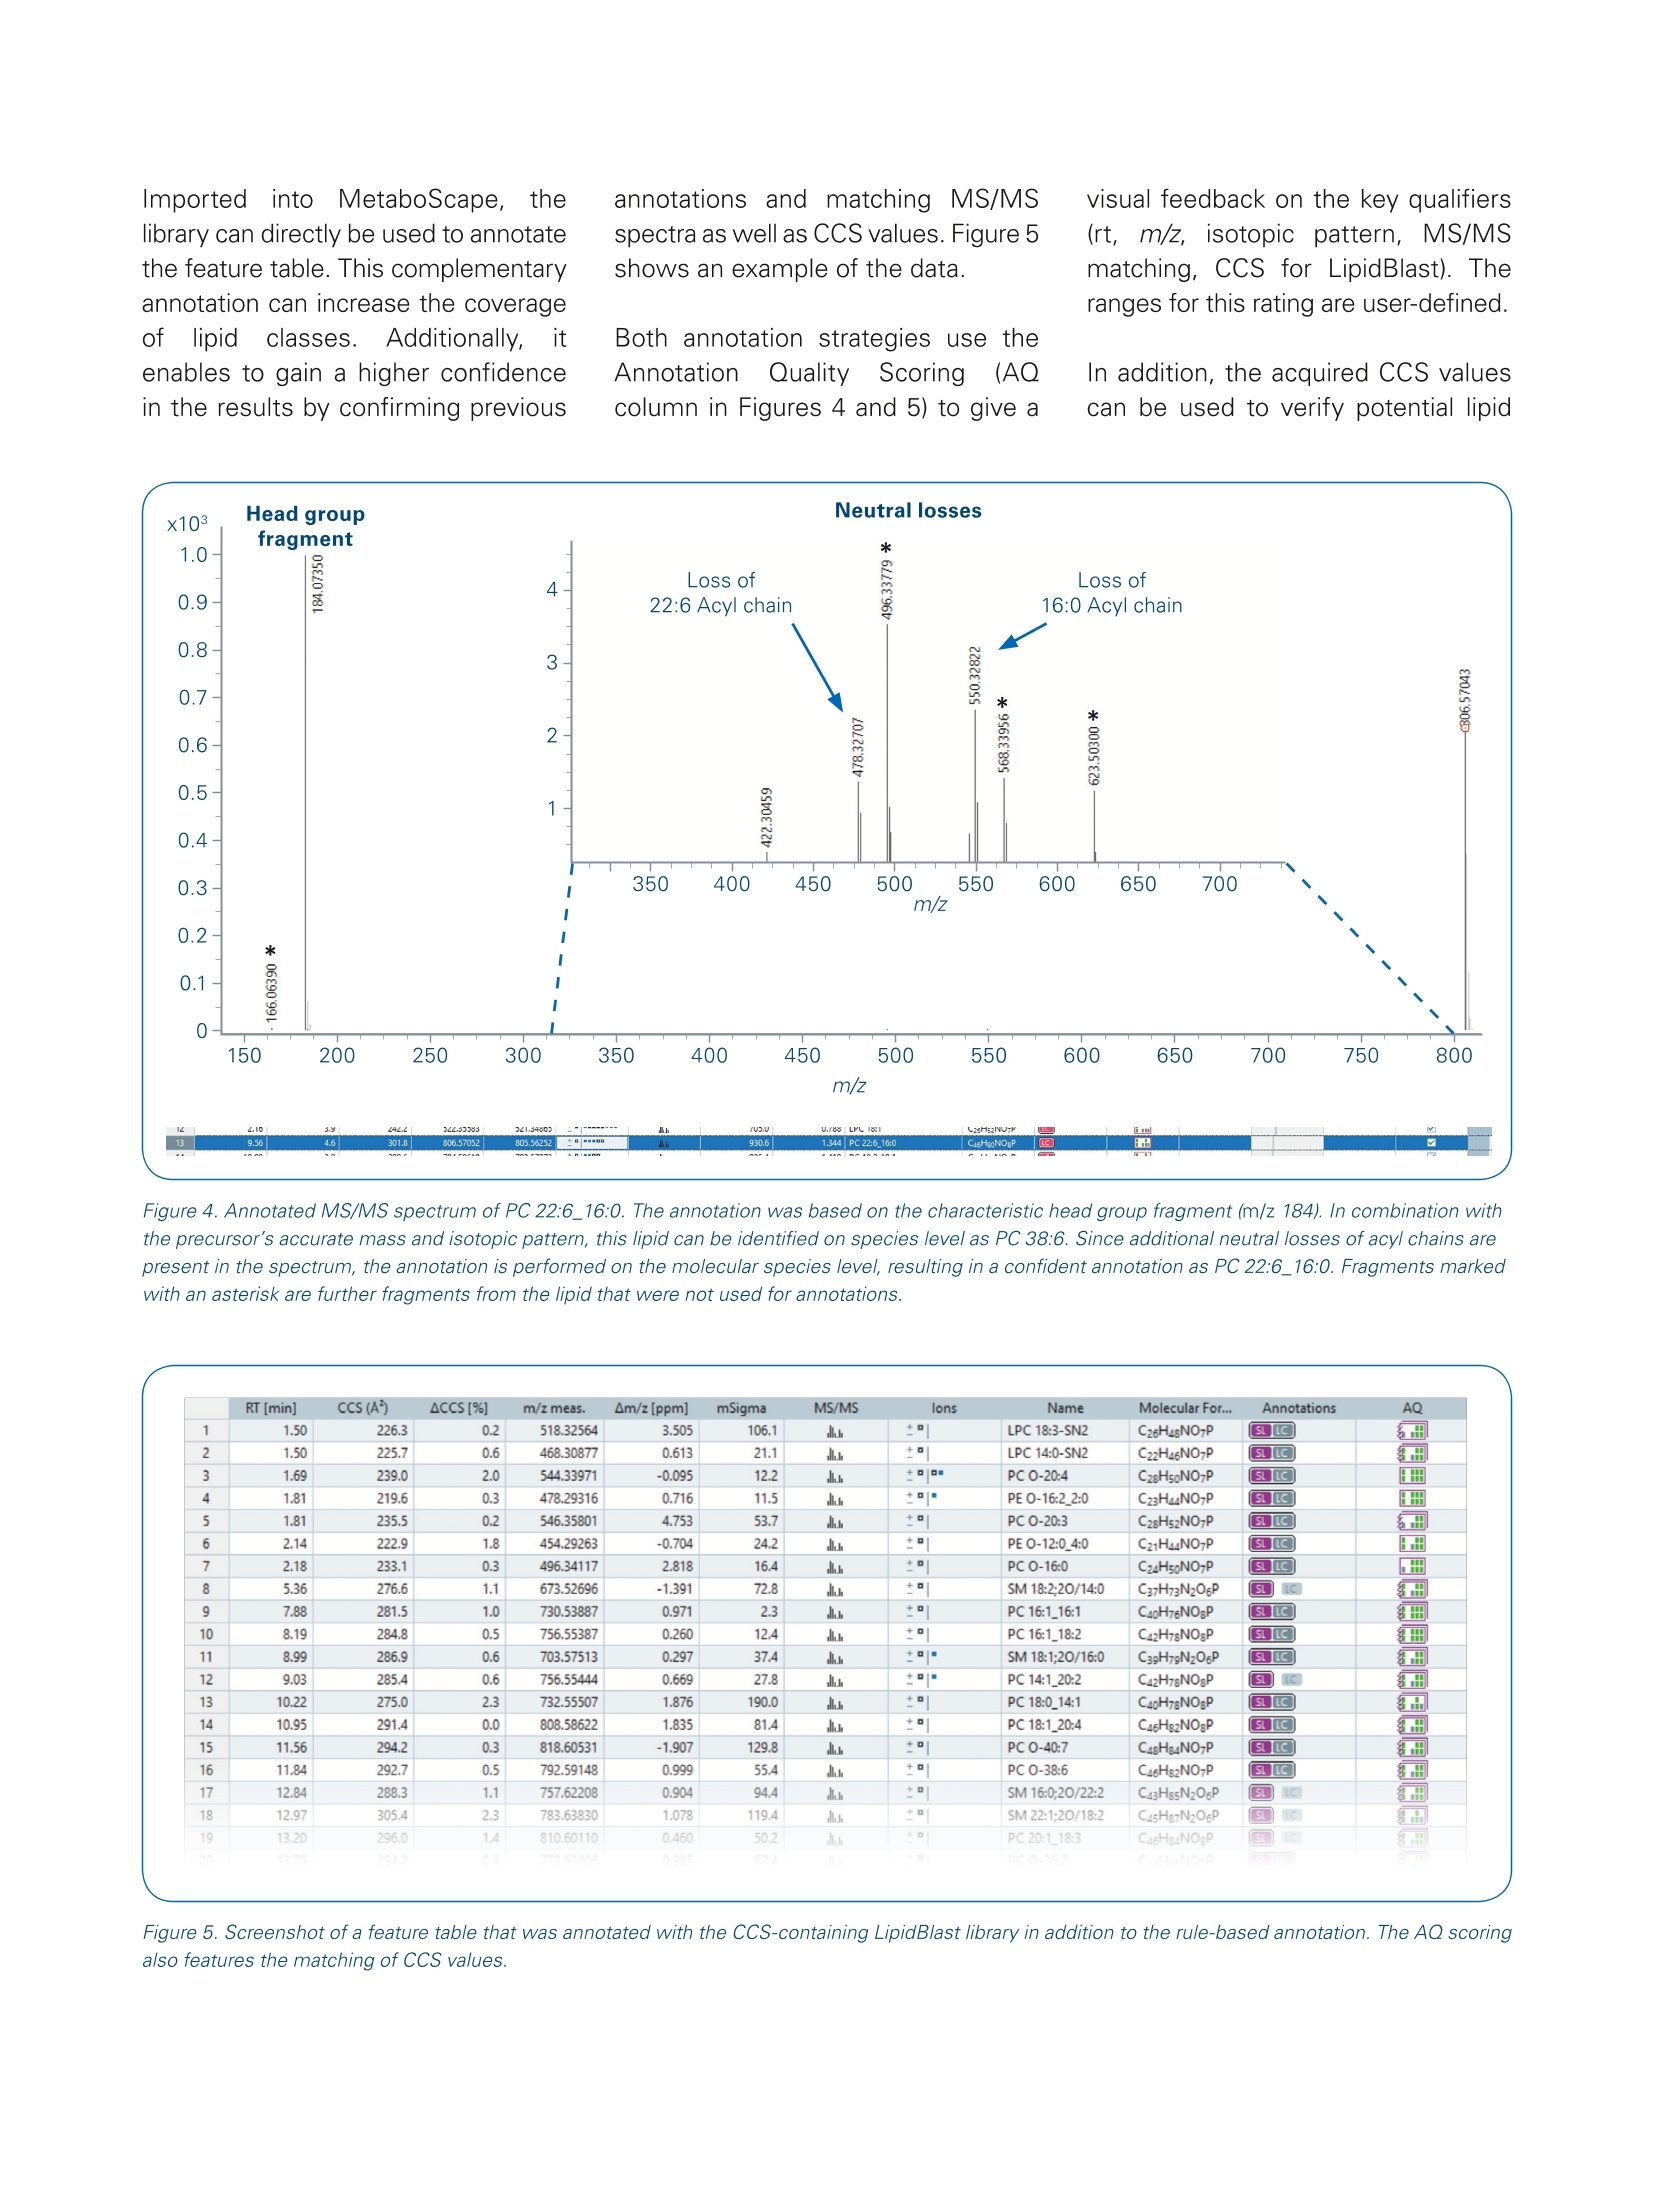
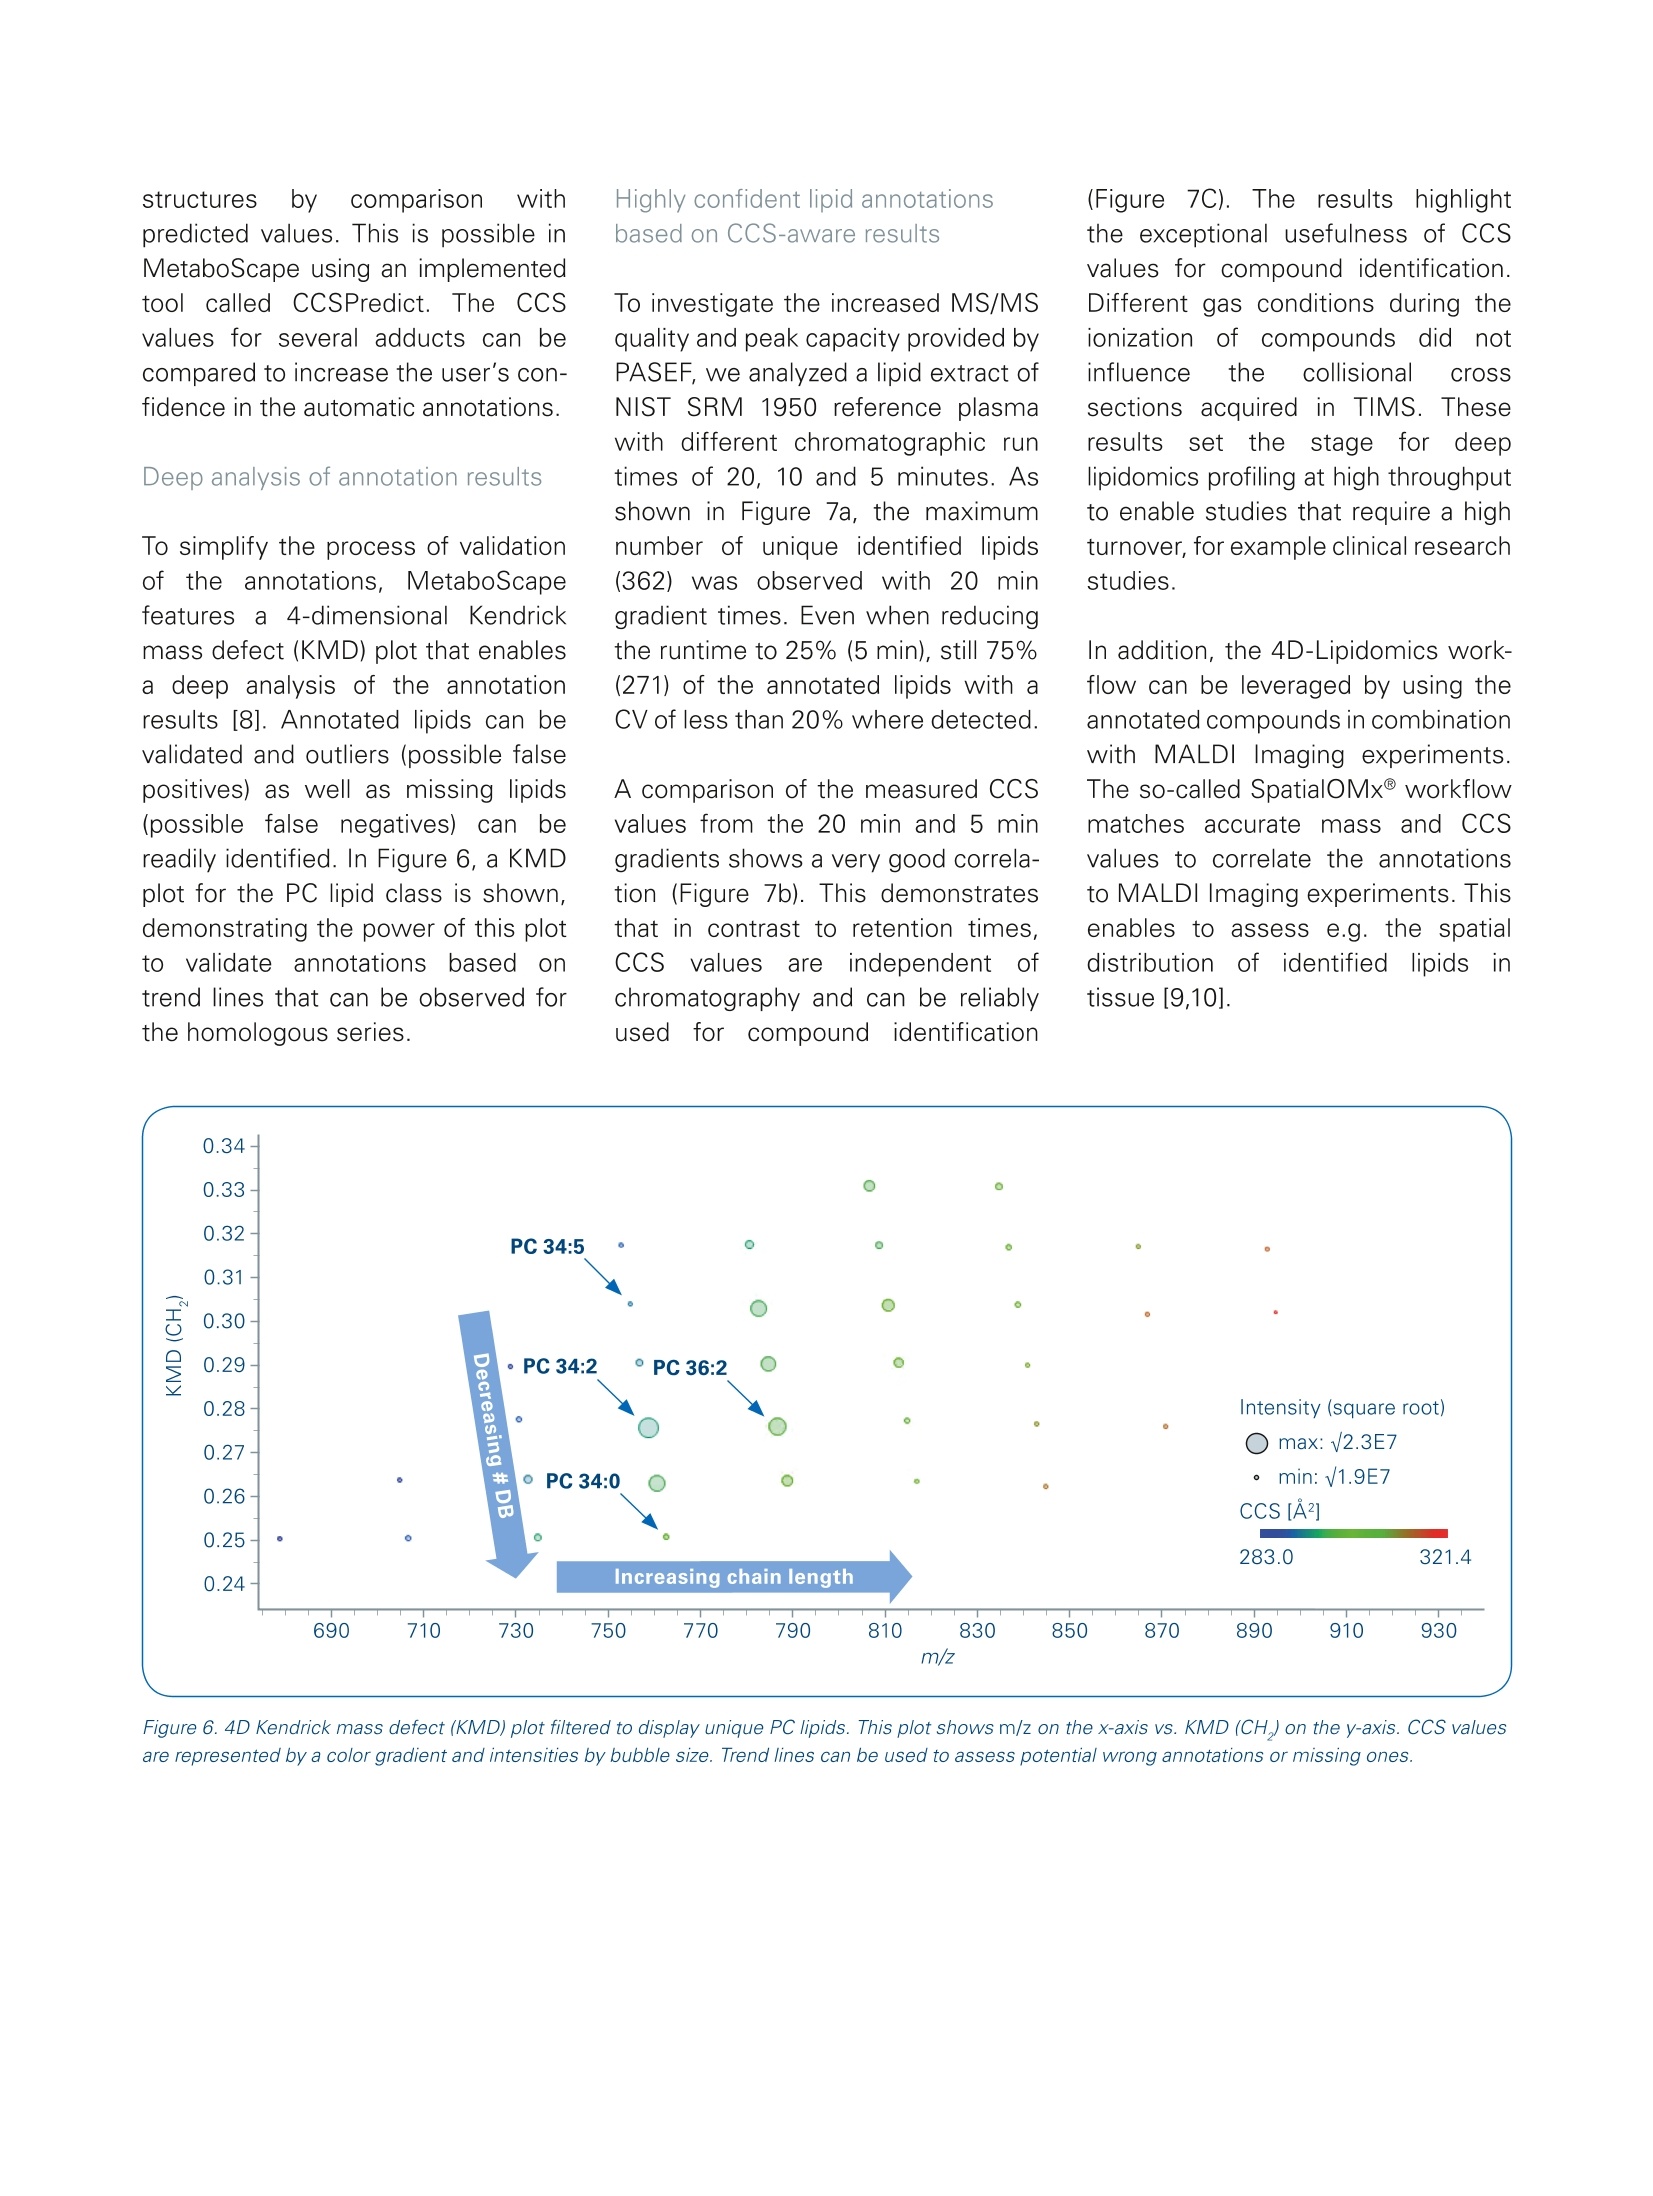
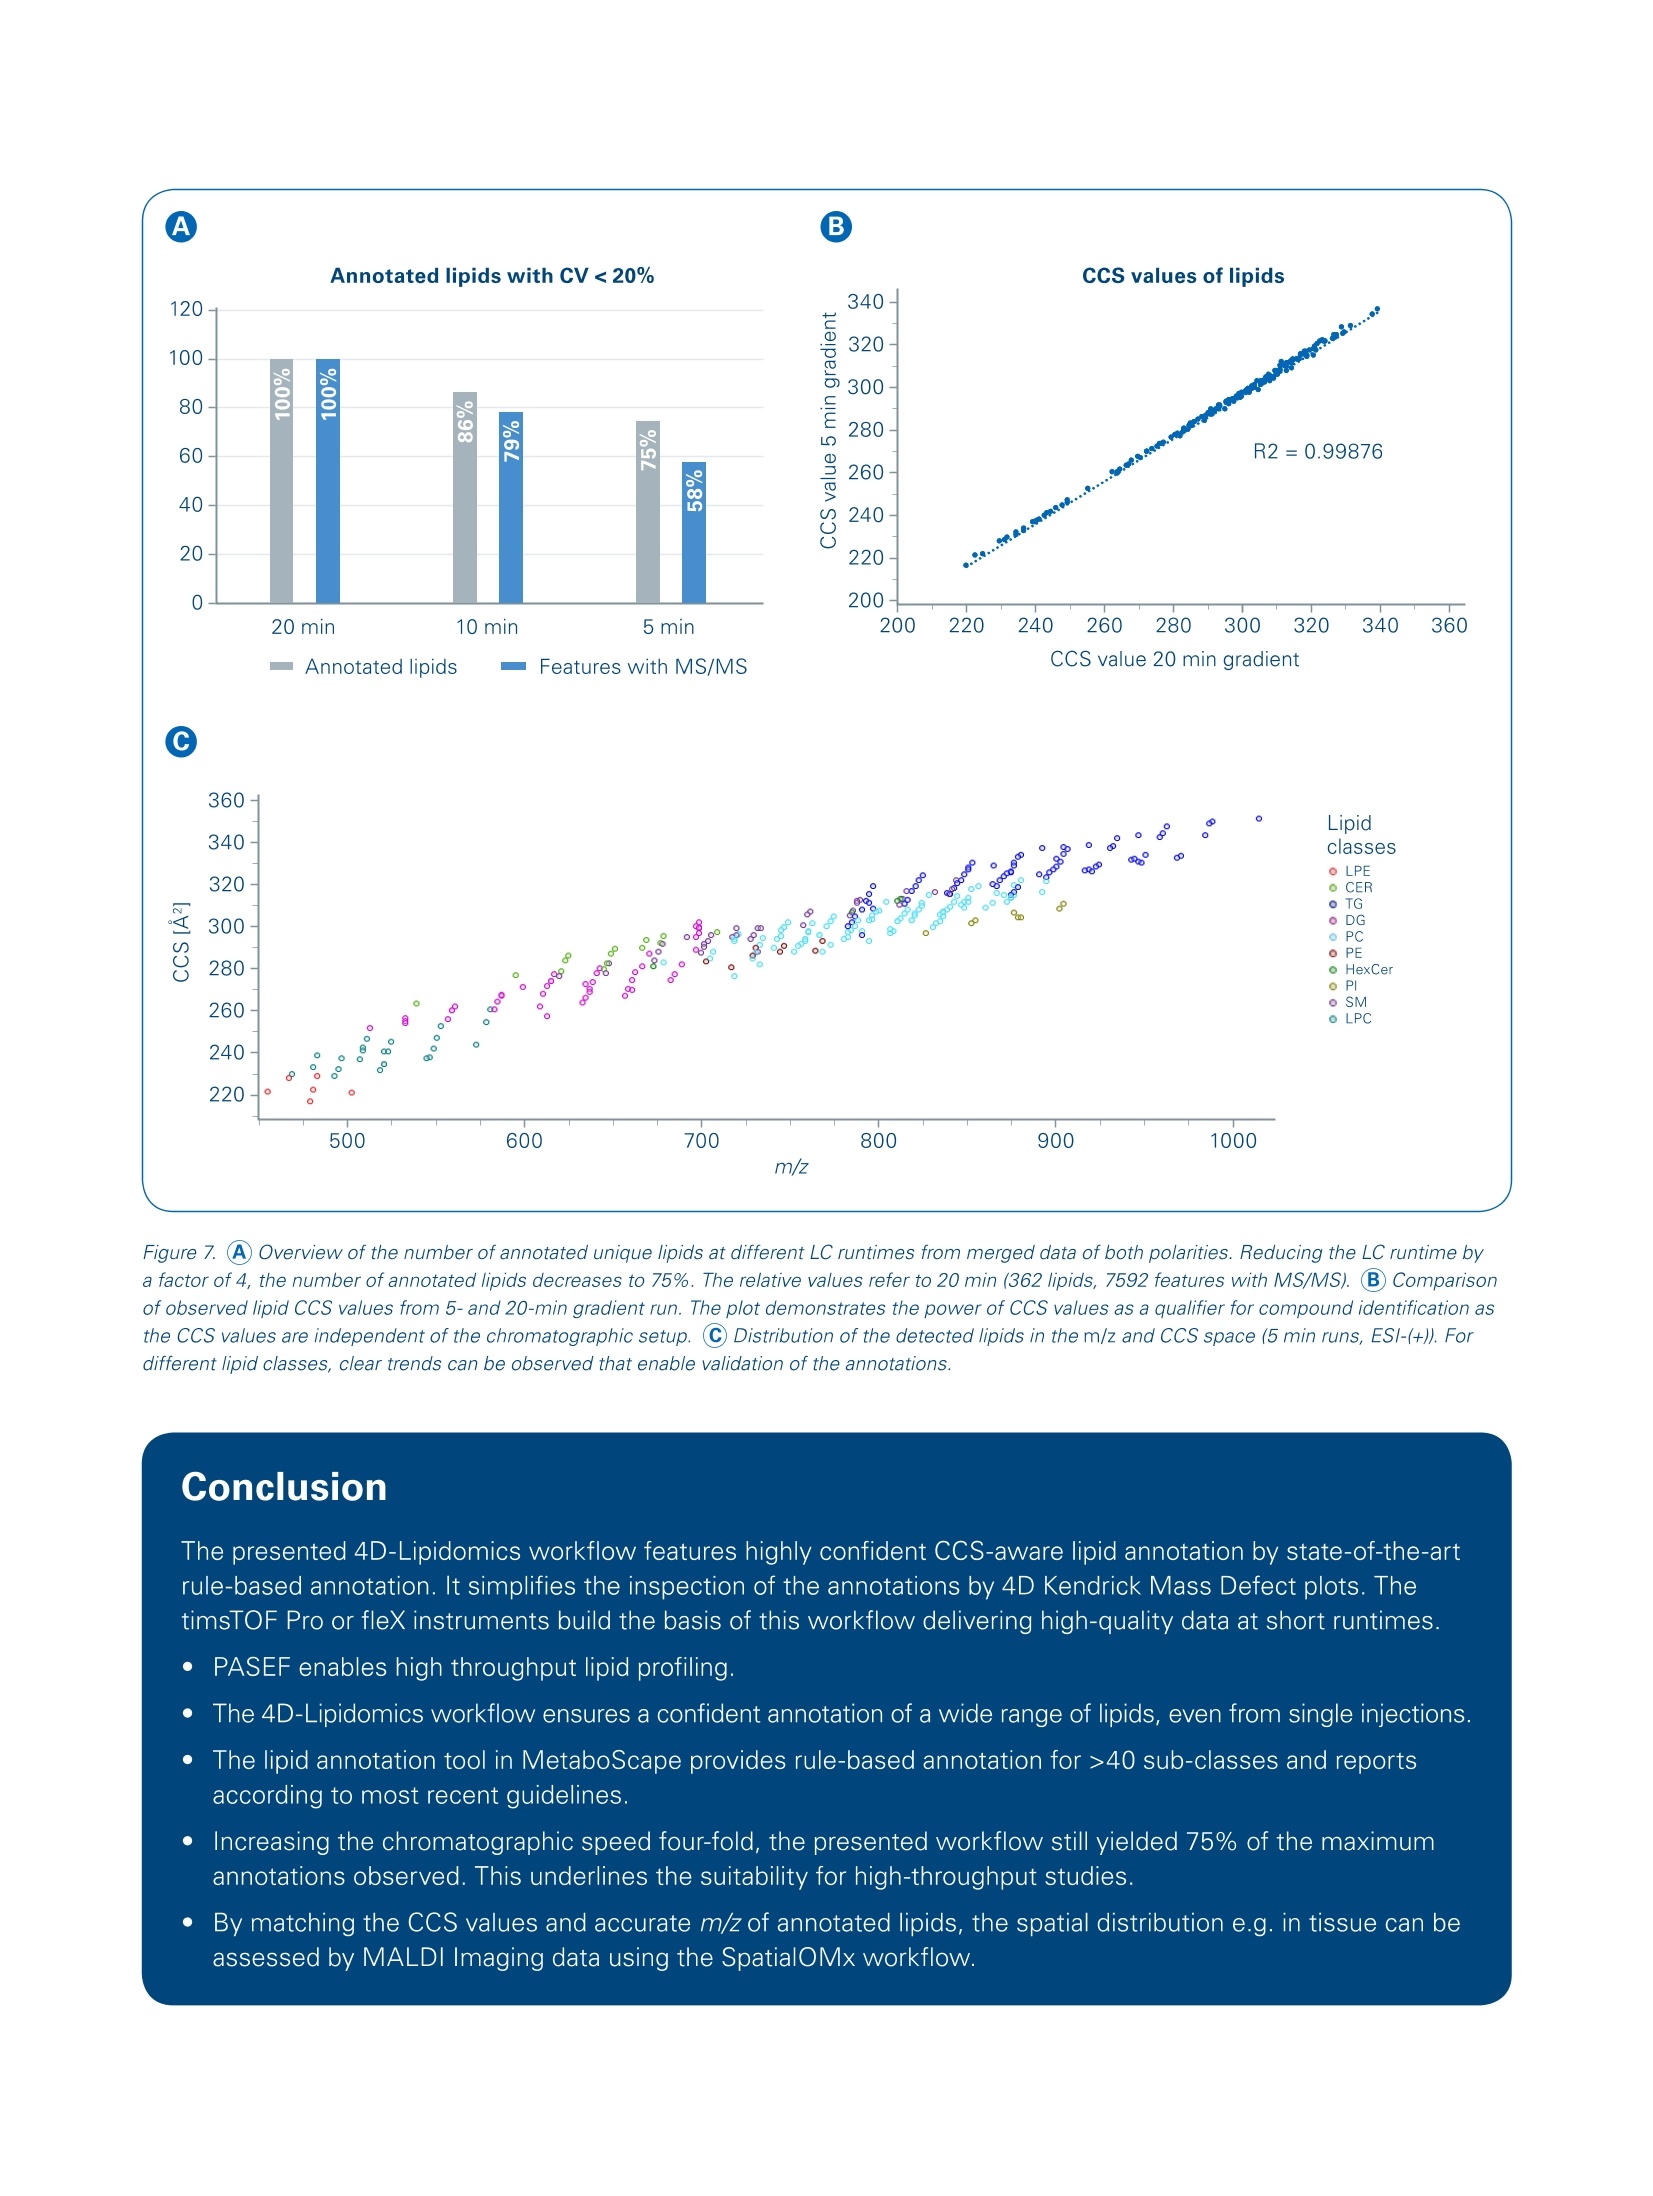
Authors: Florian Zubeil, Heino M. Heyman, Ansgar Korf, Aiko Barsch, Sven W. Meyer; Bruker Daltonik GmbH, Bremen, Germany. 4D-Lipidomicsworkflow for increased throughput Lipid profiling from complex lipid extracts can be a challenging and time consumingtask. The high complexity of samples and co-elution of isobaric or isomeric com-pounds complicate the confident annotation of lipids. The presented 4D-Lipidomicsworkflow simplifies and streamlines the annotation and validation process usingmobility-enhanced MS data. Introduction Keywords:PASEF TIMS, lipidomics,4D-Lipidomics, KMDplot, SRM 1950, lipids,profiling,MetaboScape Lipids representinimportantcompoundd cl aass m m biologicalsystems as they play key rolesin cell membranes, in the energystorage or as signaling molecules.Thismakestheminterestingmarkers for studying biologicalsystems regarding clinical research [1]. At the same time,lipids depict a highly complexclass of compounds. Both, thestructural diversity aswellllasthe high dynamic range in con-centrations makes the analysisof lipid extracts challenging. Amajor bottleneck in lipid profilingis the annotation and subsequentvalidation of lipid assignments. Additionally, a high throughput isoften necessary,e.g. in phenomicsrelated large cohort studies. Using the timsTOF Pro ortimsTOF fleX systems, aa highMS/MS coverage can be achievedby the PASEF@ [2]acquisitionmode.,even with single in-jections and when using fast LC gradients. Furthermore, the trappedion mobility separation cleanssupthe MS/MS spectra and improvesthe matching of fragmentationrules or spectrall llibraries. As athirddfactor oftiimprovement, theautomatically acquired CCS valuescan be directly used to increasethe confidence in annotations. This4D-Lipidomics workflow is demon-strated in detail in the following. Methods Lipids from NIST SRM 1950 referenceplasma (Sigma-Aldrich,Germany)were extracted using methyl-tert-butylether (MTBE) based on a protocolpublished by Matyasheet al.[3].Extracts were dissolved in Metha-nol : Dichloromethane (9:1). The totalamount of lipids injected on columnequaled 0.5 pL and 5 pL extractedstandard for positive and negativepolarity, respectively. To assessthe reproducibility ofof thesystem,5 replicates were analyzed in eachpolarity (5 pL each). TheRP-LC separationwas per-formed using an Elute UHPLC system(Bruker, Germany) and a Triart C18column (100x2.1 mm, 1.9 um) (YMC,Japan). Run times were 5, 10 and 20minutes, respectively. The MS- andMS/MS data was acquired in positiveand negative EEsilmode usingatimsTOF Pro (Bruker Daltonik, Ger-many) instrument in PASEF MS/MSmode. The transfer parameters wereoptimized for 100-1500 m/z. The resulting four-dimensional data(m/z, RT, mobility, and intensity) wasprocessed using MetaboScape@2021b(Bruker, Germany). The T-ReX 4Dalgorithm combined common adductsand isotopes belonging to the samecompoundinto features in thebucket or feature table. Featuresdetected in less than three of fivesamples; were ddiscarded. Further-more, featureswith a Coefficientof Variance (CV)/) of>20% Were excluded.l.The remaining featureswere annotated using a rule-basedannotation tool in MetaboScape2021b. It makes use of publishedfragmentation rules for >40 lipid sub-classes and it annotates based on theprecursor m/z, isotopic pattern, andcharacteristic fragments in the MS/MSspectra. To compare the number ofunique lipid annotations on species Dataaot positive and negativeionization was processed separatelyand merged based on retention timeand neutral mass in MetaboScape. Table 1. Acquisition parameters MS 0 min 40%B 20 min Gradient 2 min 43% B lonization 2.1 min 50%B Acquisition mode 12 min 54%B Calibration 12.1 min 70% B 18.0 min 99%B LC 18.1 min 40%B Column 20 min 40%B 10 min Gradient 0 min 50% B Flow rate 0.6 min 50%B 2.0 min 55%B 6.5 min 80%B Mobile phase 6.6 min 95% B 8.6 min 99%B 8.7 min 50%B 10 min 50%B 5 min Gradient 0 min 50%B 0.3 min 50% B 0.75 min 60%B 0.85 min 85% B 3.0 min 80% B 3.05 min 95%B 4.33 min 99%B 4.35 min 50%B 5.0 min 50%B level, only the most abundant speciesof isomers were considered. All iso-mers eluting with different retentiontimes wereremoved. Results 4D-data acquisitior The aim of this study was to investi-gate the benefits of the timsTOF Pro/fleX-based 4D-Lipidomics worflow toprofile the lipid content of a SRM 1950extract. The scheme of the workflowis outlined in Figure 1. Each step willbe discussed in more detail in thefollowing. The timsTOFProo aand timsTOFfleXirinstruments arepttrappeddionmobility-enhanced QTOF masSspectrometers that provide aradvanced acquisition mode (PASEF)for high-speedandhigh-qualityMS/MS data [2,4,5]. Since confidentlipid identification is dependent on high-quality fragment spectra, botha comprehensive coverage as well assensitivity are of key importance fordownstream analysis. In addition togenerating cleaner MS/MS spectra,the trapped ion mobility separationautomatically acquires accurate andprecise CCS values that can be direct-ly used in CCS-aware processingsoftwares to increase the quality and Figure 1. Fully integrated 4D-Lipidomics workflow for confident lipid annotations in MetaboScape 2021b. Figure 2. The heatmap shows the coverage of fragmented precursors (red squares) across the whole retention time and mass range. The first time segmentwas excluded from the selection. Typical data has an MS/MS coverage of> 65% from single injections. hence also the user's confidence inresults. The coverage ofbfMS/MSspectraacquired with PASEF is shown inFigure 2. Multiple replicate injectionsare not required to improve the pre-cursor fragment coverage but wereacquired to assess the Coefficient ofVariance (CV) for filtering reproducibleions. This is not necessary if biologicalreplicates are available. 4D-processing MetaboScape 2021b is a server-clientbased software allowing multipleusers to process and evaluate theirdata at the same time. It enables pro-cessing of 4D-timsTOF data as well asMALDI-TIMS-Imaging data, high-endMRMS data or standard QTOF data.The centraall processing algorithm,T-ReX (Time aligned Region com- plete eXtraction) extracts all relevantfeature information and createsaretention time aligned 4D compoundor feature table.Automatically appliedcharge deconvolution, deisotopinganddrrecursive feature extractiongrant robust results as a basis forsubsequent statistical experiments,dereplication or de-novo annotationworkflows that are also implementedin the software solution. Figure 3shows a screenshot of a compoundtable with example annotations fromthe presented data. CCS-aware lipid annotation Too annotatellipids, MetaboScapeofferstwo complementary work-flows that can be used independentlytromeach other. The rule-basedlipid annotation is fully implementedin1IIMetaboScape 2021b and aimsat providing high-quality, confident lipid annotations according to thelatest developments in the lipidomicscommunity [6]. It features fragmen-tation rules for a wide range (> 40)of common lipid sub classes.Byapplying rule-based annotation, over-annotation of lipids can be avoidedwhich can occur when matchinglipid spectra against MS/MSlibraries. An example of how therule-based annotation is applied isillustrated in Figure 4 for the lipid PC22:6_16:0. Alternatively or additionally, the CCScontaininggopen-source MS/MSlibrary LipidBlast can be used. It wascompiled byyTsugawa andFiehnet al. [7] and contains> 1/2 millionof CCS values for lipids, togetherwith their in-silico generated MS/MSspectra. The CCS values of the librarywere predicted based on CCS valuesacquired on a timsTOF Pro instrument. Figure 3. Screenshot of a feature table in MetaboScape. The Name column lists the annotated lipids on species or molecular species level. The icon in theAnnotation Quality (AQ) column gives a quick visual feedback on the quality of the annotation for the key parameters Rt, m/z, isotopic pattern quality andMS/MS matching. Importeddirinto MetaboScape, thelibrary can directly be used to annotatethe feature table. This complementaryannotation can increase the coverageof lipidclasses.Additionally. itenables to gain a higher confidencein the results by confirming previous annotations and matching MS/MSspectra as well as CCS values. Figure 5shows an example of the data. Both annotation strategies use theAnnotationn Quality Scoringg((AQcolumn in Figures 4 and 5) to give a visual feedback on the key qualifiers(rt, m/z,, isotopic pattern, MS/MSmatching, CCS for LipidBlast). Theranges for this rating are user-defined. In addition, the acquired CCS valuescan be used to verify potential lipid Figure 4. Annotated MS/MS spectrum of PC 22:6_16:0. The annotation was based on the characteristic head group fragment (m/z 184). In combination withthe precursor's accurate mass and isotopic pattern, this lipid can be identified on species level as PC 38:6. Since additional neutral losses of acy/ chains arepresent in the spectrum, the annotation is performed on the molecular species level, resulting in a confident annotation as PC 22:6_16:0. Fragments markedwith an asterisk are further fragments from the lipid that were not used for annotations. Figure 5. Screenshot of a feature table that was annotated with the CCS-containing LipidBlast library in addition to the rule-based annotation. The AQ scoringalso features the matching of CCS values. structures by comparison withpredicted values. This is possible inMetaboScape using an implementedtool called CCSPredict. The CCSvalues for several adducts can becompared to increase the user's con-fidence in the automatic annotations .Deep analysis of annotation results To simplify the process of validationotfthe annotations, MetaboScapefeatures a 4-dimensional Kendrickmass defect (KMD) plot that enablesa deep analysis of the annotationresults [8]. Annotated lipids can bevalidated and outliers (possible falsepositives) as well as missing lipids(possible false negatives)can bereadily identified. In Figure 6, a KMDplot for the PC lipid class is shown,demonstrating the power of this plotto validate annotations based ontrend lines that can be observed forthe homologous series. Highly confident lipid annotationsbased on CCS-aware results To investigate the increased MS/MSquality and peak capacity provided byPASEF, we analyzed a lipid extract ofNIST SRM 1950 reference plasmawith different chromatographic runtimes of 20, 10 and 5 minutes. Asshown in Figure 7a, the maximumnumber of unique identified lipids(362) was observed with 20 minaradient times. Even when reducingthe runtime to 25%(5 min), still 75%(271) of the annotated lipids with aCV of less than 20% where detected. A comparison of the measured CCSvalues from the 20 min and 5 mingradients shows a very good correla-tion (Figure 7b). This demonstratesthat in contrast to retention times,CCSi valuesareindependentOfchromatography and can be reliablyusedfor compound iidentification (Figure 7C). The resultsshighlightthe exceptional usefulness of CCSvalues for compound identification.Different gas conditions during theionization coffcompounds didrnotinfluence the collisional crosssections acquired inTIMS. TTheseresultsisset thestagefor deeplipidomics profiling at high throughputto enable studies that require a highturnover, for example clinical researchstudies. In addition, the 4D-Lipidomics work-flow can be leveraged by using theannotated compounds in combinationwith MALDI Imaging experiments.The so-called SpatialOMx@workflowmatches accurate mass and CCSvalues to correlate the annotationsto MALDI Imaging experiments. Thisenables to assess e.g. the spatialdistribution off iicdentifiedlipids intissue [9,10]. Figure 6. 4D Kendrick mass defect (KMD) plot filtered to display unique PC lipids. This plot shows m/z on the x-axis vs. KMD (CH,) on the y-axis. CCS valuesare represented by a color gradient and intensities by bubble size. Trend lines can be used to assess potential wrong annotations or missing ones. Figure 7. A Overview of the number of annotated unique lipids at different LC runtimes from merged data of both polarities. Reducing the LC runtime bya factor of 4, the number of annotated lipids decreases to 75%. The relative values refer to 20 min (362 lipids, 7592 features with MS/MS). B Comparisonof observed lipid CCS values from 5- and 20-min gradient run. The plot demonstrates the power of CCS values as a qualifier for compound identification asthe CCS values are independent of the chromatographic setup. C Distribution of the detected lipids in the m/z and CCS space (5 min runs, ESl-(+)). Fordifferent lipid classes, clear trends can be observed that enable validation of the annotations. Conclusion The presented 4D-Lipidomics workflow features highly confident CCS-aware lipid annotation by state-of-the-artrule-based annotation. It simplifies the inspection of the annotations by 4D Kendrick Mass Defect plots. ThetimsTOF Pro or fleX instruments build the basis of this workflow delivering high-quality data at short runtimes. PASEF enables high throughput lipid profiling. The 4D-Lipidomics workflow ensures a confident annotation of a wide range of lipids, even from single injections. The lipid annotation tool in MetaboScape provides rule-based annotation for >40 sub-classes and reportsaccording to most recent guidelines. Increasing thechromatographic speed four-fold, the presented workflow still yielded 75% of the maximumannotations observed. This underlines the suitability for high-throughput studies. By matching the CCS values and accurate m/z of annotated lipids, the spatial distribution e.g. in tissue can beassessed by MALDI Imaging data using the SpatialOMx workflow. Learn More You are looking for further Information?Check out the link or scan the QR code. www.bruker.com/timstofpro ( R e fe ren ce s ) [1] Zullig et al. (2020), Mass Spectrom. Rev., early view, https://doi.org/10.1002/mas.21627 [2] Mann et al. (2018), Mol Cell Proteomics, 17(12):2534-2545.doi: 10.1074/mcp.TIR118.000900. Epub 2018 Nov 1. [3] Matyash, V.et al., J. Lipid Res.,49, 1137-1146 (2008) [4] Application Note LCMS-158, Using Parallel Accumulation Serial Fragmentation (PASEF) to speed up untargeted 4Dlipidomics LC-MS/MS workflows. [5] Application Note LCMS-175, Investigating the increased lifespan in C. elegans daf-2 mutants by 4D-Lipidomics. [6]] Liebisch et al., The Journal of Lipid Research,61, 1539-1555. [7] TTsugawaet al.(2020), Nature Biotechnology, 38, 1159-1163. [8] Hayen et al. (2018), Rapidcommunications in mass spectrometry, 32, 981-991. https://doi.org/10.1002/rcm.8117 [9] Hayen et al. (2021), Anal. Chem., 93, 4,2135-2143. https://pubs.acs.org/doi/abs/10.1021/acs.analchem.0c03942 [10] Helmer et al.(2021), Analytical Chemistry. For Research Use Only. Not for Use in Clinical Diagnostic Procedures. Bruker Daltonik GmbHBru ker Sc ien tif ic LLC Bremen·GermanyBillerica, MA · USAPhone +49(0)421-2205-0Phone +1 (978) 663-3660 Lipids represent an important compound class in biological systems as they play key roles in cell membranes, in the energy storage or as signaling molecules.This makes them interesting markers for studying biological systems regarding clinical research. At the same time, lipids depict a highly complex class of compounds. Both, thestructural diversity as well as the high dynamic range in concentrations makes the analysis of lipid extracts challenging. A major bottleneck in lipid profiling is the annotation and subsequent validation of lipid assignments. Additionally, a high throughput is often necessary, e.g. in phenomics related large cohort studies.Using the timsTOF Pro or timsTOF fleX systems, a high MS/MS coverage can be achieved by the PASEF® acquisition mode, even with single injections and when using fast LC gradients. Furthermore, the trapped ion mobility separation cleans up the MS/MS spectra and improves the matching of fragmentation rules or spectral libraries. As a third factor of improvement, theautomatically acquired CCS values can be directly used to increase the confidence in annotations. This 4D-Lipidomics workflow is demonstrated in detail in the following.
确定

还剩6页未读,是否继续阅读?

布鲁克·道尔顿(Bruker Daltonics)为您提供《脂质中高通量工作流程检测方案(液质联用仪)》,该方案主要用于绒毛膜组织中高通量工作流程检测,参考标准--,《脂质中高通量工作流程检测方案(液质联用仪)》用到的仪器有
相关方案
更多
该厂商其他方案
更多