


采用美国Artium公司的相位多普勒粒子干涉仪,对燃料喷雾的液滴粒径和速度进行了测量,探索研发先进的低排放喷油器和高带宽燃油流量调节阀。
方案详情

https://ntrs.nasa.gov/search.jsp?R=20150023047 2019-01-21T07:39:31+00:00ZNASA/CR—2015-218899 NASA STI Program ... in Profile Development of Advanced Low Emission Injectorsand High-Bandwidth Fuel Flow Modulation Valves Adel Mansour Parker Hannifin Corporation, Mentor, Ohio Since its founding, NASA has been dedicatedto the advancement of aeronautics and space science.The NASA Scientific and Technical Information (STI)Program plays a key part in helping NASA maintainthis important role. The NASA STI Program operates under the auspicesof the Agency Chief Information Officer. It collects,organizes, provides for archiving, and disseminatesNASA’s STI. The NASA STI Program provides accessto the NASA Technical Report Server-Registered(NTRS Reg) and NASA Technical Report Server—Public (NTRS) thus providing one of the largestcollections of aeronautical and space science STI inthe world. Results are published in both non-NASAchannels and by NASA in the NASA STI ReportSeries,which includes the following report types: TECHNICAL PUBLICATION.Reports ofcompleted research or a major significant phaseof research that present the results of NASAprograms and include extensive data or theoreticalanalysis. Includes compilations of significantscientific and technical data and informationdeemed to be ofcontinuing reference value.NASA counter-part of peer-reviewed formalprofessional papers, but has less stringentlimitations on manuscript length and extent ofgraphic presentations. TECHNICAL MEMORANDUM. Scientificand technical findings that are preliminary or ofspecialized interest, e.g.,“quick-release”reports,working papers, and bibliographies that containminimal annotation. Does not contain extensiveanalysis. CONTRACTOR REPORT. Scientific andtechnical findings by NASA-sponsoredcontractors and grantees. . CONFERENCE PUBLICATION. Collectedpapers from scientific and technicaconferences, symposia, seminars, or othermeetings sponsored or co-sponsored by NASA. SPECIAL PUBLICATION. Scientific.technical, or historical information fromNASA programs, projects, and missions, oftenconcerned with subjects having substantialpublic interest. TECHNICAL TRANSLATION. English-language translations of foreign scientific andtechnical material pertinent to NASA’s mission. For more information about the NASA STIprogram, see the following: ● Access the NASA STI program home page athttp://www.sti.nasa.gov E-mail your question to help@sti.nasa.gov Fax your question to the NASA STIInformation Desk at 757-864-6500 . Telephone the NASA STI Information Desk at757-864-9658 Write to: NASA STI ProgramMail Stop 148NASA Langley Research CenterHampton, VA 23681-2199 Development of Advanced Low Emission Injectorsand High-Bandwidth Fuel Flow Modulation Valves Adel Mansour Parker Hannifin Corporation, Mentor, Ohio Prepared under Contract NNC11CA09C National Aeronautics and Space Administration Glenn Research Center Cleveland, Ohio 44135 Level of Review: This material has been technically reviewed by NASA technical management. Available from NASA STI ProgramNational Technical Information ServiceMail Stop 1485285 Port Royal RoadNASA Langley Research CenterSpringfield, VA 22161 Hampton,VA 23681-2199 7 03-605-6000 The work reported herein was supported by grant number NNC11CA09C fromNASAunder NASA’s Environmentally ResponsibleAviation (ERA) Project. The project team would like to thank Dr. Clarence T. Chang, the NASA Technical Point of Contact, andDr. Chi-Ming Lee, Chief of the NASA Glenn Combustion Branch, for their guidance and support throughout the project. We alsowant to thank Mr. Derek P. Podboy and the NASA combustion team for their support during testing. Development of Advanced Low Emission Injectorsand High-Bandwidth Fuel Flow Modulation Valves Adel Mansour Parker Hannifin Corporation Mentor, Ohio 44060 Executive Summary In November of 2011, Parker entered into a contract with NASA to conduct research in support ofthe Environmentally Responsible Aviation Project (ERA). During the project, Parker built and testedmultipoint Lean Direct Injection (LDI) fuel injectors designed to meet NASA’s N+2 objective to reduceNOx emissions of aviation gas turbine engines by 75% from the ICAO standard adopted at CAEP/6. Theinjectors are based on Parker’s three-zone injector (3ZI) concept which has its origin in multi-point LDIinjectors developed by Parker under NASA’s Ultra Efficient Engine Technology (UEET) program thatdelivered record-low emissions in flame tube tests and sector tests. The current injectors improve on thetechnology in terms of thermal performance, aerodynamic design flexibility, and integration withconventional combustors. They are highly practical, manufacturable, and scalable to various engine sizes.The innovative concept and construction offers a pathway to even higher pressure ratios than the targetN+2 design. The injectors that were built and tested during this project were sized for a 60,000 lbf thrust, 55:1Overall Pressure-Ratio (OPR) engine. They contain fifteen injection points and incorporate staging toenable operation at low power conditions. Alternative designs were studied in a combustion testingcampaign focused on ignition and stability performance; ignition was demonstrated at air pressure drop aslow as 0.3% of ambient and fuel-to-air ratio (FAR) as low as 0.011, and Lean Blow Out (LBO) occurredat FAR as low as 0.005. A high pressure combustion testing campaign was conducted in the CE-5 testfacility at NASA Glenn Research Center at pressures up to 250 psi and combustor exit temperatures up to3,200 °F (2,033 K). The tests demonstrated estimated LTO cycle emissions that are about 31% of CAEP/6for a reference 60,000 lbf thrust, 55-OPR engine. These NOx emissions are based on extrapolationbeyond the tested conditions, thus additional testing at higher temperature and pressure is recommended.An updated injector was built and delivered to NASA and now awaits a new round of testing in the CE-5test facility. That injector incorporates changes that are expected to lead to further reductions of LTOcycle emissions below 31% of CAEP/6. During this project Parker also built and tested a high-bandwidth piezoelectric valve to enableelectronically controlled fuel trim function as well as high-bandwidth modulation of fuel flow. The fueltrim function enables detailed control of staging and pattern factors in future engines, contributing toefficient fuel burn and extended engine life. Applying high-bandwidth modulation to the primary fuelcircuit promises to extend the lean stability limit and control combustion dynamics. The ability to controland modulate fuel flow at 1,000 Hz with over 10% modulation authority was demonstrated in a labsetting. Parker successfully met injector and combustion hardware deliverables over the two years and fourmonths of the program, and all piezo valve hardware was built and delivered according to the needs of thetesting program. In particular, all hardware necessary for the key first round of high-pressure combustiontests in the NASA Glenn Research Center CE-5 test facility was delivered on time under an acceleratedschedule. The Parker 3ZI has proven to be a promising technology, not only because of the demonstratedemissions performance and the maturity of the injector relative to thermal and mechanical design, but alsobecause of the inherent flexibility and scalability of the concept. Clear opportunities still exist to furtherimprove the injector emissions performance at both low and high thrust settings. Emissions performancecan be improved through optimization of the atomizer flow numbers and optimizing the atomizerinsertion depth in each spray cup, swirl number of the spray cups, sizing of the individual spray cups, anda staging scheme. Thus, Parker is confident that the NASA ERA emissions goal can be exceeded usingthe 3ZI technology. Table of Contents 1 Introduction....... .4 1.1 Objective........ .5 1.2 Approach...... .6 1.3 Project Plan and Schedule....... 7 1.4 .Summary of Accomplishments........ .8 2 Three-Zone Injector (3ZI) Development ...... .10 2.1 Design Approach........ .11 2.2 Three-Zone Injector Design and Manufacture..... 15 3 .Atmospheric Combustion Rig ....... .17 4 Aerodynamic and Spray Performance of the 3Zl......... .18 4.1 Effective Area Measurements..... 18 4.2 LDV Investigation...... .19 5 Atmospheric Combustion Tests...... .22 5.1 Test Setup & Instrumentation ....... .22 5.2 Ignition & LBO test procedure ...... .23 5.3 Single-cup Pilot Ignition/LBO Envelope .... .25 6 High Pressure Combustion Tests ........ .26 7 Valve Development....... 33 7.1 Valve Design........ .33 7.2 Valve Manufacturing........ .37 7.3 Valve Performance....... .38 8 Conclusions........ .44 Acknowledgments... 45 References ...... .46 1Introduction Parker Hannifin designs and produces fuel injection systems for the world’s most advancedpropulsion systems and, for more than 20 years, has been at the forefront of developments in emissions-abatement technologies for gas turbine engines. Working with various OEM customers to develop bothlean premix (LP) and lean direct injection (LDI) combustion technologies, Parker has developed fuelinjectors for the world-leading gas turbine engine platforms. This includes the General Electric GEnxengine and the Rolls-Royce Trent 1000 that power the Boeing 787 aircraft, as well as the LEAPx andGE9x engines currently under development. While we are intimately familiar with the challenges involved with making fuel injectors andcombustion systems that can survive the rigor of a practical implementation, we are also heavily involvedin developing innovative injector concepts and manufacturing technologies that push the envelope onwhat is achievable in injector technologies. To this end, we have worked with government labs andfacilities to develop and demonstrate advanced fuel injectors and combustor technologies under programssuch as NASA AST and UEET [1,2], DOE Future Gen and the DOD Active Combustion ControlSystems program. In these programs we tested new technologies, such as Macrolamination technology,that ultimately found their way into new engine programs. Macrolamination is a manufacturing techniquethat allows complex internal flow channels to be formed by fabricating the fuel injectors in layers. Theselayers are subsequently bonded to form a monolithic structure with material properties approaching theparent metal properties. Using this technology (US Patents 5,435,884, 6,672,066, 6,711,898,7,083122,7,021,562 and others), multi-point fuel injection can be achieved without the associated hardwarecomplexities and weight penalties of conventional designs. Macrolamination enabled the TAPS injectorof the GEnx engine and has found its way into other injectors as well as numerous other products.Macrolamination technology was also used in Parker’s work under NASA Ultra Efficient EngineTechnology (UEET), where breakthrough reductions in NOx levels were demonstrated using multi-pointlean-direct injection concepts. In the UEET Program we achieved NOx emissions 83% below the 1996ICAO standard [1, 2], which is equivalent to 75% NOx reduction from CAEP/6, or equal to the NASAN+2 goal. The effort reported herein was conducted under contract with NASA, following the acceptance of aproposal submitted by Parker Hannifin in response to NASA’s solicitation for the “EnvironmentallyResponsible Aviation Project (ERA)”- solicitation number NNC10ZRT025N. In this ERA project webuilt on our success in the UEET and subsequent projects, developing and testing a new generation of multi-cup LDI injectors designed to achieve both the ultra-low emissions of the best UEET injector andthe practicality of a production-worthy injector concept. The new injectors are based on an innovativeconcept, called the three-zone-injector (3ZI) which will be introduced in subsequent sections. The injectordevelopment was complemented by the development of a high-speed piezoelectric valve that can be usedfor both the fuel trim function and high-speed modulation of the fuel flow to the fuel injector, therebyoffering an opportunity to control combustion dynamics. This final report is organized as follows. First, the following introductory subsections provide a briefdescription of the objective and approach to the ERA project, along with the project plan and a summaryof technical accomplishments. Section 2 discusses the development of the three-zone-injector (3ZI)concept, including a detailed overview of the spray cup design and the manufacturing and testing of four3ZI variants that were produced during the project. Section 3 provides a brief description of the rigdesigned and built for atmospheric testing. Section 4 reports on the characterization of the aerodynamicperformance of the 3ZI variants, including effective area measurements and results from laser Dopplervelocimetry (LDV) mapping. Section 5 presents results from atmospheric ignition and lean blow out(LBO) testing conducted of three 3ZI variants at the University of Cincinnati. Section 6 reports on thehigh pressure flame tube combustion experiments conducted at the NASA CE-5 facility. Section 7summarizes the piezo valve development effort. Finally, conclusions based on the completed work arediscussed in Section 8. 1.1 Objective The overall objective of this research was to develop the next generation of fuel injector technologiesthat achieve reduced emissions of harmful pollutants and are applicable to future generations of highpressure ratio jet engines. The research had three specific objectives: Develop and test novel multipoint lean direct injection schemes for control of mixturehomogeneity to achieve the N+2 NOx performance goals of the NASA EnvironmentallyResponsible Aviation Project. ●Develop a piezo-electric valve that modulates fuel flow in real time with both proportional andhigh-speed modulation capabilities. This valve will add significant flexibility to the control ofinjector fuel flow and combustor performance. 1Integrate the high bandwidth, fast response piezoelectric valve with the pilot circuit of one ofour selected injector concepts and demonstrate its capability in controlling combustiondynamics. The first two objectives were both successfully met within the program time frame and only the testsrequired to complete the demonstration for the third objective remain. These tests were delayed past theend of the research contract, primarily due to scheduling priorities at the NASA tests facilities where thetests were to be conducted. 1.2 Approach The multipoint lean direct injection scheme developed during this project is based on Parker’sthree-zone injector (3ZI) concept. The 3ZI concept has its origin in multi-point LDI injectors developedby Parker under NASA’s UEET program. It utilizes the same multipoint spray-cup concept but improvesupon the technology by insulating the fuel circuits from the air circuits for greatly improved thermalperformance. Furthermore, new spray cup designs were implemented that offer improved aerodynamicsand greater design flexibility. Finally, the injector can be inserted into an engine in a conventional mannerthrough an opening in the combustor casing, which is critical for practical injectors, even for highlyadvanced engines. Figure 1 illustrates the 3ZI concept. Figure 1(a) shows a single injector, while Figure 1(b) illustratesthree injectors installed in a combustor sector. Each injector has three main burning zones, with oneforward primary combustion zone and two secondary zones on either side of the primary zone. Theforward zone can be used for low load operation while the secondary zones are operated during high load.Each burning zone has a number of spray cups (seven cups per zone in Figure 1), each consisting of an airswirler and a pressure-swirl atomizer located at the base of each cup. Air that flows through each of theswirlers generates a swirling flow field with a small recirculation zone for burning. The small multi-burning zones provide for reduced burning residence time, resulting in low NOx formation as wasdemonstrated in the UEET program. Figure 1: The original 3ZI concept: (a) single injector, and (b) three injectors installed in acombustor sector The valve concept used in this project for fuel flow modulation and control is based on technologydeveloped by Parker for high-bandwidth electronic flow modulation. The valve technology comprises apressure-balanced metering spool driven by a proportional piezo actuator that is proprietary to Parker.The actuator is currently in production for industrial valve applications, and can operate at much higherfrequencies than conventional electromechanical actuators of comparable force and stroke. Figure 2shows a model of a representative prototype valve as implemented by Parker Gas Turbine. The valve maybe designed with an internal bypass channel that sets the nominal (unactuated) flow area, as well as thecapacity to modulate a second flow area when actuated. The ERA valve design had a target operatingfrequency of 1,000 Hz. To accomplish this, the actuator was redesigned to increase its resonantfrequency. Figure 2: Piezo valve prototype 1.3 Project Plan and Schedule This development project was executed over a period of two years and four months. The project planwas designed to advance the Technology Readiness Level (TRL) of the injector and valve to TRL 4through high pressure combustion tests. The first year of the program, which began in November 2011,focused on the development of two injector concepts as well as the fuel modulation valve. It includedspray performance characterization and atmospheric ignition and lean blowout combustion tests. Thesecond year saw a down-selection to one injector concept that was tested in NASA Glenn ResearchCenter’s CE-5 combustion facility at pressures up to 250 psi as well as fabrication of piezo valves capableof handling the desired fuel trim function and flow modulation at up to 1,000 Hz.The plan was to initiateadditional combustion tests at NASA using modulated fuel spray in the pilot cup. NASA will conductthese tests in 2014. The main tasks for Year I were to: (a) develop and manufacture two variants of Parker’sMacrolaminate multi-point fuel injectors that seek to improve the static stability of the injectors whileoperating on Jet-A, (b) develop a piezo valve that modulates fuel flow in real time with both proportionaland high-speed modulation capabilities, and (c) conduct a detailed experimental program at our universitypartner facility to map the stability boundaries of the injectors and perform phenomenological studies ofignition and lean blowout in an atmospheric combustion facility. The key objectives for the Year II effort were to demonstrate: (i) low-NOx performance of the 3ZI atengine-like combustion pressures (up to 250 psi), and (ii) viability of the piezo valve to affect 3ZIdynamics. The Year-II plan was executed under an accelerated delivery schedule for both the injector andthe piezo valve, relative to the original plan, in order to ensure their availability during open CE-5 testwindows. The accelerated schedule was met for all combustion hardware. However, the modulatedcombustion tests planned for CE-5 were delayed into calendar year 2014 due to scheduling priorities atNASA Glenn Research center, government furloughs, cold weather, and facility maintenance. 1.4Summary of Accomplishments Overall, the program was executed on schedule and all fuel injectors and combustion-rig hardwarewas delivered to NASA on schedule. The first round of combustion tests in the CE-5 combustion rig werethen completed in the first quarter of CY2013 with the 3ZI demonstrating excellent performance both interms of emissions and durability. Atmospheric, non-modulated combustion tests for an identical injectorwere then completed in the third quarter of CY2013. In the second quarter of CY2013, Parker built and delivered a fourth variant of the 3ZI thatincorporates design changes intended to further improve emissions performance. This new injector iscurrently at NASA GRC and awaits installation into the CE-5 Rig for use in modulated combustion teststhat are currently expected to be conducted in late spring of CY2014 after the close of the currentcontract. All valve hardware fabrication was completed in time for all combustions tests. The following summarizes the main accomplishments of this program: Parker designed and fabricated four 3ZI variants (E01, E02, E03, and E04). Design enhancementswere incorporated into each successive design to improve injector performance and advance theTRL, based on experience acquired from the atmospheric testing. High maturity level was demonstrated, with thermal structural analysis of the test hardwareindicating an LCF life over 4,000 thermal cycles, which is well beyond the need of rig hardware. Atmospheric combustion tests were conducted at the University of Cincinnati, demonstratingignition and flame stability at fuel injection pressure as low as 2 psig, air pressure drop as low as0.3% of ambient pressure, and fuel-air ratio (FAR) as low as 0.029 and 0.009 at ambient andpreheated conditions, respectively. High pressure combustion tests were conducted in the NASA Glenn Research Center’s CE-5 testrig and successfully completed on 3/21/13, with the E03 injector operating for over 40 hours atpressures up to 250 psi and combustor exit temperatures up to 3200 F (2033 K). The E03 injector emerged from the combustion tests without damage or signs of thermal distressor flame ingress. The combustion tests demonstrated the durability of the injector, which resultsfrom the maturity of the 3ZI with respect to thermal and mechanical design. Extrapolation based on the combustion test data set yielded estimated LTO cycle emissions thatare about 31% of CAEP/6 for a reference 60,000 lbf thrust, 55-OPR engine. Additionalreductions of LTO cycle emissions below 31% of CAEP/6 are anticipated through furtheroptimization of atomizer performance. The fourth injector variant was delivered to NASA on 10-June-2013 for combustion testing in theCE-5 combustion rig. The injector incorporates lower flow number atomizers (for finer spray)than the third injector, which is expected to improve both operability and emissions. Piezo actuators for the valves were characterized and 1,000 Hz operation was demonstrated (±0.003”displacement). A prototype piezo valve (E01 variant) was then demonstrated to meet theperformance requirement of at least 10% modulation authority up to 1,000 Hz. Parker completed final assembly and validation testing oftwo piezo valves. Valve performancewas confirmed to meet target specs for modulation authority (at least 10%) and bandwidth(1,000 Hz). Valve performance was found to be consistent with predicted results. Parker delivered a piezo valve to NASA for use in combustion tests that NASA plans to conductafter the official end of this research program. The tests will use the fourth variant of the 3ZI. 2Three-Zone Injector (3ZI) Development The multipoint injector developed for the NASA ERA program has its origin in multipoint LDI fuelinjectors developed as a part of NASA’s Ultra Efficient Engine Technology (UEET) program. The UEETprogram employed the multipoint Macrolaminate injector concept shown in Figure 3a and achievedbreakthrough reductions in NOx emissions, 83% below the 1996 ICAO standard, which is equivalent to a75% NOx reduction from CAEP/6 and equal to the NASA N+2 goal [1,2]. Each injection point in themonolithic Macrolaminate injector was formed with a spray cup comprising a pressure swirl atomizer andintegrated radial air swirler. Air flowing through the swirler generates a down-stream flow field with asmall recirculation zone for burning. The small burning zone provides for reduced burning residence time,contributing to low NOx formation. The overall injector structure and spray cup design was improvedthrough the ERA program, resulting in the 15-cup injector shown in Figure 3b. The main designobjectives for the 3ZI fuel injector were to maximize the effective area of the individual spray cups whilestill attaining adequate aerodynamics performance and NOx emissions and to improve the thermalperformance of the injector with consideration of the N+2 engine specification and subject to envelopeconstraints derived from current combustor design. Figure 3: (a) UEET 25-cup I-Dome and (b) ERA 15-cup 3Zl Four variants of the 3ZI were built and tested during this program, all based on the staged, 15-cupinjector design shown in Figure 3b. The first two injectors, designated“E01”and“E02”, were built foratmospheric combustion tests conducted at the University of Cincinnati. Concurrent with these tests the“E03”variant was designed and built for testing at high pressure conditions in the CE-5 test cell at NASAGlenn. Following the first set of high-pressure tests, the “E04”injector was designed for a second CE-5test campaign. The following sections discuss the development of the 15-cup 3ZI spray cup and injectordesign and the differences between the four variants as incremental changes were made throughout theprogram. 2.1Design Approach The 3ZI was sized based on engine operating conditions provided by NASA for a target 60,000 lbfthrust N+2 aircraft engine. For this engine, 100% power operating point corresponds to P3 above 800 psiaand T3 above 950 K and AFR of 34. From the outset, Parker decided to pursue a design that could lead toa practical injector for this engine size and operating conditions. This demanded that special attention begiven to the thermal aspect of the injector design. The cruise condition, with high combustor inlet airtemperature and relatively low fuel flow, demands careful attention to the thermal aspects of the fuelinjector design in order to ensure acceptable wetted wall temperatures (WWT). To address the thermal aspect of the design, the fully integrated and monolithic ML structure usedfor the UEET design has been replaced with a structure composed of two main parts, namely a heat-shielded fuel distribution support and a spray-cup assembly. The spray cup assembly resembles the highlysuccessful UEET design but is given a new shape. It comprises 15 separate spray cups (air swirlers)arranged to form three main combustion zones, namely, one forward primary zone and two secondaryzones on either side of the primary zone. Fuel is routed inside the heat-shielded fuel distribution supportto multiple fuel atomizing tips that mate with spray cups with minimum thermal contact between the fuel-carrying components and hot external spray-cupcomponents. The back side of the spray cup is open to airflow, allowing flexibility for the spray cup design and placement. In addition to addressing the thermal aspect of the injector design upfront, certain envelopeconstraints were assumed, based on practical engine constraints. The 3ZI envelope that was assumed wasbased on current engine technology while making allowance for the increased air-effective area of thecombustor front end as required for lean burn technology. Thus, constraints were placed on the injectorfront-panel length and the maximum width was limited such that the injector could be inserted through ahole in the engine casing. The number, size, and air-circuit design of the individual spray cups were thenoptimized to minimize injector length, width and weight subject to constraints imposed by the requiredeffective areas of swirlers, the aerodynamics necessary for stable combustion, and manufacturabilityconsiderations. The 3ZI configuration maintains the flexibility of the multipoint Macrolaminate construction withrespect to fuel staging, but is not limited to a coplanar arrangement of spray cups. The 15 spray cups ofthe 3ZI are arranged in three groups of five spray cups, with each group separated by an angulardisplacement. As a result the injector can be inserted in a conventional manner through an opening in thecombustor casing. This arrangement also allows the burning zones to be isolated from adjacent zones for more stable staged operation. For example, the forward zone may be used for low load operation, and thesecondary zones added for high load operation. The basic elements of the spray cup as employed in the 3ZI are distinct from the spray cup designused in the UEET program [1,2] in that the 3ZI cup features a detached, centrally-located pressure swirlatomizer, provides axial swirling flow through the base of the cup, and uses a diverging radial swirler.The detached atomizer in the 3ZI spray cup allows for variable placement of the exit orifice with respectto the spray cup air swirling features. The depth of insertion is a parameter of particular interest as itrelates to the interaction of fuel and air as well as the practical spray angle for the atomizer that may beemployed. The 3ZI spray cups must pass 80% to 90% of the combustion air into the combustor to achieve thetargeted ultra-low emissions. The cup size required to pass this quantity of air depends on the number ofcups, the available pressure drop, and the geometry-induced characteristics of the flow in the cup,especially the strength of the swirl induced by the cup. The design can be tailored to achieve a wide rangeof swirl numbers and discharge coefficients. High discharge coefficients can be achieved with non-swirling axial flow entering through the bottom of the cup combined with low-swirling flow through theradial swirler. A stabilizing flow recirculation can be achieved by introducing strong swirling axial flowentering through the bottom of the cup or by blocking the axial inlet altogether while at the same timeemploying a higher-turning radial swirler. Thus, an optimal spray cup design balances the need for astable reaction region and the desire for a high discharge coefficient. To that end,a CFD study wasexecuted to study the effect of the various spray cup design parameters. 2.1.1 CFD analysis of the 3ZI spray cup The CFD effort focused on modeling the individual spray cup to study the aerodynamics within thespray cup for varying swirler and atomizer geometry. The primary goal was to maximize dischargecoefficient while still producing vortex breakdown at the cup exit for flame stabilization. After selecting aspray cup design, the 15-cup injector design was developed based on the envelope constraints describedabove. A three-cup segment of the design was then modeled to study cup-to-cup interaction at relevantN+2 engine conditions. The single-cup CFD study was aimed at selecting appropriate axial and radial swirler parameters aswell as integration of the atomizer tip into the spray cup. Aerodynamic performance and flowcharacteristics were evaluated for 14 different configurations. Typically Large Eddy Simulations (LES)were employed to accurately capture the swirling flow within the cups. During the design evolution, single-cup simulations were conducted, using appropriate boundary conditions to model the effects ofneighboring swirlers. Figure 4 shows sample results for the cup design selected for the 3ZI hardware. The flow solutionsshown are from LES studies where the solution has been time averaged for a time period greater thanthree times the through-flow time for the cup. The simulations were done in Fluent 13.0 assumingincompressible flow at atmospheric conditions under a 4% pressure drop. Figure 4a shows the time-averaged velocity field. The figure shows that the cup design provides a robust, downstream recirculationzone which reaches into the cup. Figure 4b shows instantaneous velocity vectors plotted on top ofcontours of the RMS value of velocity magnitude. The figure shows that highest unsteadiness is observedin the shear layer between the reversed flow and the air flowing through the cup.Compared to otherdesigns, this cup exhibits higher turbulence (higher RMS value) in the reversed flow core. Figure 4: Velocity field in the 3Zl spray cup design; (a) time-averaged velocity vectors plotted ontocontours of time-averaged velocity magnitude, (b) instantaneous velocity vectors plotted ontocontours of RMS values of velocity magnitude Upon selection of a swirler design for the 3ZI rig injector hardware, a three-cup CFD model wasprepared to evaluate cup-to-cup interaction and airflow splits between cups in the center panel and sidepanels. Figure 5 shows the model geometry. The simulations were for both atmospheric condition and anominal 85% power condition, assuming a 4% pressure drop in both cases. The computational meshcontained 39 million cells which were clustered primarily in the cup region. Appropriate boundaryconditions were used to model the effect of neighboring rows of spray cups. A realizable k-e turbulencemodel was used to account for the effects of turbulence on the flow. Figure 5: A three-cup model of 3ZI rig injector-(a) flow volume geometry,(b) contours of velocitymagnitude in center plane Figure 6 shows a close-up view of the velocity field downstream of the cup for the 85% poweroperating point. Figure 6a shows the velocity vectors along with contours of velocity magnitude. Thefigure shows a reversed flow near the cups that closely resembles that predicted by the single-cup LESsimulations for the same cup design. Figure 6b shows the velocity vector along with contours of RMSvelocity computed from the predicted turbulent kinetic energy. Again, when compared to the RMS valuespredicted by the atmospheric LES simulation for the region immediately downstream of the cup, thecurrent values are about 80% higher. However, the current RANS simulations do not predict the highRMS values within the reversed-flow air core inside the cup that were predicted by the LES. Thesimulations show that the air flow is evenly split between the cups, with less than one-half percentdifference between the three cups. The even split suggests that the fuel distribution support and atomizerbodies on the upstream side of the spray cups do not significantly interfere with the airflow into the cups. Figure 6: Velocity field for the 3Zl at 85% operating point (a) velocity magnitude,(b) RMS values ofvelocity computed from predicted turbulent kinetic energy 2.1.2 Thermal & structural analysis of the 3ZI spray cup A finite element analysis (FEA) was undertaken to predict the thermal and structural performance ofthe 3ZI. For simplicity, a single spray-cup and fuel tip assembly was analyzed, including the connection to the fuel distribution support. The analysis yielded predictions of wetted wall temperature (WWT) andmaximum stress to which the tip will be subjected under different operating conditions. At less than fullpower, the analysis predicted wall temperatures will within acceptable range. At full power, the maximumWWT is predicted to be slightly above what is generally considered a threshold where coking can occur.However, due to the limited duration of engine operation at this extreme condition, it is anticipated thatlittle coking of the fuel circuit will occur. Parker has significant experience with injectors operating underthese conditions. The maximum predicted stress under maximum power conditions translates to a predicted life inexcess of 4,000 cycles, which exceeds the needs of this test program. Additional, straight-forwardimprovements can be made to reduce the stress level in the high-stress area and improve life above 4,000cycles. 2.2Three-Zone Injector Design and Manufacture Four variants of the 3ZI were built and tested during the program. The four versions, designated“E01”“E02”,“E03”, and“E04”, all employ the same 15-cup spray-cup array described above. Theinjectors differ in atomizer design, the placement of the atomizer tips within the spray cups, and thelocation and number of pilot cups. The spray cups are arranged with alternating swirl direction as shownin the UEET program to be effective [1-3]. Fuel tubes attached to the rear of the fuel distribution supportsupply fuel to each of the three to four stages of the injector, depending on the version. Note that apractical LDI fuel injector would ideally incorporate at most two independent fuel inlets, althoughadditional staging flexibility may be attained using advanced valves. Here, however, the extra stages wereincorporated to facilitate experimentation with various staging options. The E01 and E02 injectors were designed for ignition and lean-blow-off (LBO) performance testingin atmospheric combustion experiments conducted at the University of Cincinnati. In these injectors, the15 spray cups are divided into four independently fueled stages to allow flexibility when testing forignition and low-power operation. Pilot-1 is a single cup located in the center panel of the injector, secondrow from the top. Pilot-2 fuels the remaining two cups in the second row. The Main-1 fuel circuitcomprises the four cups remaining in the center panel not fueled by Pilot-1. Finally, Main-2 fuels theeight cups in the two side panels not fueled by Pilot-2. The pilot circuits are intended for use duringignition and for piloting of the flame. Main-1 along with the pilot circuits is intended for low poweroperation while Main-2 is intended for use during high power and cruise operation in combination withthe remaining fuel circuits. The E01 and E02 injectors differ primarily in the location of the atomizer tips within the spray cupswith respect to the cup exit (insertion depth). Based on results from atmospheric combustion tests (seeSection 4) the insertion depth of the E02 injector was chosen for the E03 injector. A number of designenhancements were incorporated into the E03 injector to improve performance and accommodate flametube testing in the CE-5 rig at NASA Glenn Research Center. The atomizer tips were modified slightly,and the pilot was moved to the first row. Also, the heat shielding was installed to the support subassemblyto accommodate high temperature air flow in the combustion rig. Figure 7 shows a representative photograph of an assembled 3ZI injector along with images of thesprays from the atomizers within the spray cups. Note that no air is flowing. In flow tests, the atomizertips proved very consistent and the sprays were observed to be uniform, with no streaks or voids. (a) (b) (c) Figure 7: Complete 3ZI (a) injector, (b) pilot spray at 100 psi, (c) pilot and main spray at 100 psi The results of flame-tube experiments using the E03 injector led to further refinements of the 3ZIdesign that were incorporated into the E04 variant that aimed at improved emissions and turn-downperformance. While retaining the E03 fuel staging scheme, the E04 variant features reduced flow numberatomizer and modified front heat shield. The reduction in atomizer flow number will result in improvedatomization, especially at low flows, which in turn is expected to improve emissions and enhanceoperability at low and intermediate power. 3Atmospheric Combustion Rig The atmospheric tests conducted at the University of Cincinnati included both ignition and mixingstudies which required two different rig configurations. The two configurations differ in exit geometry asshown in Figure 8. The ignition study configuration is shown in the middle of the figure and comprises anair box, a central flange, and a liner assembly with instrumentation and optical access. In the image on theright, the liner assembly has been replaced by an alternate outlet plate to provide unrestricted access to theregion downstream of the injector for mixing measurements. In both configurations the injector ismounted to the upstream side of the central flange and enclosed within the air box which provides aconditioned air flow to the inlet side. The injector fuel tubes pass through the inlet flange of the air boxand are captured by compression fittings. The image on the left shows the inlet flange as viewed fromupstream. In this view the two air inlets are visible. Figure 8: Atmospheric combustion rig -liner assembly and open exit configurations The liner assembly comprises an upper and lower liner wall and two quartz side walls. Botheffusion-cooled and solid liner walls were tested. The three orange components represent three possibleigniter positions available during ignition studies. During testing the temperature and pressure (dynamicand static) were monitored both upstream and downstream of the injector, with additional temperatureprobes within the cooling air passages adjacent to the upper and lower liner walls. A photograph of thecombustion rig with the 3ZI installed is shown laying on its right side in Figure 9. Figure 9:Atmospheric combustion rig with liner assembly 4Aerodynamic and Spray Performance of the 3ZI Several tests were conducted to characterize the aerodynamic and spray performance of the 3ZI.These tests were conducted at the University of Cincinnati (UC) School of Aerospace SystemsCombustion Research Laboratory, which is located in the University’s Center Hill Facility. The testsincluded effective area measurements and Laser Doppler Velocimetry (LDV) characterization of the flowfield downstream of the injector, both of which are presented below. 4.1 Effective Area Measurements The E02 injector was installed in the atmospheric rig to measure the effective area of the spray cupsand liner cooling holes for pressure drops ranging from 5 cm H2O (0.5%) to 60 cm H20 (6%). The spraycup geometry was common to all injector variants, thus the effective area measurements were applicableto all injectors built during the project. The effective area curve-fits shown in Figure 10 were used in allcalculations of air mass flow. Note that the effective area changes by only 3.7% as the pressure drop isincreased from 10 cm H20 to 50 cm Hz0 (or 1%to 5%). The effective area of the effusion-cooled linerwas about 20% of the injector effective area. Figure 10: Measured effective area as a function of air pressure drop for(a) 3Zl and (b) 3Zl and effusion-cooled liner 4.2 LDV Investigation 4.2.1 LDV test setup and scope of measurements For the LDV study, the injector was installed in the air box described in Section 3 and shown inFigure 8 while the downstream air flow was confined by a Plexiglas air-box. The LDV measurementswere conducted using an Artium PDI-200 system.The coordinate frame of reference was chosen with theorigin on the center axis of swirler 3 with X-axis directed towards swirler 13,Y-axis directed towardsswirler 2 and Z-axis directed in the streamwise flow direction. LDV measurements were carried out in thecenter plane (YZ plane at X=0) and several cross-section planes (XY planes). The injector geometryrestricted optical access in some parts of these planes. Figure 11: Injector Schematic and coordinate frame To facilitate the discussion of the results, the spray cups are numbered as shown in Figure 11.Specifically, the cups in the center column are numbered 1-5 while the cups in the left and right columnsare numbered 6-10 and 11-15, respectively. Note that the swirl direction of each spray cup is opposite tothose of its neighbors along its row and column. 4.2.2 Results of LDV testing The YZ plane at X=0 mm is the vertical center plane of the injector and of the center-panel airswirlers, 1-5. Figure 12 and Figure 13 show contours of the axial (Vz) velocity and the horizontal (Vx)components of velocity in this plane and include lines indicating the locations of zero velocity.The Vzcontour (Figure 12) shows the center recirculation zones (CRZ) for swirlers 1-5. The CRZs have lengthsbetween 2.3 to 3.0 times the swirler diameters. Since neighboring swirlers are counter-rotating, the Vxcomponents of the merging swirling jets have the same sign (Figure 13), avoiding large shear stressesbetween the jets. Regions of high Vz (Figure 12) near the top and bottom are assumed to be due toleakage in the clearance between the base plate and the injector. These can impact ignition and lean blow-out ofthe flames at swirlers 1 and 5. Figure 12: Center plane axial velocity Figure 13: Center plane horizontal velocity The XY plane at 0.7 cup diameters (0.7D) from the injector face was the cross-sectional planeclosest to the exit plane of the center swirlers with full optical access. Figure 14 shows the contours of Vzin in that plane overlaid with vectors representing the in-plane velocities (Vx and Vy). The CRZs forswirlers 1-5 are surrounded by the swirling jets, seen in Figure 12, whose shapes are impacted byinteraction with neighboring swirlers. The clockwise rotations of swirlers 1 and 3 and counter-clockwiserotation of swirler 2 induce negative Vx velocity between swirlers 1 and 2 and positive Vx velocitiesbetween swirlers 2 and 3, causing the shape of the swirling jet around cup 2 to become slightly oblongand stretch towards its top left and its bottom right corner. Negative axial velocities representing cornerrecirculation are observed near the chamber walls on all sides. Figure 14: Axial velocity with in-plane velocity vectors in a plane 0.7D from the injector front panel The LDV measurements show secondary flows in the region between the vertical swirler columns.These are clearly seen in Figure 14 in two regions; region A bordered by swirlers 1, 2, 6 and 7, and regionB below it, bordered by swirlers 2, 3, 7 and 8. In region A, the interaction between swirler 1 and 2 on theright of A, and between swirlers 6 and 7 on the left of A induces mass flow into region A with high Vxvelocities on both the left and right. Weaker interaction between swirler pairs 1 and 6 above region A andbetween swirlers 2 and 7 below region A induces mass flow out of region A, but with Vy velocities thatare substantially lower in magnitude than the Vx velocities entering region A. With the injector wallbehind the measuring plane, the net flow into region A in the measuring plane causes the air mass tomove downstream, away from the injector face, with positive Vz. The opposite mass movements in andout of region B bordered by swirlers 2, 3, 7 and 8, results in low pressure which induces mass to movetowards the injector face from the downstream side, i.e. with negative Vz. Figure 15 shows the contours of Vz in plane 1.7 cup diameters (1.7D) from the center panel. As inFigure 14, the contours are overlaid with vectors representing the in-plane velocity components.Compared to the plane at 0.7D in Figure 14, there has been an overall redistribution of axial momentum atthis location resulting in lower magnitudes of both positive and negative Vz in the plane. The regions ofrecirculation, like region B in the upstream plane shown in, seem to have merged with CRZs of theadjacent side swirlers to form large areas of slightly negative Vz. Figure 15: Axial velocity with in-plane velocity vectors at Z = 1.7D Overall, the LDV study of the aerodynamics of the Parker 3ZI reveals several important flowcharacteristics produced by the injector, such as the length of the central recirculation zones at the center-panel swirler, the impact of leakage flows, and the secondary flows produced by swirler-to-swirlerinteractions. )A1tmospheric Combustion Tests Atmospheric ignition and lean blow-out analysis on injector variations E01, E02 and E03 wasperformed at the University of Cincinnati (UC) Center Hill Facility. A wide range of air and fuel flowrates were explored to map the low power ignition and LBO conditions for the Pilot,Main 1, and Main 2fuel circuits. The tests were performed with the injectors firing in a horizontal direction using theatmospheric test rig design described in Section 3. The E01 injector was tested with both an effusioncooled liner and the solid liner (see Section3). For the E02 and E03 injectors only the effusion cooledliner was used. Ignition testing was conducted for several different staging approaches. Specifically,ignition of Pilot 1 alone was tested as well as ignition of Main 1 from Pilot 1 and ignition of Main 1 andPilot 1 together (i.e., the entire front panel of the 3ZI). Ignition of Main 2 from Pilot 1 and Main 1 wastested as well. A wide range of air and fuel flow rates were explored to map the low power ignition andLBO conditions for various fuel staging schemes. 5.1 Test Setup & Instrumentation The atmospheric test rig with 3ZI installed was connected to UC’s Horizontal Test Rig. ThisHorizontal Test Rig is equipped with a 72 kW inline air heater for preheating the combustion air. The airwas supplied by an Atlas Copco GA90FF rotary screw compressor which is rated for a flow rate of600 CFM at pressures up to 110 psig. The air system consists of a settling tank, pressure regulator, and anetwork of pipes and hoses leading to the Horizontal Test Rig. The combustion air flow rate wascontrolled by a manual gate valve located at the inlet of the Test Rig. Air pressure in the manifold wasmeasured by a Meriam 2110 Smart Gage series differential pressure transducer. The air temperature in themanifold was monitored by a type K thermocouple. Fuel flow to all three circuits was provided by a single fuel pump. The fuel line from the pump wasdivided into three lines, with a shut-off and a manual metering valve on each line for controlling flowrates. Flow rates on the three circuits were monitored by Micro Motion Coriolis Flow Meters, modelCMF 010. The schematic for the test setup with plumbing and instrumentation is shown in Figure 16. The ignition rig had three preconfigured igniter locations as described in Section 3 and shown inFigure 16. The igniter, which was supplied by Parker, was installed at location 2 for most tests. Allinstances of ignition and blow-out were visually observed and manually recorded. Figure 16: Plumbing Schematic for the atmospheric combustion rig For ease of reporting results, the individual injector cups of the center column, which contains thePilot 1 and Main 1 circuits, are numbered 1-5 from top to bottom, as shown in Figure 11. Recall that theE01 and E02 injectors contain two pilot circuits, and the single-cup pilot stage designated Pilot 1 is atlocation 2. The E03 injector contains one single pilot cup at location 1. 5.2 Ignition & LBO test procedure The procedure for each test was as follows: 1.PJreheat air to desired temperature. For ambient air, start with step 2 2. Set air differential pressure (dP) 3.D.Set fuel flow rate 4. Spark 3 times to attempt stable ignition. If successful, move to step 6 5. Ifignition is unsuccessful, increase fuel flow rate and repeat step 4 6. Once at least one injector cup has ignited, increase fuel flow rate until target cups have ignited 7. When stable ignition is achieved for all injector cups under consideration, slowly decrease fuelflow until all cups blow out, noting locations for each blowout Initial tests were conducted with ambient temperature air, followed by tests with preheated air. Foreach case, the starting fuel flow rate was set to a very low flow rate. In case of unsuccessful ignition, theflow rate was increased by a small amount, until ignition was achieved. A typical increase in fuel flowrate was1 pph/cup. A sample ignition event on Pilot 1 is shown in Figure 17. Figure 17: Example of Pilot 1 ignition for Injector E01 With a flame on one or more circuits, LBO tests were conducted by gradually reducing the fuel flowto one circuit at a time, recording the fuel flow at which the flame on any cup was observed to extinguish.Once all cups of the circuit being adjusted had blown out, the fuel flow to that circuit was shut-off. In allcases, flow to Main 2 was adjusted first (if it was lit in the preceding ignition test), followed by Pilot 2,Main 1 and, finally, Pilot 1, in that order. Figure 18 shows an example of the visible flame for an ignitionof Pilot 1 and Main 1 flowing together and the subsequent flame outs, first on Main 1 and then on Pilot 1,as fuel flow is reduced. Injectors 3 & 4 blow out Figure 18: Example of ignition and LBO sequence for the E01 injector when Pilot-1 and Main-1 areboth fueled 5.3Single-cup Pilot Ignition/LBO Envelope The ignition and LBO performance for the three injectors is compared in Figure 19. The figureshows the fuel-air ratio (FAR) at ignition and lean blow-out of Pilot 1for each injector operating withpreheated air and uncooled liner. Clearly, Injector E03 offers the best performance in these tests withignition occurring at less than of the fuel flow required for Injector E01 and E02. Injector E02 stilloffers advantages over injector E01. Injector E03 also has improved LBO limit at the very low airpressure drops. At 2% pressure drop, the E01 and E03 perform similarly. Based on the LBO performanceof E01 and E02 at 0.5% and 1% pressure drop, one can conclude that all three injectors will have thesame LBO performance at 2% pressure drop. Figure 19: FAR at ignition and LBO of E01, E02 and E03 operating on Pilot 1 with preheated air 6High Pressure Combustion Tests In January of 2013, Parker delivered the third generation (E03) of the 3ZI (P/N 6110077DHE03) toNASA Glenn for combustion testing in NASA intermediate pressure combustion rig (CE-5). Combustiontests were then performed from 2/19 to 2/21 and from 3/19 through 3/21. As described in Section 2.2, theinjector has three fuel circuits, namely, a pilot circuit that feeds a single spray cup at one end of the centerpanel, a main flow circuit (Main-1) that fuels the remaining four spray cups in the center panel, and asecond main flow circuit (Main-2) that feeds all ten spray cups on the two side panels. After the injector was instrumented with thermocouples by NASA, the injector was installed in theCE-5 test rig for combustion testing. The tests were conducted at four different operating pressures,nominally 100 psia, 150 psia, 200 psia and 250 psia, and three different operating temperatures,nominally 567 °F (570K), 864 °F (736K) and 1034 °F (830K). The tests covered a range ofequivalence ratios from 0.163 to 0.677 (fuel-air ratios from 0.011 to 0.046). Note that in the actual tests,the pressures and temperatures deviated slightly from the nominal values. After over 40 hours of testing,the injector was removed from the rig in excellent condition, demonstrating the high technology readinesslevel of the mechanical and thermal aspects of the injector design. The individual spray cups and atomizertips are clean without any evidence of flame ingress. The thermal barrier coating on the injector face wasintact with no evidence of spallation during combustion tests. In the tests, NOx emissions data was collected with the injector operating in staged mode on fivecups (Pilot-1 and Main-1) and when operating on all 15 cups. Data was also collected on dynamics in thecombustor. In this report, only emissions results obtained with all spray cups flowing are shown, as theseare of greatest interest for high-power operation and allow comparison to earlier results using Parker’sMacrolaminate injector designs described in [1, 2]. All NOx emissions are reported in terms of NOxEmissions Index scaled using an emission value attained at a high FAR at high pressure. Figure 20 shows the scaled emissions plotted against the global Fuel-Air Ratio (FAR) while Figure21 shows the corresponding combustion efficiency. The fuel-air ratio includes air used for effusioncooling of the injector face, which is estimated to be 6.5% of the total air flow. Note that data in Figure 20and Figure 21 are labeled according to the nominal operating pressure and temperature but the dataplotted are raw, i.e., without corrections to the emissions due to deviation of the actual operating pointfrom the nominal operating conditions. The nominal operating points were selected for the purpose ofgiving as much useful data as possible from these intermediate pressure tests to enable prediction of LTOcycle emissions for a reference 60,000 lbf, 55 Overall Pressure Ratio (OPR) N+2 engine. Figure 20: Scaled NOx emissions as a function of over-all FAR - all data is at nominal 4% airpressure drop except as labeled For P3=100 psi and T3=567 °F, Figure 20 shows that NOx emissions are very low compared to the higher P3 and T3 values, as expected. The combustion efficiency was high (99.95% or higher) for allvalues of FAR displayed for this condition and the recorded CO emissions were less than 1 ppm,indicating a stable flame. However, below a FAR of 0.035 CO emissions started to climb and combustionefficiency dropped and the flame became less stable. One likely reason is that fuel flow rate is very low atthis low pressure and air density is relatively low so atomization becomes increasingly poor as the FARdecreases, resulting in low vaporization rates and poor dispersion. This is supported in part by improvedoperability for the same T3 when the combustor pressure is raised to P3=150 psi. For this higher P3,stable operation and very low NOx emissions were attained at global FAR of 0.0275, where atomizationis improved due to both higher atomization pressure at a given FAR and improved air blast atomizationdue to higher air density. This suggests that using lower flow-number atomizers in future versions of theinjector will likely enable operation at lower FAR than recorded in these tests. Figure 21: Combustion efficiency as a function of global Fuel-Air Ratio (FAR) - all data is atnominal 4% air pressure drop except where labeled To operate this version of the injector at still lower FAR than shown here at the 100-psi operatingpoint, staging of the injector cups would be required such that spray cups that are fueled operate at a FARof 0.035 or higher. For instance, operating on five cups would yield a global FAR just under 0.012. Figure 22 shows the scaled NOx emissions attained for T3=864 °F for the four different operatingpressures tested, with the highest pressure being the upper limit for the combustion rig. The figure revealsa very consistent emissions trend as a function of FAR for the higher operating pressures while somescatter in the data is present at the lower pressures. In particular, the data shows stable operation at lowerFAR as the pressure increases from 100 psi to 250 psi. Specifically, for P3 of 200 psia and 250 psi, stableflames were obtained at substantially lower FAR than at 100 psia and 150 psia. This points to improvedatomization1and, possibly, improved dispersion of the spray at the higher pressures. Furtherimprovements in turndown can almost certainly be achieved by employing atomizers with smaller flownumbers, especially at the lower pressures, and possibly by further optimizing the position of theatomizers within the spray cups to achieve better air blast atomization and dispersion. Figure 22: Measured NOx emissions at T3=864 °F (736 K) Figure 23 shows the scaled NOx emissions at T3=1034 °F, the highest temperature permitted for theCE5 rig. For this high temperature, very consistent emissions trends are observed. The injector could beoperated at FAR as low 0.017 corresponding to equivalence ratio of 0.25. This is considerably lower thandemonstrated for the UEET injectors. Also, although the comparison is not shown here, the actual NOxemissions of the current 15-point 3ZI (E03 version) were shown to be considerably lower than the25-point UEET injector when compared at the same tested P3 and T3 [1]. Also, the turndown was shownto be better. Both imply a substantially improved design. Figure 23: Scaled NOx emissions at nominal inlet temperature of 1,034 °F (830 K) In order to predict LTO cycle emissions of the reference N+2 engine, it is necessary to obtain validcorrelations to extend emissions predictions beyond the current test range obtained in the CE5 testfacility. Extrapolation from the current data to the high pressures and temperatures would be unreliable.However, in light of the parallels between the performance of current injector and that of the IDomeinjector it is preferable to use or build on existing correlations that have been developed for the IDomeinjectors [1- 3]. Thus, the pressure and temperature dependence of the correlations developed by Wey [1-3] can be used, namely: This dependence on pressure and temperature has been demonstrated to provide a good correlation forvarious IDome injectors [1, 2,3]. When plotting the emissions predicted by Wey’s correlations against all the measured data from thecurrent injector experiments, substantial scatter is observed and useful trends are not obvious. However,when limiting the data to T3 = 1,034 °F and P3 ≥ 200 psi, which is in the range of pressures andtemperatures that were used in the development of Wey’s correlations, and plotting the ratio of measuredemissions to predicted emissions against the FAR in combustion zone (i.e., cooling flows are excluded to be consistent with the correlation), a useful trend is observed. This is shown in Figure 24. For FAR aboveabout 0.027 the current measured emissions are lower than those predicted by the correlations for theUEET injector and at a local FAR above 0.03 the measured emissions are about 5% lower than predictedby the correlation. Note that the UEET injectors could not be operated at FAR below about 0.022. FAR Figure 24: Comparison of measured NOx emissions and emissions predicted by the Weycorrelation (measured data is from tests of 200 psi and 250 psi, for nominal inlet temperature of1,034 °F (830 K)) If it is assumed that the ratio shown in Figure 24 can be used as correction factor for the Weycorrelation at high power settings, the LTO Cycle emissions can now be predicted. With this approach,and using a proprietary LTO cycle provided by NASA Glenn Research Center, emissions of24.6 g NOx /kg fuel and 36.4 g NOx /kg fuel are obtained for the 85% and 100% thrust settings of thereference 60,000 lbf, N+2 engine. Using these emissions numbers along with conservative estimates ofemissions for the 7% and 30% thrust settings that are based more directly on the measured data, the LTONOx emissions for the reference engine can now be estimated as shown in Table 1. Table 1: Summary of estimated emissions for 60,000lbf, 55 overall pressure ratio N+2 engine Thrust Setting LTO Time Fuel Flow EINOx Total NOx % Minutes kg/s g NOx/kg fuel g 100% 0.7 1.91 36.4 2,924 85% 2.2 1.59 24.6 5,057 30% 4 0.48 3.9 452 7% 27 0.137 3.0 662 Based on the data in Table 1 the LTO cycle emissions of the reference N+2 engine would be 34.1 gNOx / kN, or 31% of the 108.6 g/kN CAEP/6 emissions target(-1.04+2OPR, where OPR is the overallpressure ratio ofthe engine at 100% rated thrust). While the emissions results demonstrated with the current 3ZI are already excellent, Parker isconfident that further improvements can be made. First and foremost, the atomizer flow numbers can bereduced to produce finer spray with higher injection velocity at any given operating point. This isexpected to improve both low-power operability and reduce high-power emissions. Second, the injectorinsertion depth can be adjusted to find an optimum for critical performance characteristics. Thirdly,flexible staging schemes can easily be incorporated into the injector. Finally, the combustor linergeometry can be optimized for the current injector to reduce the time of hot products in the combustor andlower emissions. Following the completion of the combustion tests with the E03 injector, Parker manufactured theE04 injector, which incorporates lower flow number atomizers and other changes, and delivered to NASAfor testing in the CE5 rig. These tests could not be completed before the program ended as access to theCE5 test rig was delayed by several months, in part by unusual cold weather conditions in the lattermonths of 2013. The tests of the E04 injector are expected to be completed by late spring of 2014. Parkeris confident that the tests will show improved operability (turn down) and lower emissions. 7Valve Development Parker developed a high-speed fuel valve for this project based on its proprietary piezo actuatortechnology. The valve enables fuel trim function and it provides means to for high-bandwidth modulationof fuel flow in the primary fuel circuit in order to extend the lean stability limit and control combustiondynamics. Key design requirements for valve operation are a bandwidth of 1,000 Hz and a modulationauthority of at least 10% at 1,000 Hz. Both targets have been met in verification testing at Parker. At theend of the program, Parker delivered a valve to NASA support modulated experiments that will beconducted in 2014. The following sections summarize the valve development effort, including valve design, valvemanufacture and assembly, and valve performance. 7.1 Valve Design The electronic fuel modulation valve technology that Parker has been developing in recent years hasbeen advanced under the ERA program to meet high-bandwidth requirements. The valve is a pressure-balanced metering valve driven by a proportional piezo actuator that is proprietary to Parker. The actuatorhas demonstrated operation in excess of a few billion cycles and can operate at much higher frequenciesthan conventional electromechanical actuators while delivering comparable force and stroke. The actuatoris currently in production by Parker for industrial valve applications and has been suitably adapted foroperation with liquid fuels. The fuel modulation valve can be designed with an internal bypass channelthat sets a nominal (unactuated) flow area if desired. A key feature of the valve is an in-situ displacementsensor to monitor spool position in real time; position information can be used as a feedback signal forclosed-loop control of the valve, as well as for diagnostic purposes. Two different prototype valve designs have been demonstrated under prior development programsand both have been successfully operated in combustion rigs. The first valve was operated in proportionalmode (no high-frequency dither component) using Jet-A liquid fuel in a high-pressure combustor. Inseries with a fuel injector, it was able to achieve a modulation authority of over 20% of nominal flow. Thesecond valve was deployed in an atmospheric combustor fueled by gaseous hydrogen. This valve wasoperated with a sinusoidal drive signal at frequencies as high as 500 Hz. It demonstrated the capability tocontrol both the amplitude and the frequency content of combustor pressure and heat release rate. In building a valve for the current program, features from both predecessor valve designs wereincorporated; namely, the liquid fuel capability from the first valve and the high-speed dither capability from the second valve. A key design challenge, however, was to increase the operating bandwidth of theactuator within the valve from 500 Hz to 1,000Hz. Previous actuators were limited to resonantfrequencies below 500 Hz. While they can be driven above resonance, the resulting actuator stroke issignificantly diminished. In addition, driving at or near resonance can potentially damage the actuator.The approach taken for this program was to incorporate a new actuator design that increased the resonantfrequency of the actuator beyond 1,000 Hz. Figure 25 shows photographs of the redesigned piezoactuator; it uses a symmetric displacement amplifier design coupled to second stage that results in motionalong the axis of the piezo stack when actuated. The addition of the second stage, with compliant springs,significantly increased the resonant frequency of the actuator. Also, carbon fiber material was used for thearms to minimize the driven mass. Figure 25: Photograph of high-frequency piezo actuator (E02 design) After completing actuator design and verification testing (see Valve Performance section) the designeffort shifted to the valve assembly. Three valve designs were completed under this program. The firsttwo valves (designated“E01”and“E02”) were sized for the E01/E02 fuel injector variants. Afterfabrication and performance validation of the E01 valve, the third valve (E03) was designed for the E03injector. The valve is intended to be placed upstream of and in series with the pilot injector. Accordingly, theoverall flow number (FN) of the pilot circuit will be a combination of the flow numbers of the valve andthe pilot tip; see Figure 26 for a flow schematic. The valve itself has potentially three parallel flow pathswithin the valve: (1) leakage due to diametral clearance between spool and sleeve, (2) an optional bypasschannel, and (3) the variable flow area metered by the actuator. The total valve flow number is acombination of all three. Modulation authority is defined as: (FN @ 100% -FN @ 0%) /(FN @0%),where the percentages refer to the stroke of the piezo actuator, with 0% representing unactuated (nominal)position and 100% representing maximum stroke. Figure 26: Flow schematic of modulated primary circuit The size of the metering slot was chosen based on the 1,000 Hz actuator response to meet the 10%modulation authority target. This allows the pilot circuit FN to be set as much as 10% richer than nominal(statically), or to oscillate (dynamically) with variable amplitude up to 10% peak-to-peak around a presetvalue to control combustor dynamics. In order to meet the above design requirement, a decision was made to eliminate the bypass channelin the valve and instead meter all the flow through a single, variable area channel. Figure 27 showspredicted valve response (FN vs. displacement) on the left, and the resulting pilot circuit response on theright. The solid vertical marker at 0.011”corresponds to the mean displacement at 1,000 Hz, while thedashed lines at 0.008”and 0.014”correspond to the min and max displacements at 1,000 Hz, respectively.Thus, the nominal flow condition can be set by driving the actuator to a stroke of 0.008”regardless ofoperating frequency. The 10% authority can be achieved by driving the spool position to higherdisplacement and opening the metered flow area. Note that at lower frequencies, higher modulationauthorities can be achieved since the peak-to-peak variation of actuator displacement is greater than at1,000 Hz (effectively, the dashed lines move outward). Figure 27: Predicted E01/E02 valve (left) and pilot circuit (right) response as a function of piezoactuator displacement The E01 valve design was fabricated and tested; details are provided in the following sections of thisreport. The valve performed in line with predictions, validating the design approach as well as theactuator performance. Note the spool mass is approximately 0.44 g, which is an order of magnitudereduction over the most recent Parker design. Following this, the E03 version piezo valve was designed.The valve has four ports: (1) fuel inlet, (2) fuel outlet, (3) electrical feed-through for actuator lead wire,and (4) in situ displacement sensor. The metering geometry of the valve was specified to provide at least 10% modulation authorityacross the entire 1,000 Hz bandwidth based on the performance ofthe piezo actuator. Figure 28 shows aplot of predicted maximum modulation authority as a function of oscillation frequency. Note thatauthority greater than 10% can be achieved over the entire target bandwidth. Furthermore, the valve canbe also operated to achieve a “flat”10% authority response by lowering the amplitude of the piezo drivevoltage at lower frequencies (although the closed-loop control required for this is beyond the scope of thiseffort). Figure 28:Predicted maximum modulation authority vs. operating frequency for E03 valve 7.2Valve Manufacturing As described above, three versions of the piezo valve assembly were fabricated. Given the technicalrisk relative to earlier valve designs - especially use of a 2-stage piezo actuator and significantly smallerspool and sleeve components - Parker accelerated fabrication of the prototype valve from Year 2 toYear 1. The E01 and E02 design packages were finalized in late July 2012 and released in early August2012. Valve components were received by mid-September 2012, and the E01 valve was assembledshortly thereafter. No noteworthy issues were encountered during fabrication or assembly. The E03 design package was released in March 2013, and valve assembly was started in June 2013after receipt of components. Two E03 valves were manufactured; one valve was delivered to Universityof Cincinnati for atmospheric combustion experiments while the other valve is slated for future high-pressure combustion experiments in NASA’s CE-5 facility. Figure 29 shows a photograph of one of theE03 valves during assembly with the cover removed. Figure 30 shows the entire valve system, includingthe piezo valve assembly, in-situ displacement sensor readout unit (tethered to the valve via fiber-opticcable), and high-pulse power amplifier for driving the actuator up to 1,000 Hz. Figure 29: Photograph of piezo valve assembly (E03) Fiberoptic Cable (6’) Figure 30: Complete piezo valve system 7.3 Valve Performance This section summarizes the performance validation measurements performed by Parker during ERAvalve development, along with the associated experimental results. The E03 valve has been verified tomeet target requirements for bandwidth and modulation authority. However, as mentioned above,operation of this piezo valve has not yet been demonstrated in combustion rig testing with Parker’s ERAfuel injector. The first characterization testing was performed on the redesigned 2-stage piezo actuator. A standardbattery of teststs was performed, including: displacement vs. applied voltage, hysteresis, resonantfrequency, and dynamic response to sinusoidal waveforms of varying frequency (10 to 1,000 Hz).Maximum displacement was found to be 0.019”under DC excitation, which is comparable to the outputof single arm actuators with the same piezo element. Hysteresis was measured to be 10%, which is typicalfor piezo actuators. For the actuator alone, resonant frequency was measured to be approximately 800 Hz;resonance was reduced to 550 Hz and 450 Hz, for 0.5 g and 1 g mass loads, respectively. Figure 31 shows the frequency response for an actuator with 0.5 g mass load, including both apredicted response curve (blue) and measured values (red dots) along with their corresponding time plotsof displacement at three different frequencies: 10 Hz, 850 Hz, and 1,000 Hz. In each case, the actuatorwas driven with the largest allowable sine wave (85±85 V). The predicted curve is calculated assumingthe actuator behaves as an underdamped oscillator with a resonant frequency of 550 Hz. The measuredpeak-to-peak displacements are 0.018”at 10 Hz, 0.012” at 850 Hz, and 0.007”at 1,000 Hz, in good agreement with the predicted response. Measured average displacement is 0.011”. These results indicatean upper bound on the displacement range that the piezo actuator can provide across the target operatingbandwidth, assuming the spool can be designed with a mass of 0.5 g, a target that was indeed met. Theseresults confirm that the actuator can meet the 1,000 Hz operating requirement and is expected to provideup to ± 0.0035”stroke variation at 1,000 Hz. Furthermore, the actuator should have a “flat”response upto approximately 750 Hz. Frequency (Hz) Figure 31: Frequency response of piezo actuator with 0.5 g load for 85± 85 V sinusoidal input Following assembly of the E01 piezo valve, its performance was characterized on an existing Parkerflow stand. The performance was investigated under both static and dynamic operating conditions,both ina valve-only configuration (discharging directly to atmosphere) and in series with a downstream orificerestrictor of flow number approximately equal to that of the injector primary tip. The majority of the flowtests were performed with MIL-PRF-7024 test fluid at 80°F at an inlet pressure of approximately100 psig. Mass flow rate was measured with a Coriolis flow meter, fluid pressures upstream (P1) anddownstream (P2) of the valve were measured with Druck transducers, and spool position (i.e., valvestroke) was measured in situ with a Philtec fiberoptic non-contact sensor. A LabView DAQ system wasutilized to apply analog waveforms to the valve actuator and acquire measurement data in real time. Figure 32 shows a graph of flow number vs. valve stroke under static operating conditions. For eachvalue of stroke, the flow numbers of the valve, the orifice, and the series combination of the two were calculated based on measured flow rate and associated pressure drops. The valve exhibits linear increasein flow number beyond an initial 0.005”deadband. The orifice flow number is relatively constant, asexpected. The assembly response can be used to predict average flow number and modulation authorityunder dynamic operation. For example, if the valve is operated at an average stroke of 0.010”with adither amplitude of 0.003”, the modulation authority will be based on the flow numbers at 0.007”(i.e.,minimum) and 0.013”(maximum) stroke. The mean dynamic flow number can be determined byintegrating the curve between these two stroke values; note that due to the asymmetry of the curve, thismean flow number will be slightly different than the flow number at the average of the two strokeextremes (i.e., 0.010”in this example). Figure 32: Graph of flow number as a function of E01 valve stroke Figure 33 shows the frequency response of the valve actuator when driven from rail to rail (i.e., 0 to170 V) with a sinusoidal input. Note that the voltage amplitude was reduced at 500 Hz and 600 Hz so asnot to overdrive the actuator near its resonance frequency. Note also that the actuator is capable ofproviding 0.006”peak-to-peak stroke at 1,000 Hz, consistent with earlier actuator measurements, whichwill be sufficient to produce at least 10% modulation authority. 1200 ● ◆ ◆ 中 ◆ Figure 33: Measured frequency response of piezo valve actuator Based on the positive results from the E01 valve prototype testing, the E03 valve was designed andbuilt, and then characterized using the same testing approach as described previously for both the staticand dynamic tests. As before, most testing was performed at a nominal inlet pressure of 100 psig based onthe range of the available pressure transducers, although the valve is rated for 650 psig inlet pressure.Performance at higher inlet pressures should be substantially the same because the spool is pressure-balanced. Figure 34 shows the results of the static measurements (circles), overlaid onto the predictedperformance (solid lines). The predicted response was calculated based on the geometry of the meteringslot, deadband, leakage flow (determined by earlier experimental measurements), and estimated Cd. Notethe excellent correlation between measured and predicted response, except at low displacements. In thisrange, flow is minimal and small measurement errors in pressure translate to relatively large errors in thecalculated flow number. The valve response is linear, as expected; also, per the design intent, at higherdisplacement values, the pressure drop across the valve is minimal and the series flow number isapproximately equal to the tip flow number. Figure 34: Graph of flow number as a function of spool position under static operation, includingboth measured and predicted responses Dynamic operation was characterized following the static measurements. As before, the piezoactuator was driven with a sinusoidal waveform; in most cases the mean voltage was set to mid-rangeamplitude of 85 V. At low frequencies the actuator provides 0.015”peak-to-peak displacement around amean value of 0.011”. At 1,000 Hz the actuator is capable of providing 0.008”peak-to-peak variationaround a mean value of 0.012”; this can also be seen in Figure 35, which shows a snippet of the timeresponse of measured spool position under 1,000 Hz excitation. Figure 35: Time response (in seconds) of spool position under a 1,000 Hz excitation Mean flow number was measured across a frequency range from 5 Hz to 1,000 Hz. Note that thecoriolis mass flow meter cannot respond fast enough to measure instantaneous flow under dynamic excitation, thus it only reports time-averaged flow rate. Valve modulation was therefore confirmed bymonitoring the pressure and displacement signals, both of which responded sufficiently fast across themeasured range of frequencies. The valve modulation authority at 1,000 Hz is estimated to be 11%, which meets the target authorityfor this program. The modulation authority can be substantially higher than 11% at lower frequenciessince a larger peak-to-peak displacement variation can be produced by the piezo actuator. With closed-loop control of the valve based on in-situ displacement monitoring, achieving a “flat”response across theentire frequency range is possible (although not demonstrated under the scope of this effort). Parker has completed assembly and validation testing of a second identical E03 valve for delivery toNASA, and will support installation and operation in CE-5 (or another NASA rig) as needed when a testwindow opens. 8Conclusions In this project, Parker delivered new LDI fuel injectors based on Parker’s 3ZI technology along withhigh-speed fuel valves capable of both fuel trim function and modulation of fuel flow for control ofcombustion dynamics. All combustion hardware was delivered on time under a program plan that wasaccelerated on request from NASA. Atmospheric combustion experiments demonstrated the excellentignition and LBO performance of the 3ZI. Emissions obtained with the first 3ZI variant tested at highpressure were almost on target for the ERA project, demonstrating 69% reduction in emissions fromCAEP/6. A second variant awaits testing and is expected to show still further reduction in emissions. Thehigh speed valve was demonstrated in laboratory tests to deliver the desired fuel modulation amplitude atthe target 1,000 Hz frequency, and has been delivered to NASA for implementation in the pending highpressure combustion testing of the E04 3ZI. In addition to demonstrating excellent emissions performance, the Parker 3ZI design has proven tobe highly capable with respect to the desired thermal and mechanical characteristics ofa field-worthyinjector. Furthermore, the concept has inherent flexibility and offers a clear path forward to further reduceemissions at both high and low thrust settings as well as optimized operability at low power settings.Specifically, performance can be improved through modification of the atomizer flow numbers andthrough optimization of the atomizer insertion depth in each spray cup, the swirl number of the spraycups, the size of the individual spray cups, as well as by employing new innovative cup designs andstaging schemes. The injector is also highly scalable offering an opportunity to employ the same injectorconcepts to vastly different engine sizes. The inherent design flexibility of the 3ZI concept makes it a very capable technology for current andfuture aviation gas turbine engines. In particular, the 3ZI technology has a promising path forward toapplication in future high pressure ratio engines where auto ignition and flash back will prove a majorchallenge for conventional low emissions combustion technology. Parker looks forward to realizing theseimprovements in the next generation of hardware in support of the N+3 program. [11 Tacina, R, Wey, C, Laing, P, A. Mansour, 2001,“A Low NOx Lean-Direct Injection, MultipointIntegrated Module Combustor Concept for Advanced Aircraft Gas Turbines”, Clean AirConference, Porto, Portugal. [21 Tacina, R, Wey, C, Laing, P, A. Mansour,“Sector Test of A low NOx, lean Direct InjectionMultipoint Integrated Module Combustor Concept”, Paper 2002-GT-30089, ASME: Turbo Expo2002, Amsterdam, The Netherlands. [3] Tacina, R., Mansour, A., Partelow, L. and Wey, C,"Experimental Sector and Flame-TubeEvaluations of a Multipoint Integrated Module Concept for Low Emission Combustors" Paper2004GT-53263, ASME: Turbo Expo 2004, Vienna, Austria. November This report is available in electronic form at http://www.sti.nasa.gov/ and http://ntrs.nasa.gov/ In November of 2011, Parker entered into a contract with NASA to conduct research in support of the Environmentally Responsible Aviation Project (ERA). During the project, Parker built and tested multipoint Lean Direct Injection (LDI) fuel injectors designed to meet NASA’s N+2 objective to reduce NOx emissions of aviation gas turbine engines by 75% from the ICAO standard adopted at CAEP/6. The injectors are based on Parker’s three-zone injector (3ZI) concept which has its origin in multi-point LDI injectors developed by Parker under NASA’s Ultra Efficient Engine Technology (UEET) program that delivered record-low emissions in flame tube tests and sector tests. The current injectors improve on thetechnology in terms of thermal performance, aerodynamic design flexibility, and integration with conventional combustors. They are highly practical, manufacturable, and scalable to various engine sizes.The innovative concept and construction offers a pathway to even higher pressure ratios than the target N+2 design.
确定


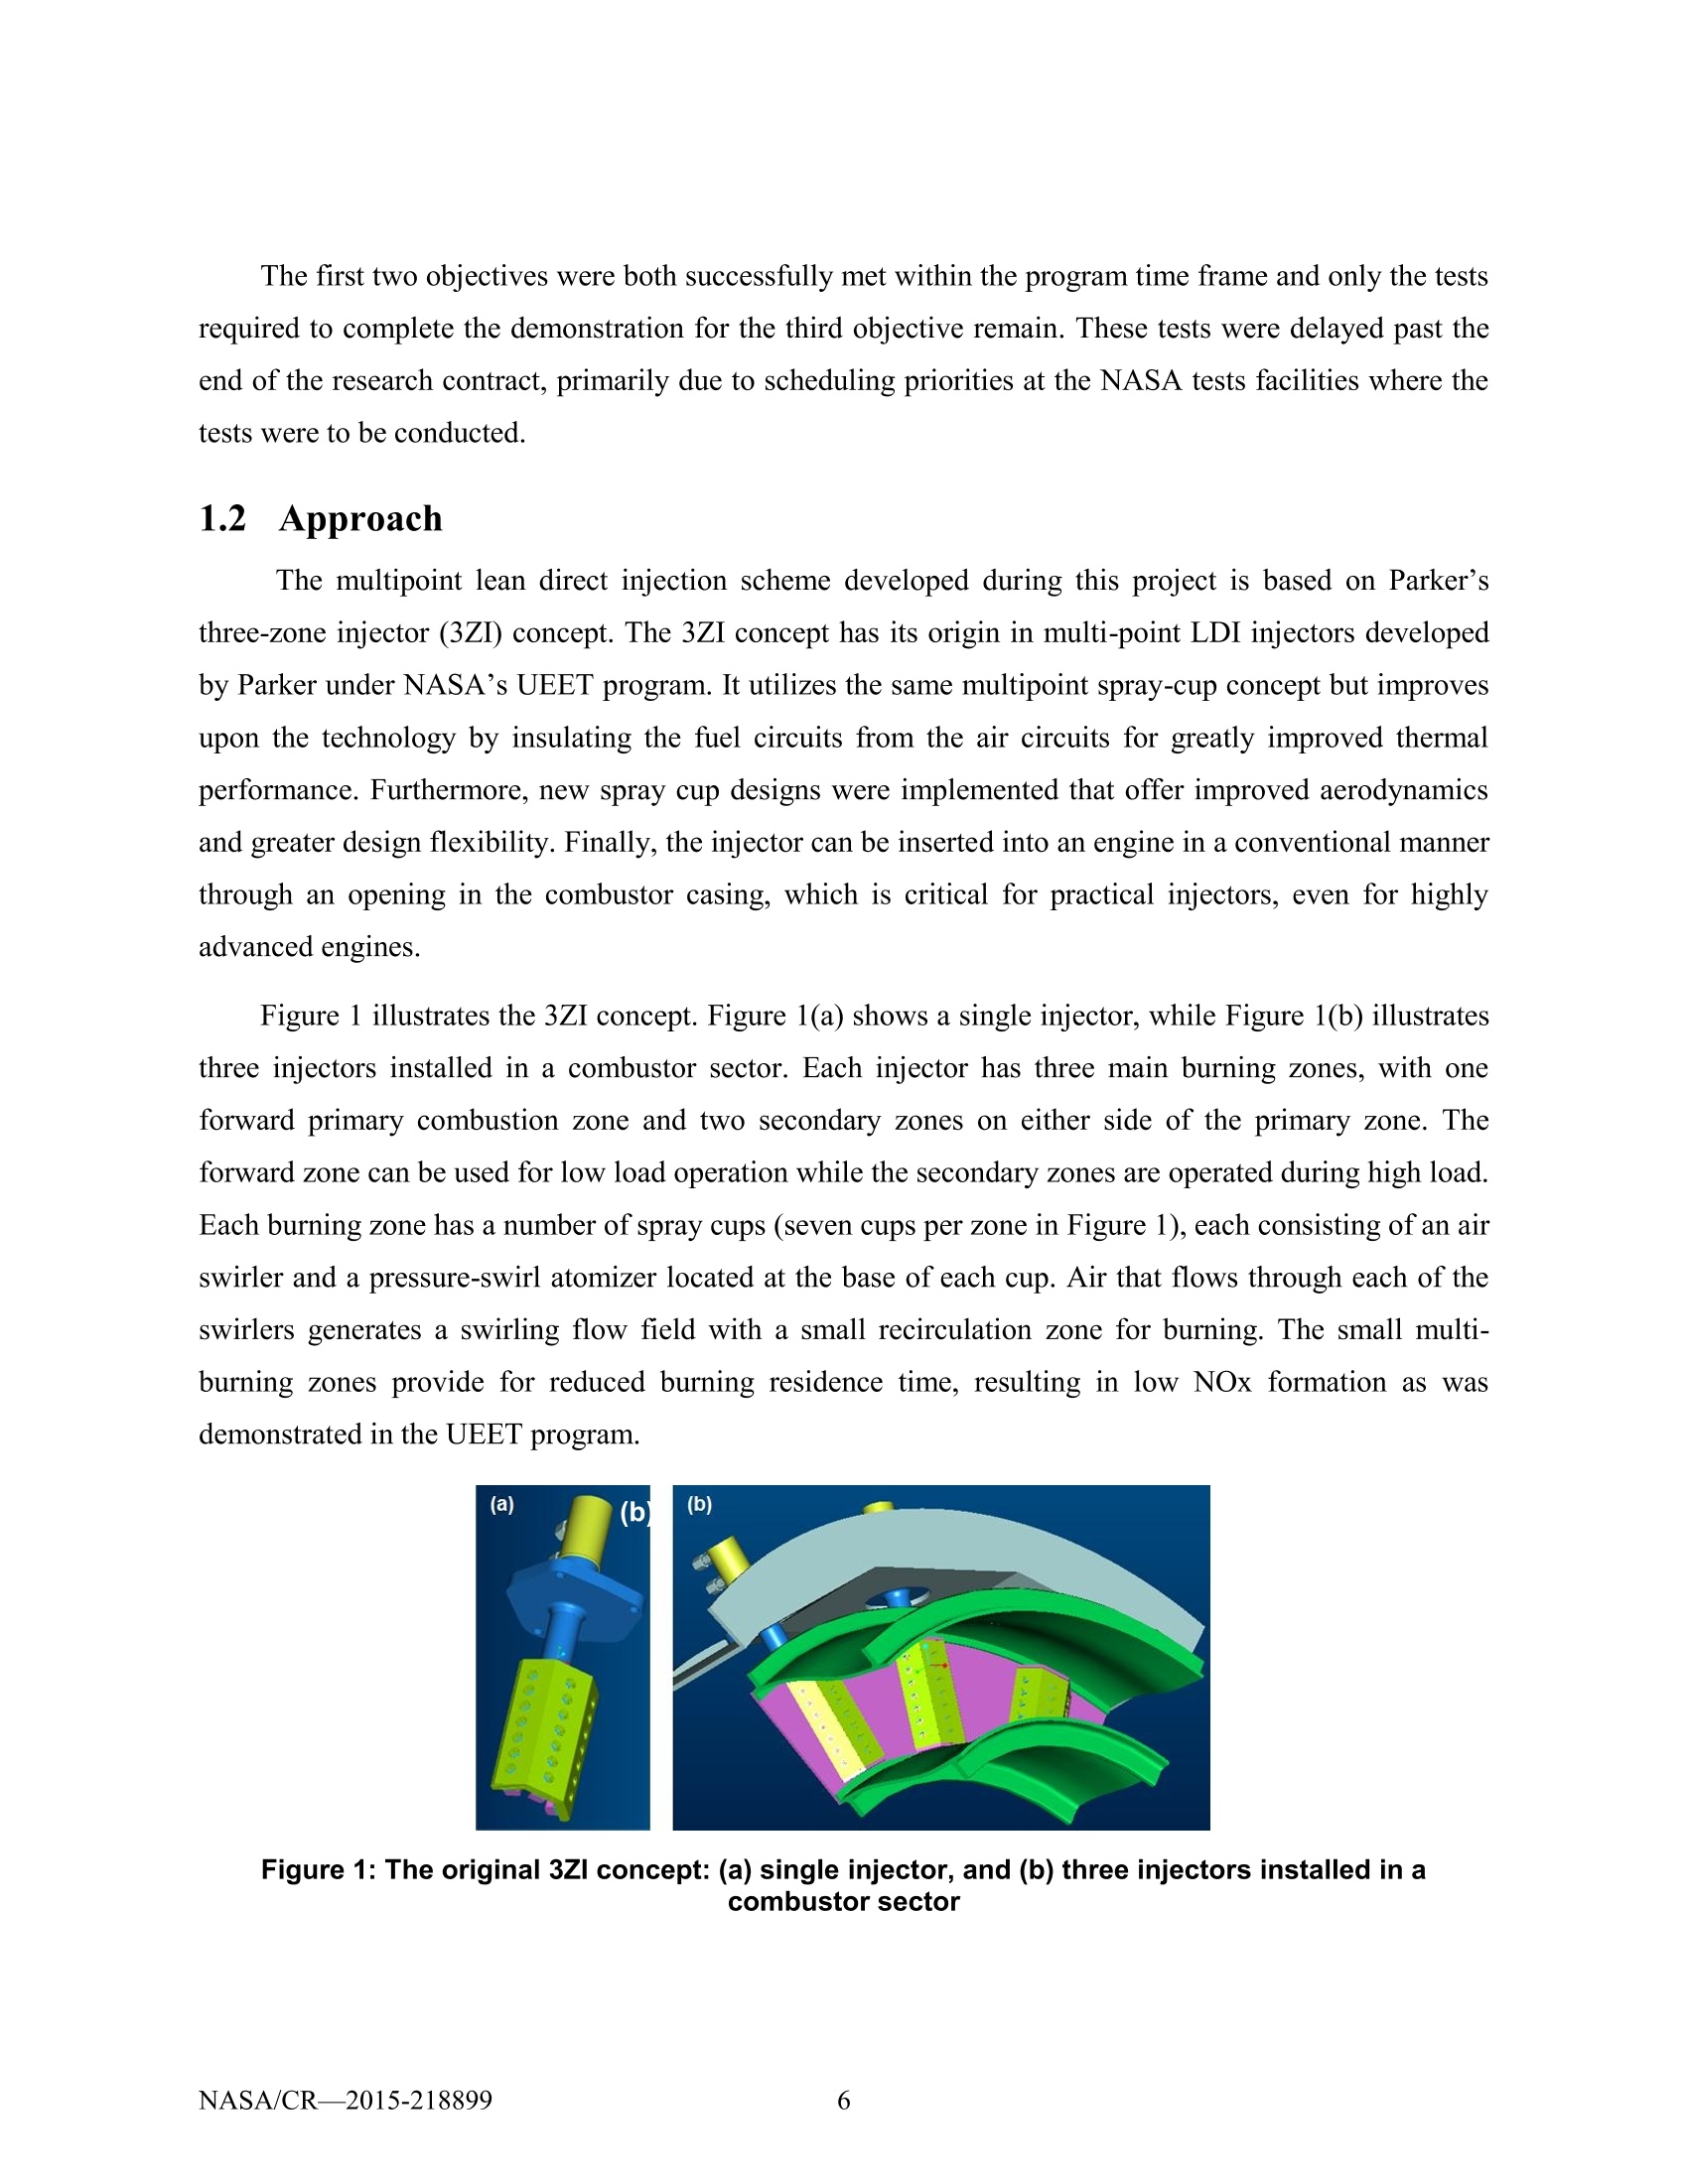

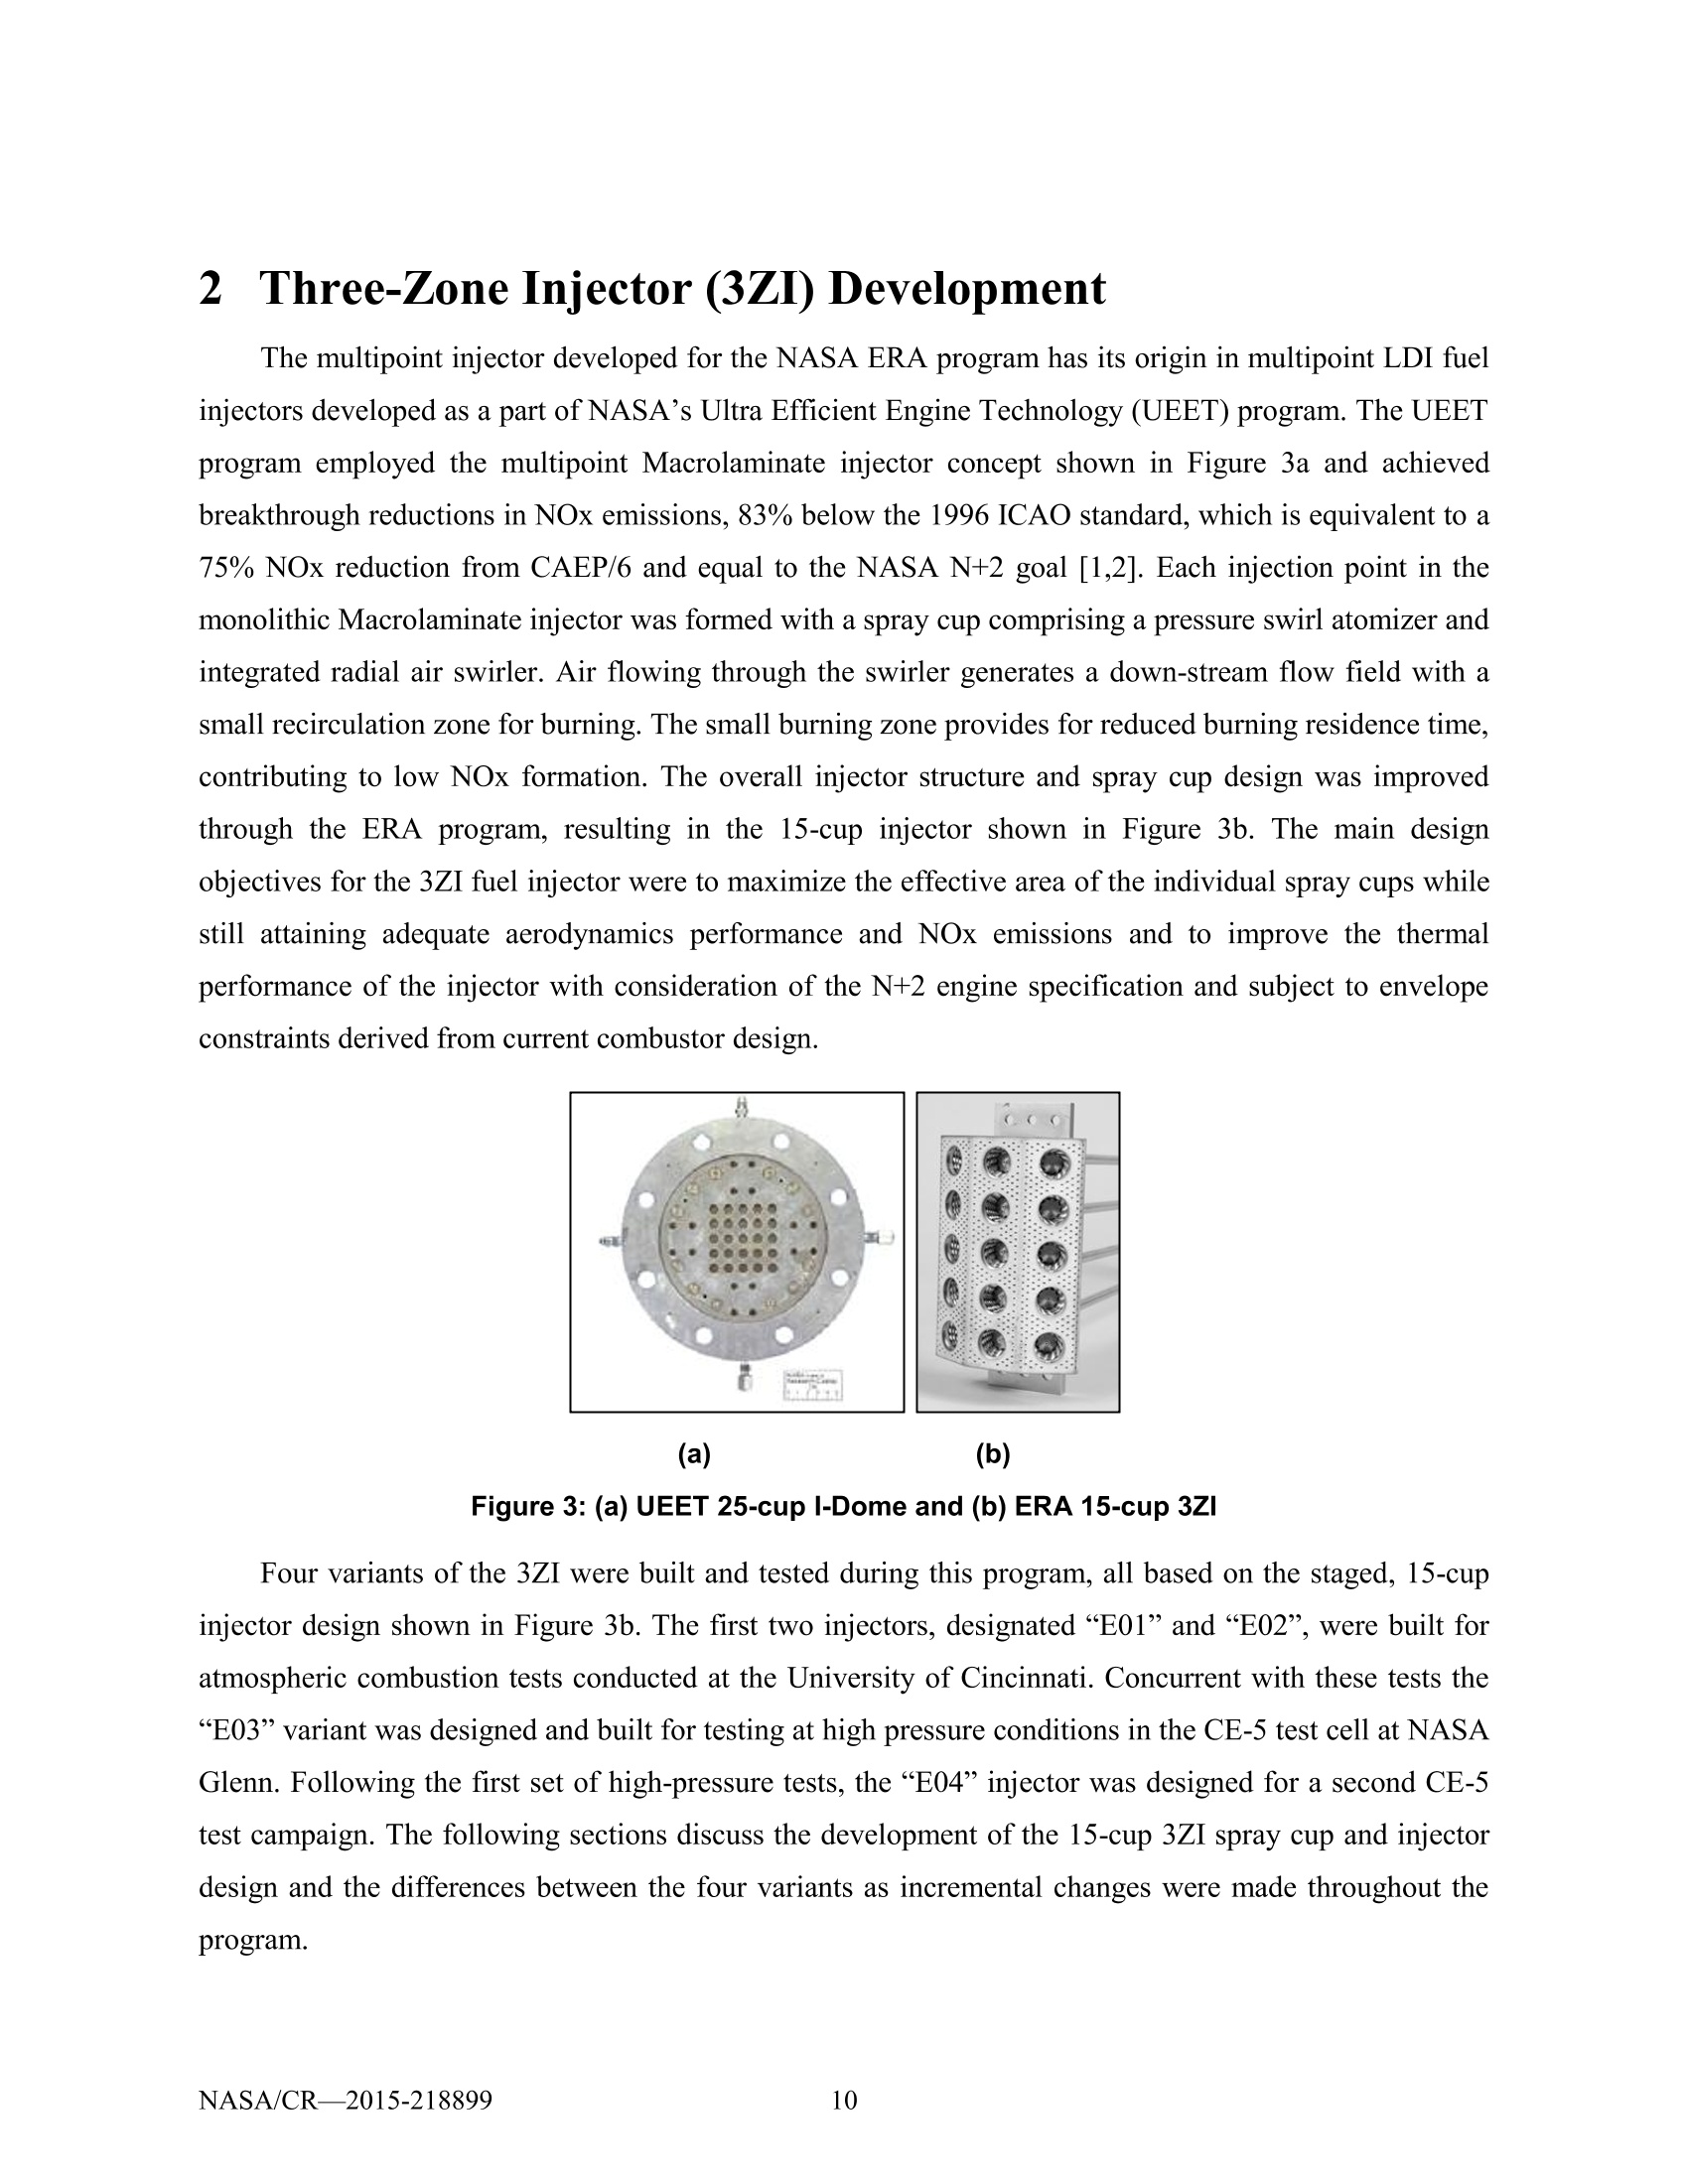
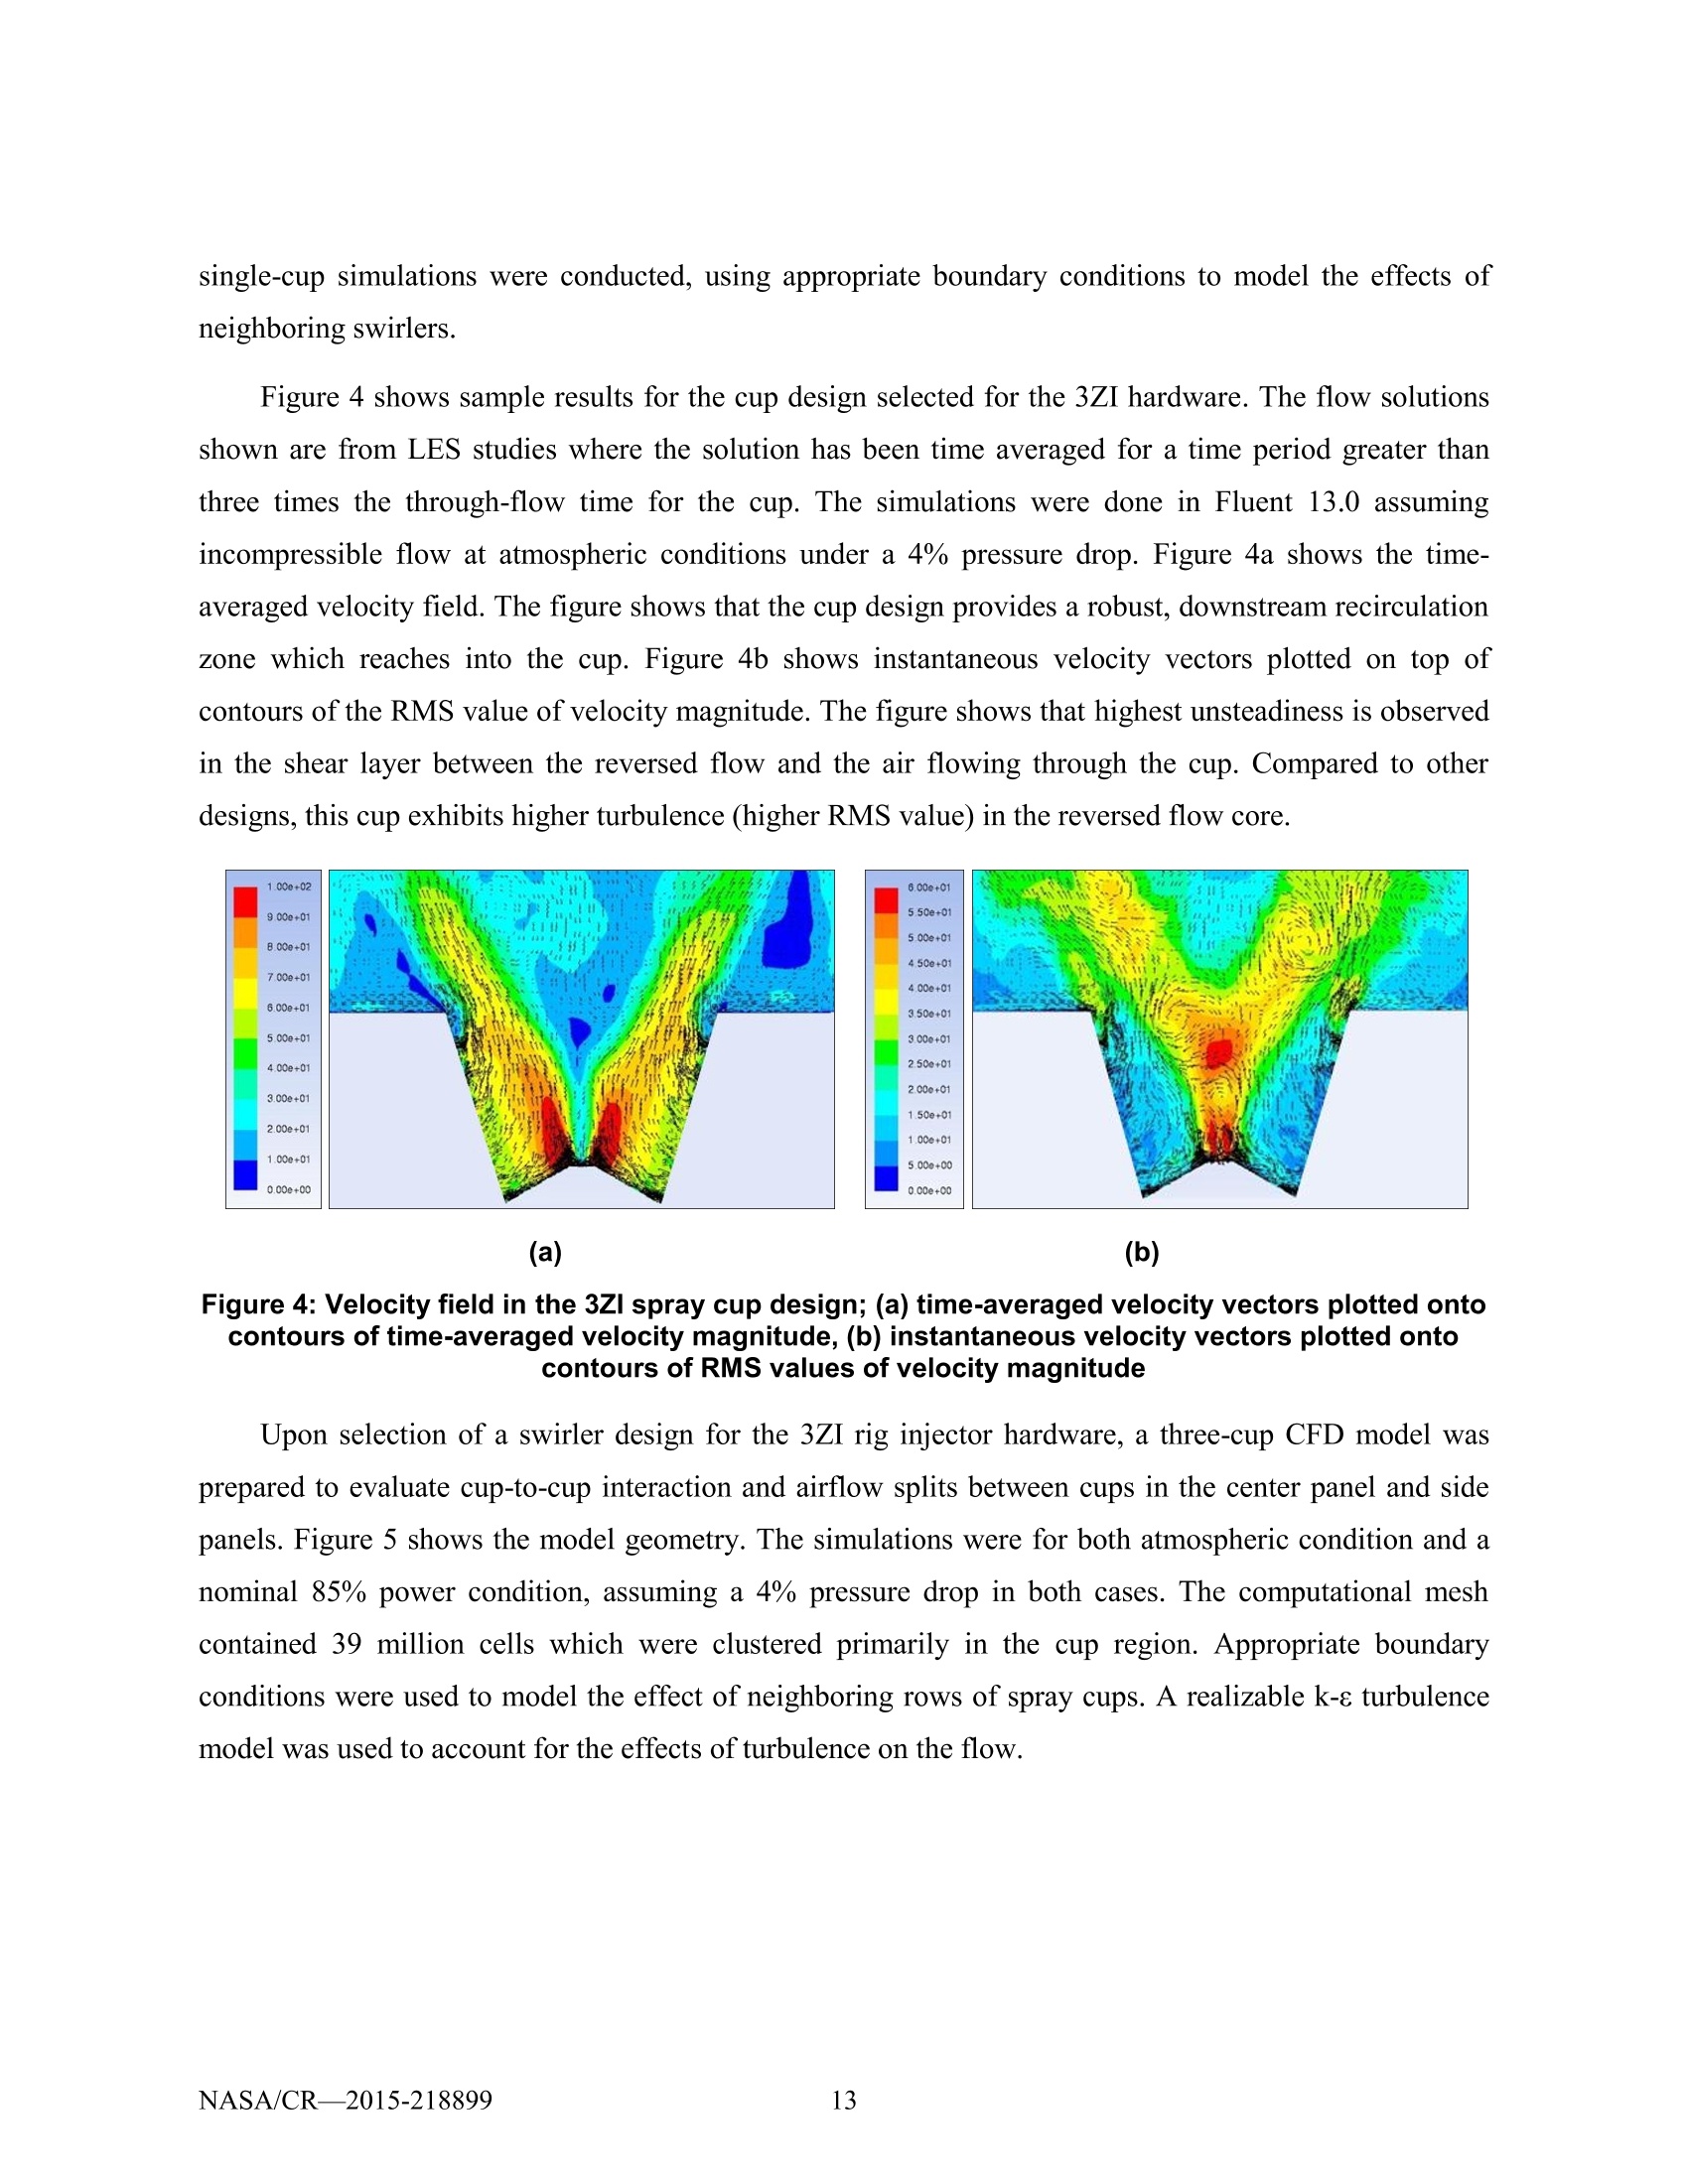
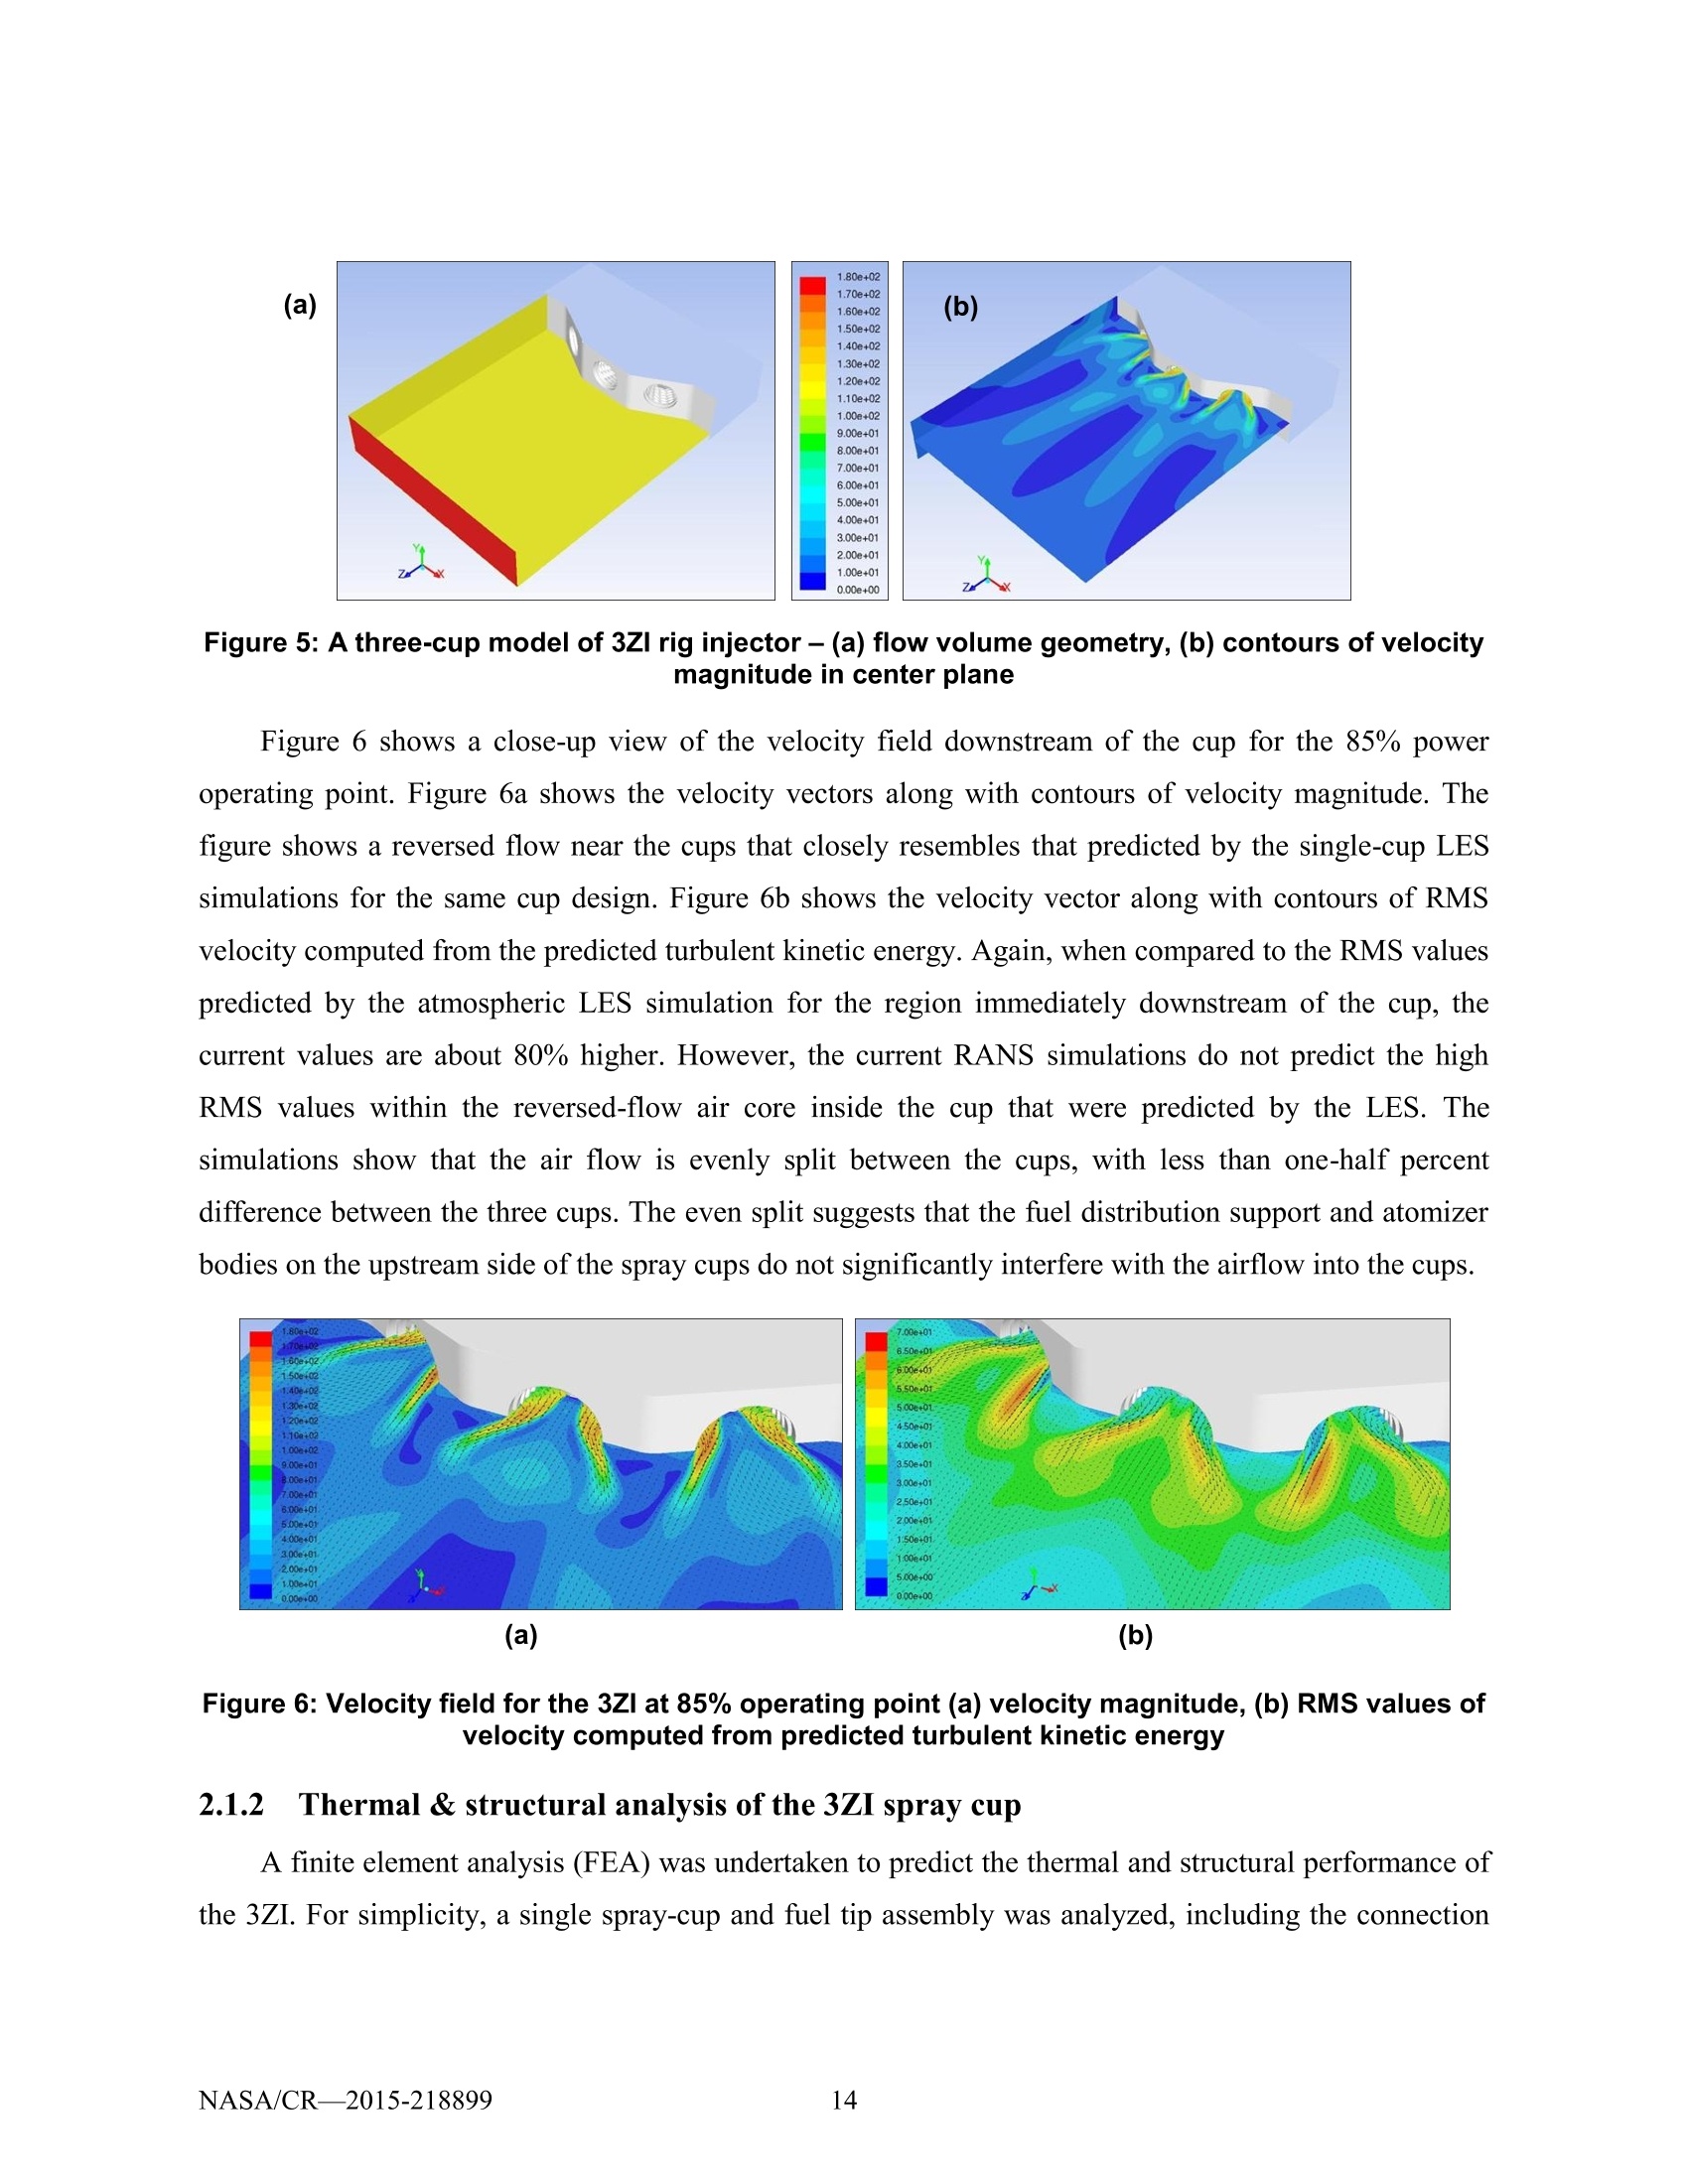

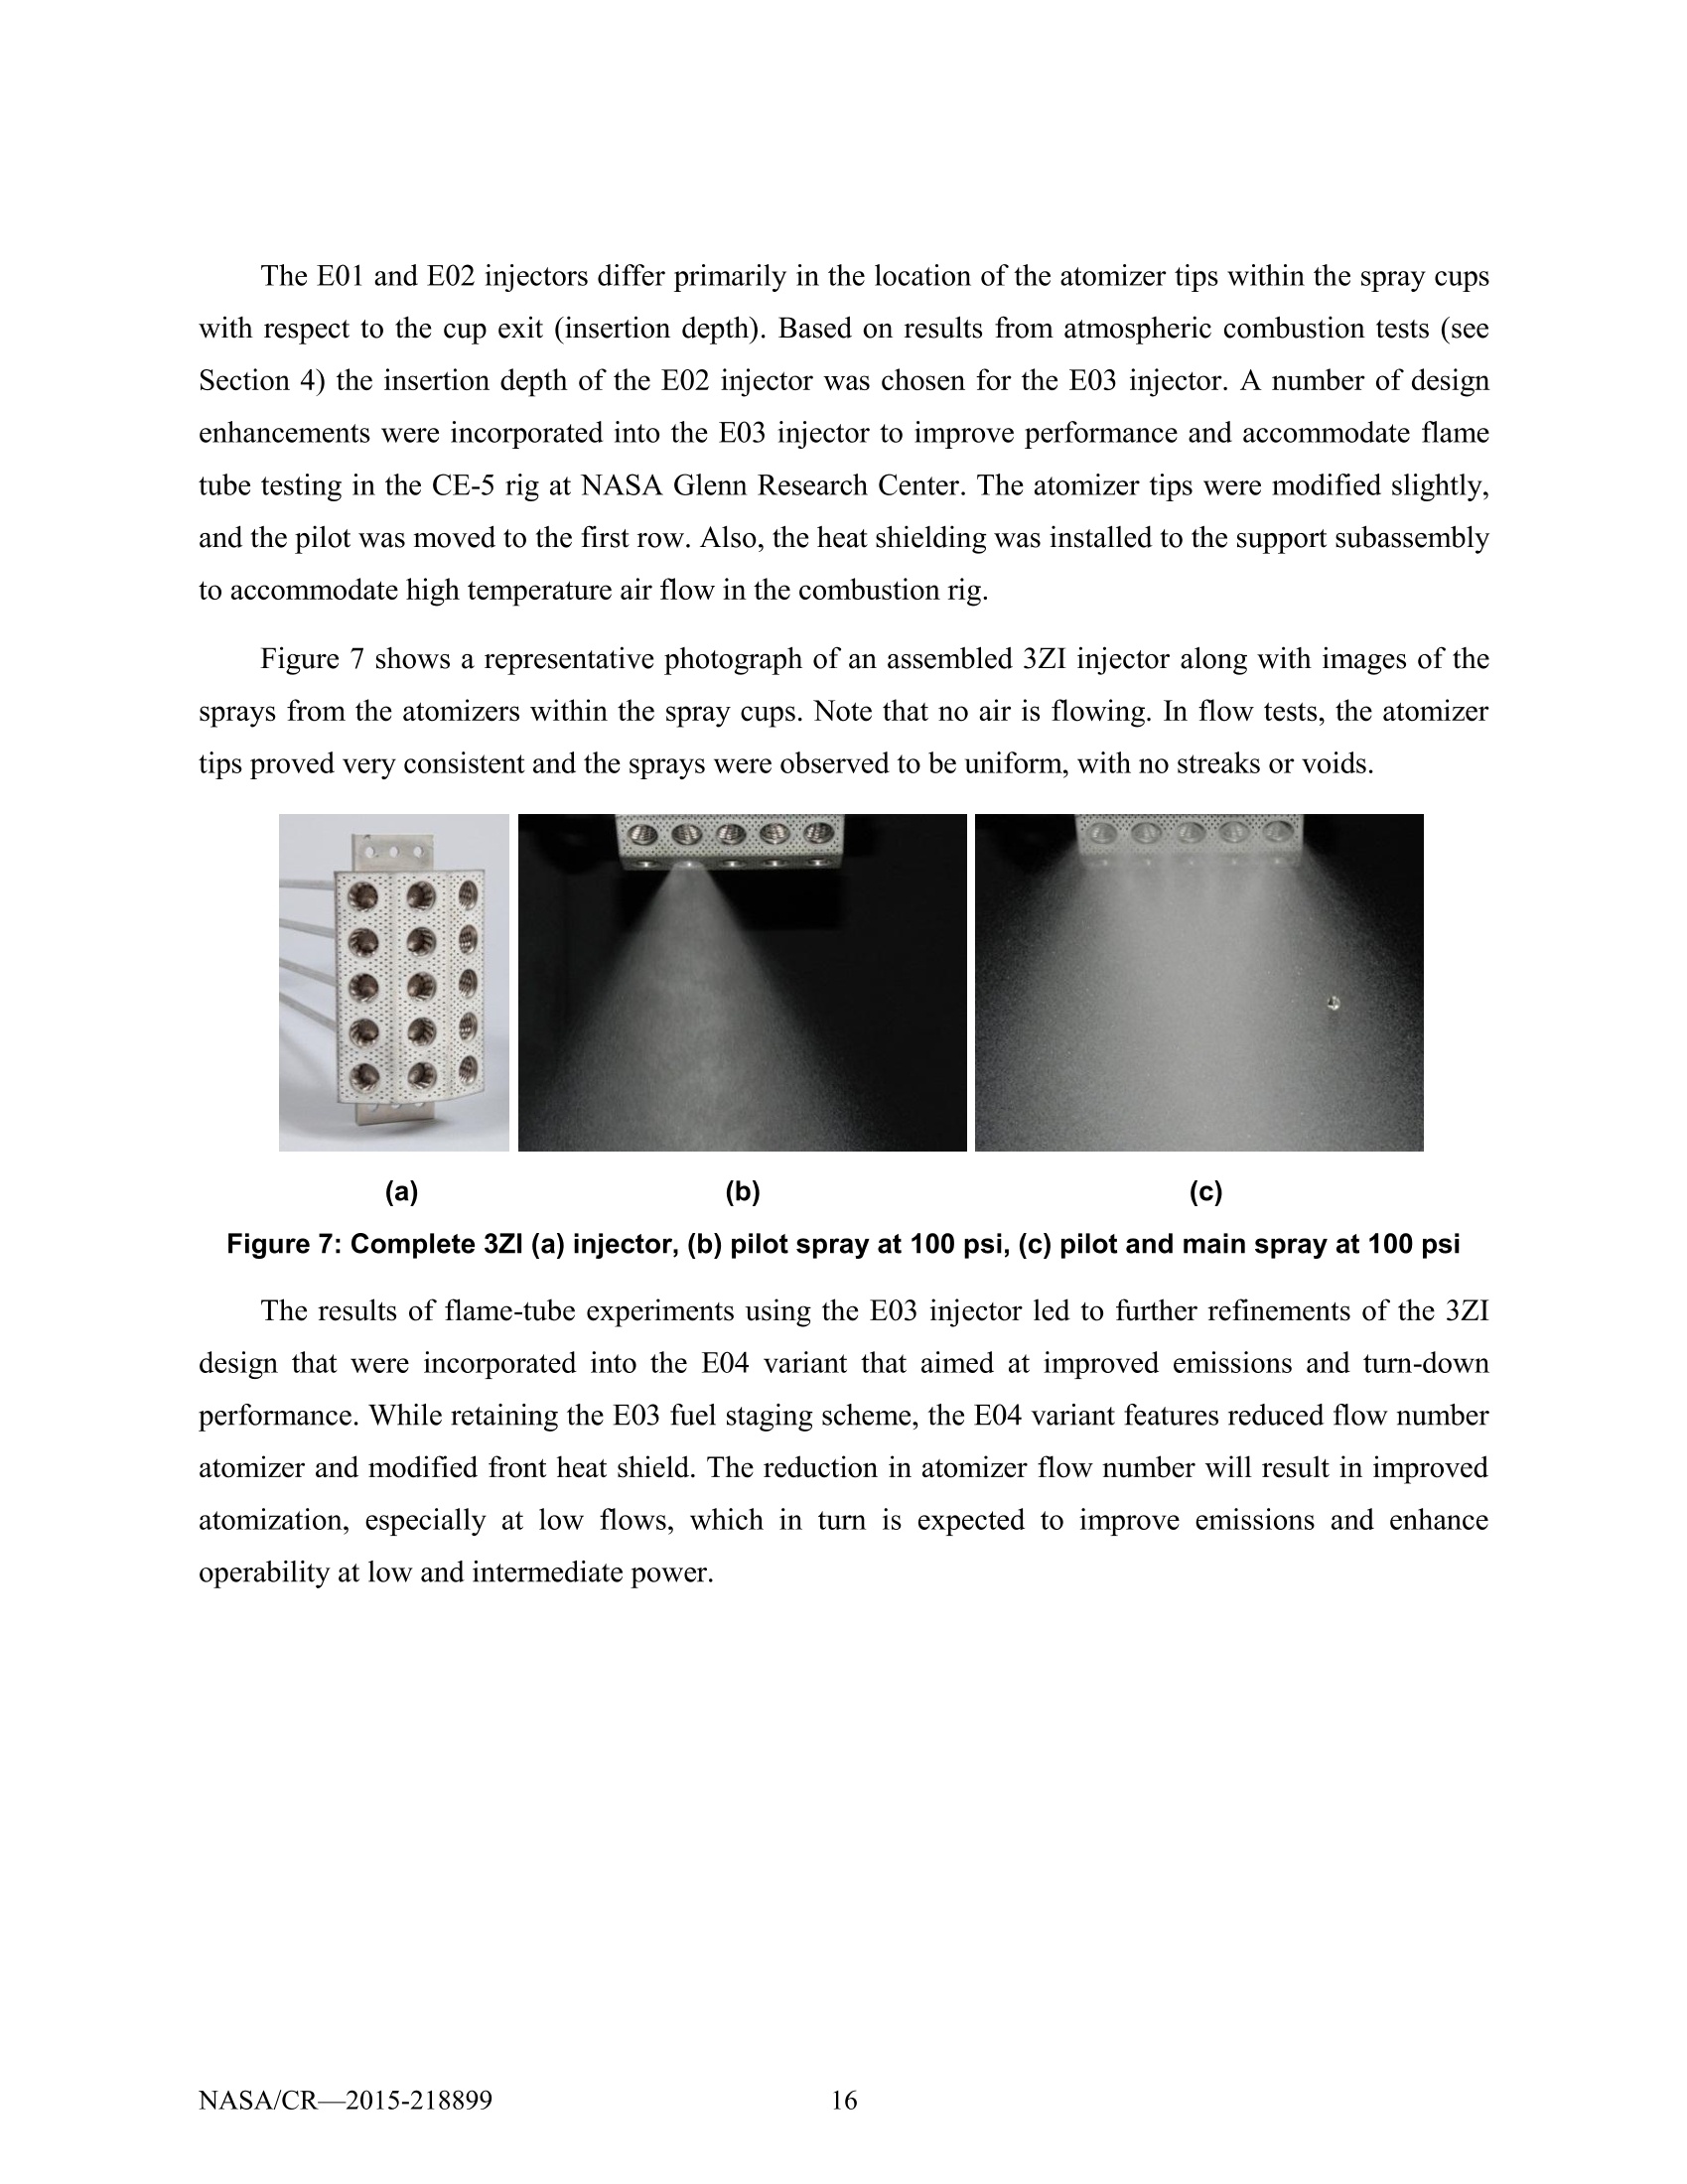
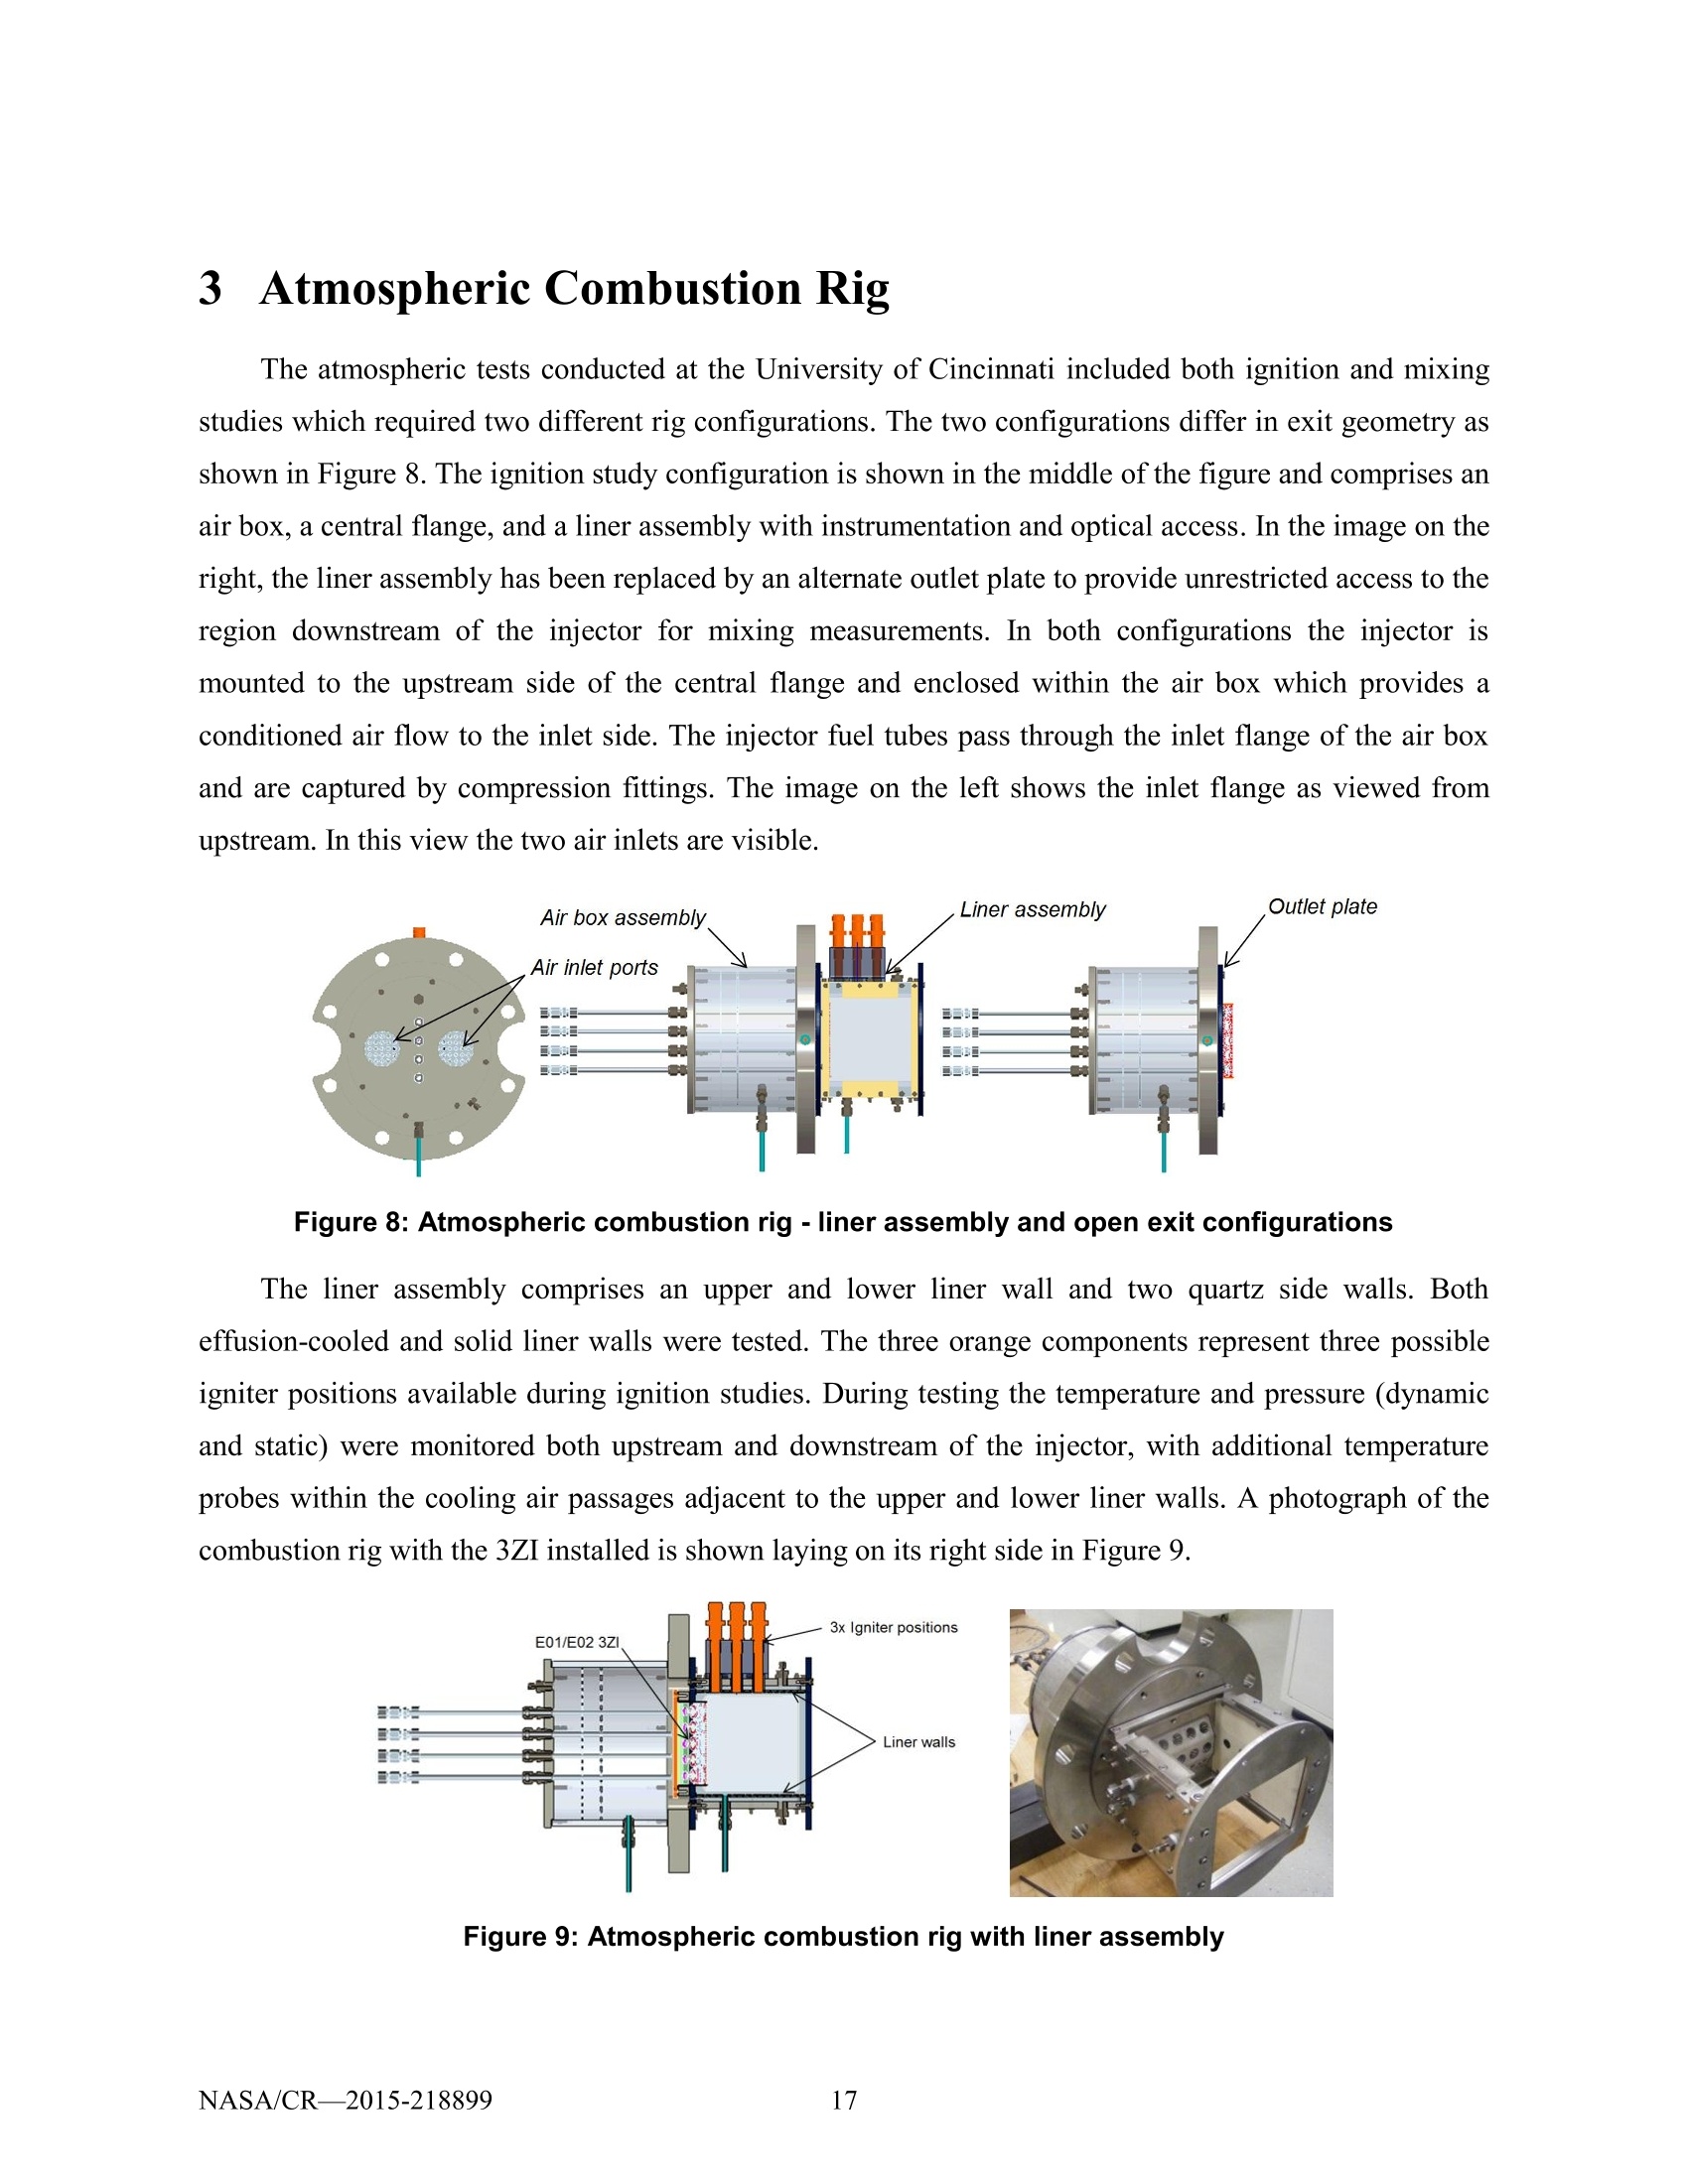

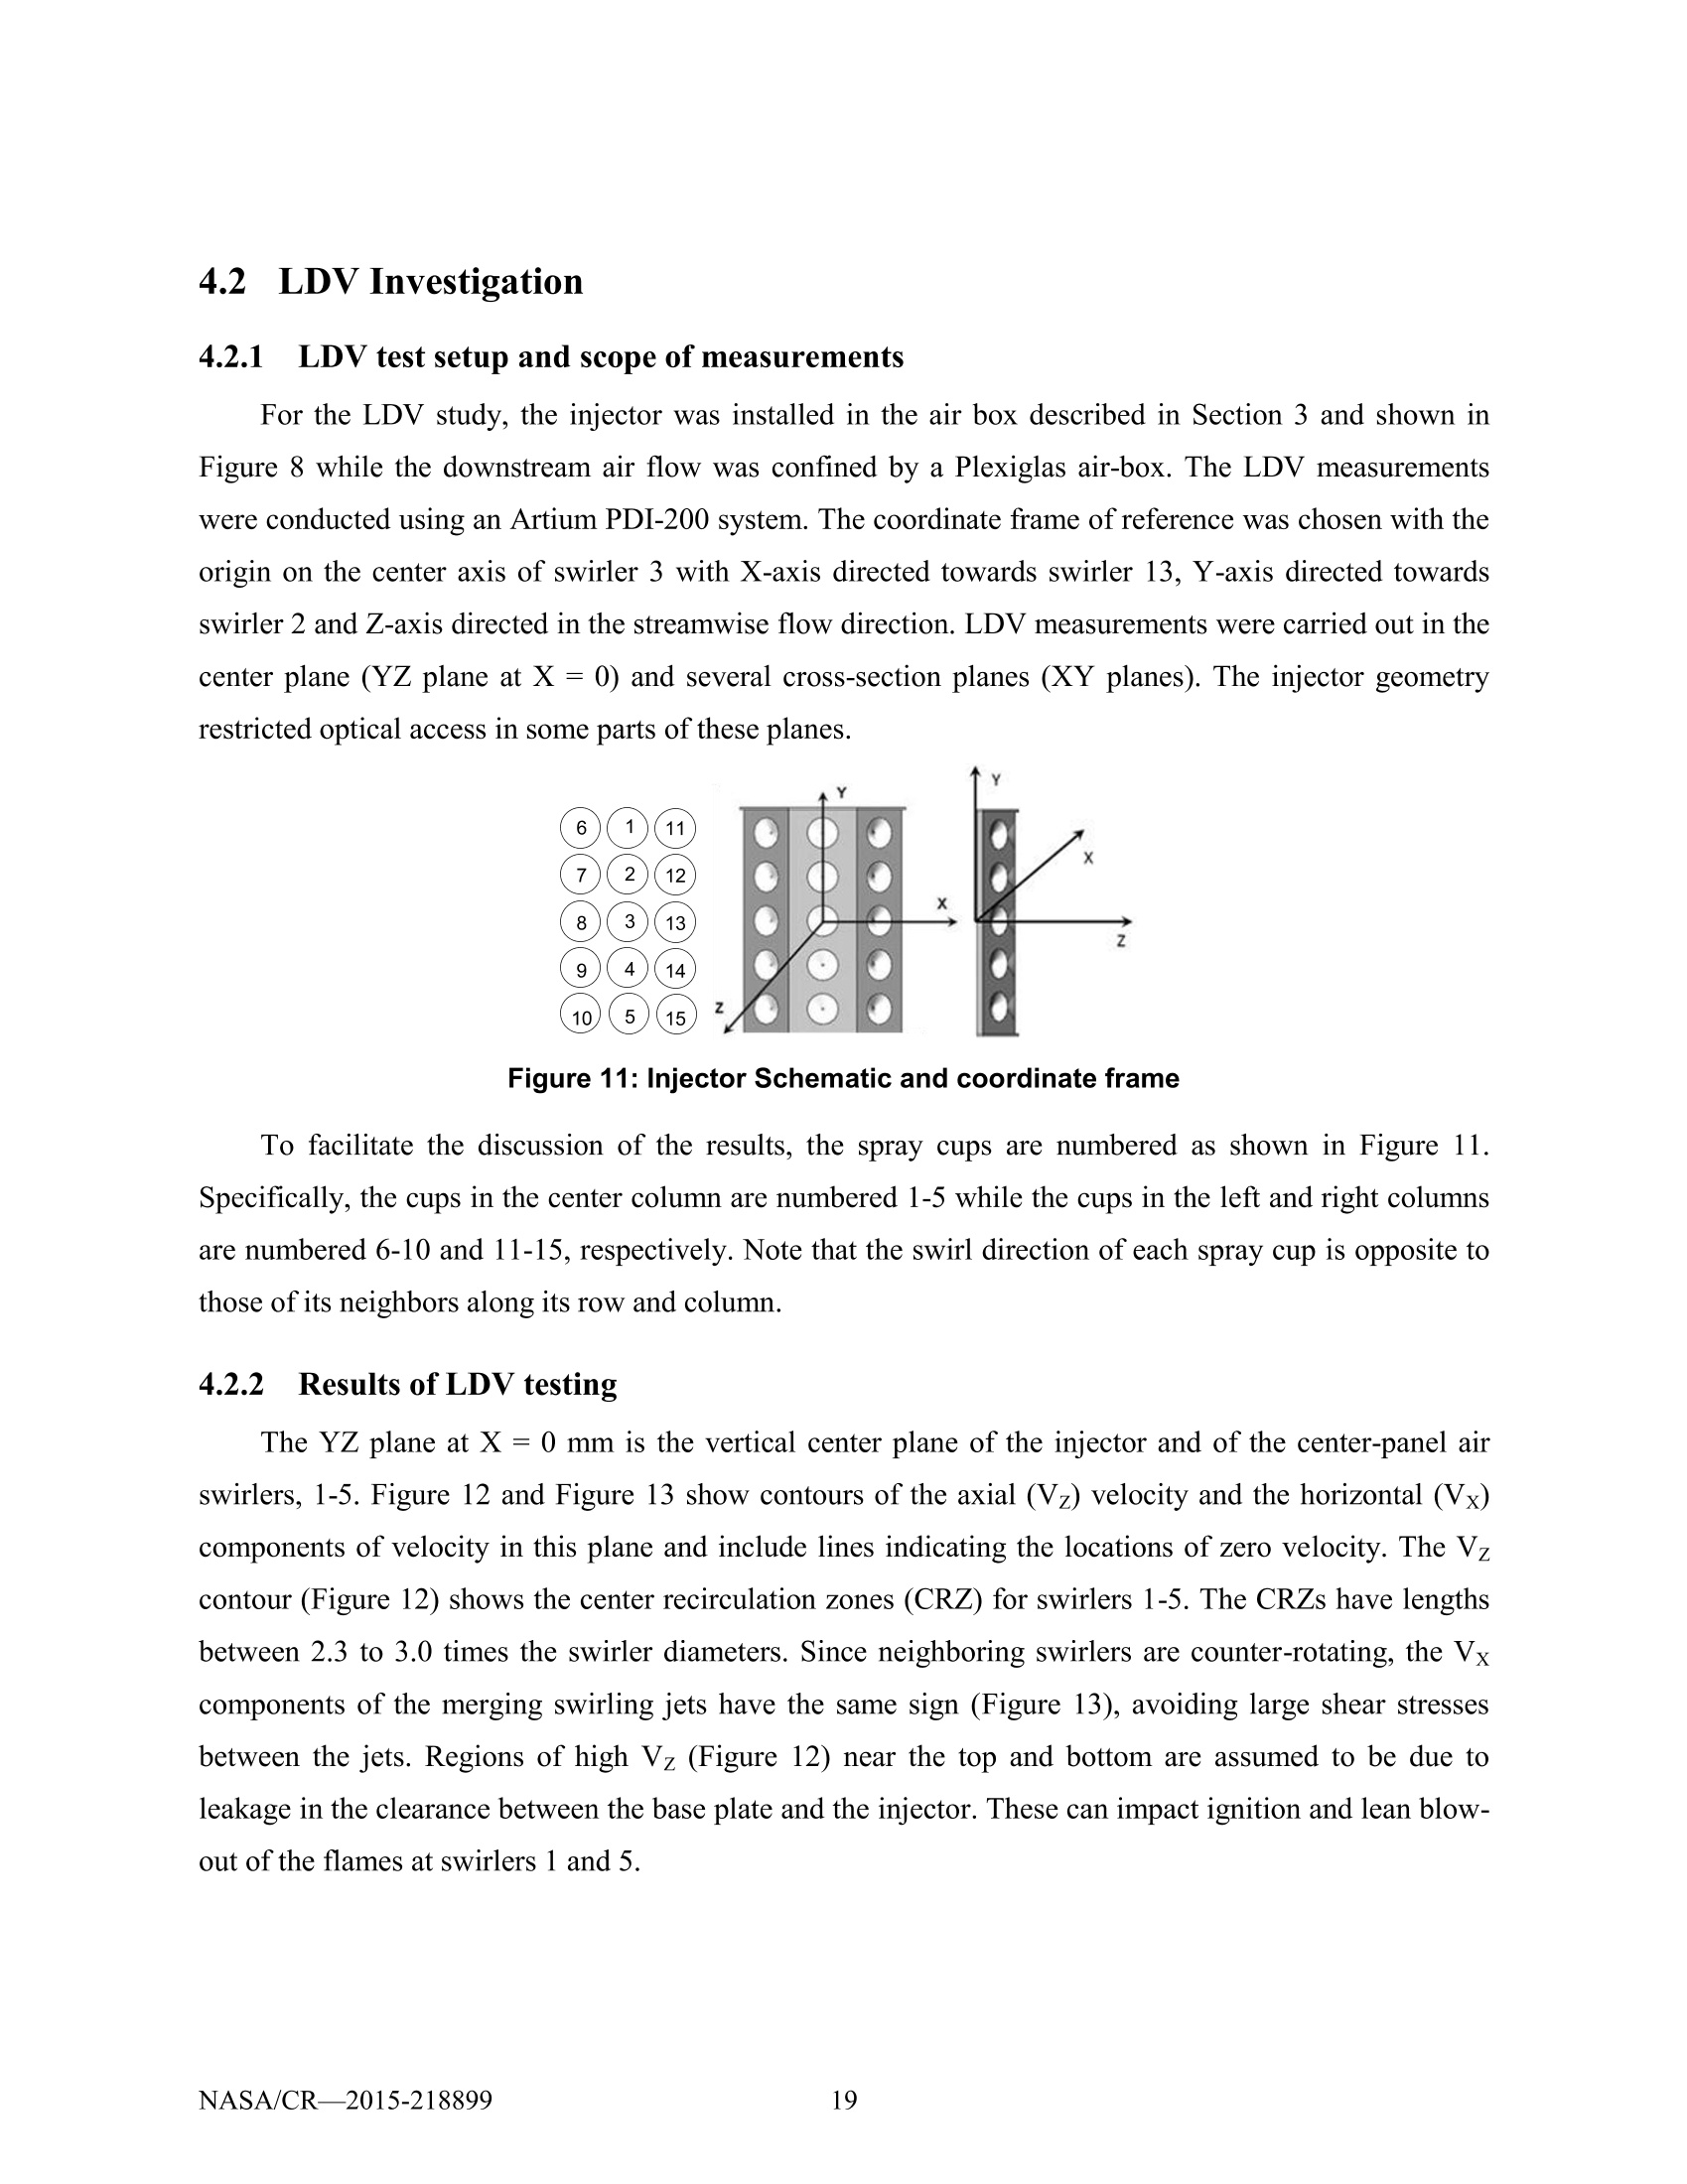
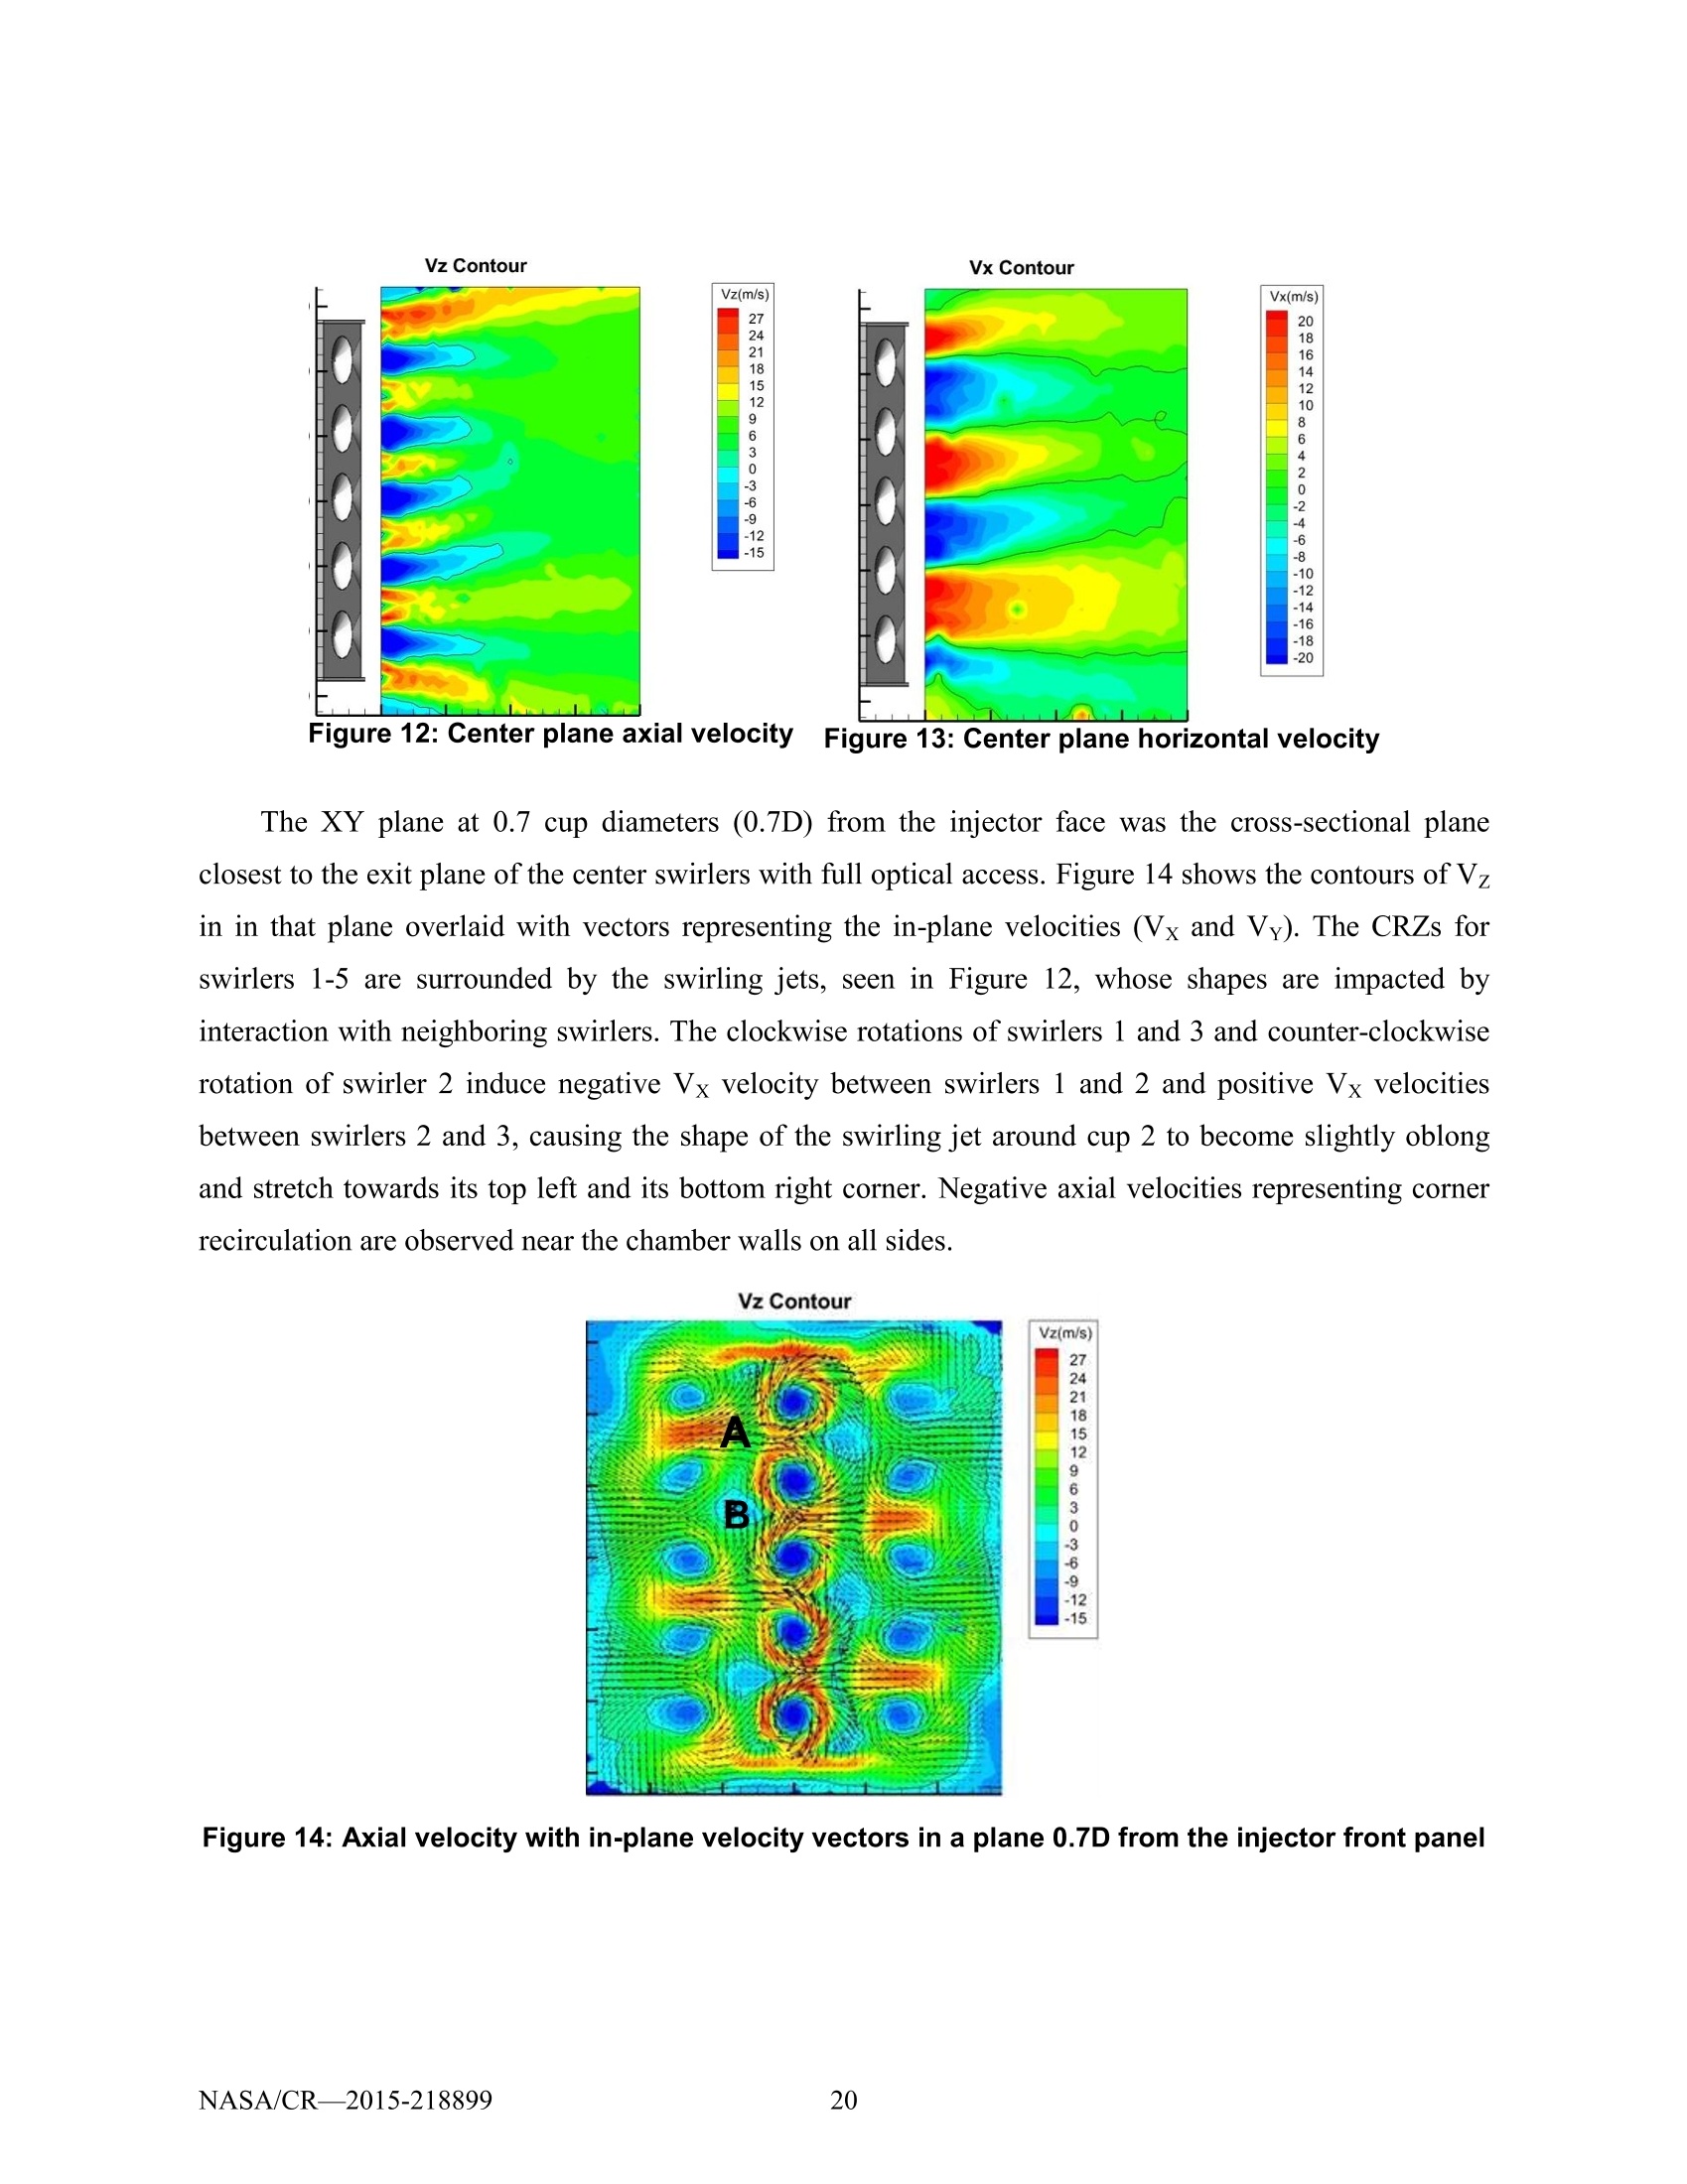

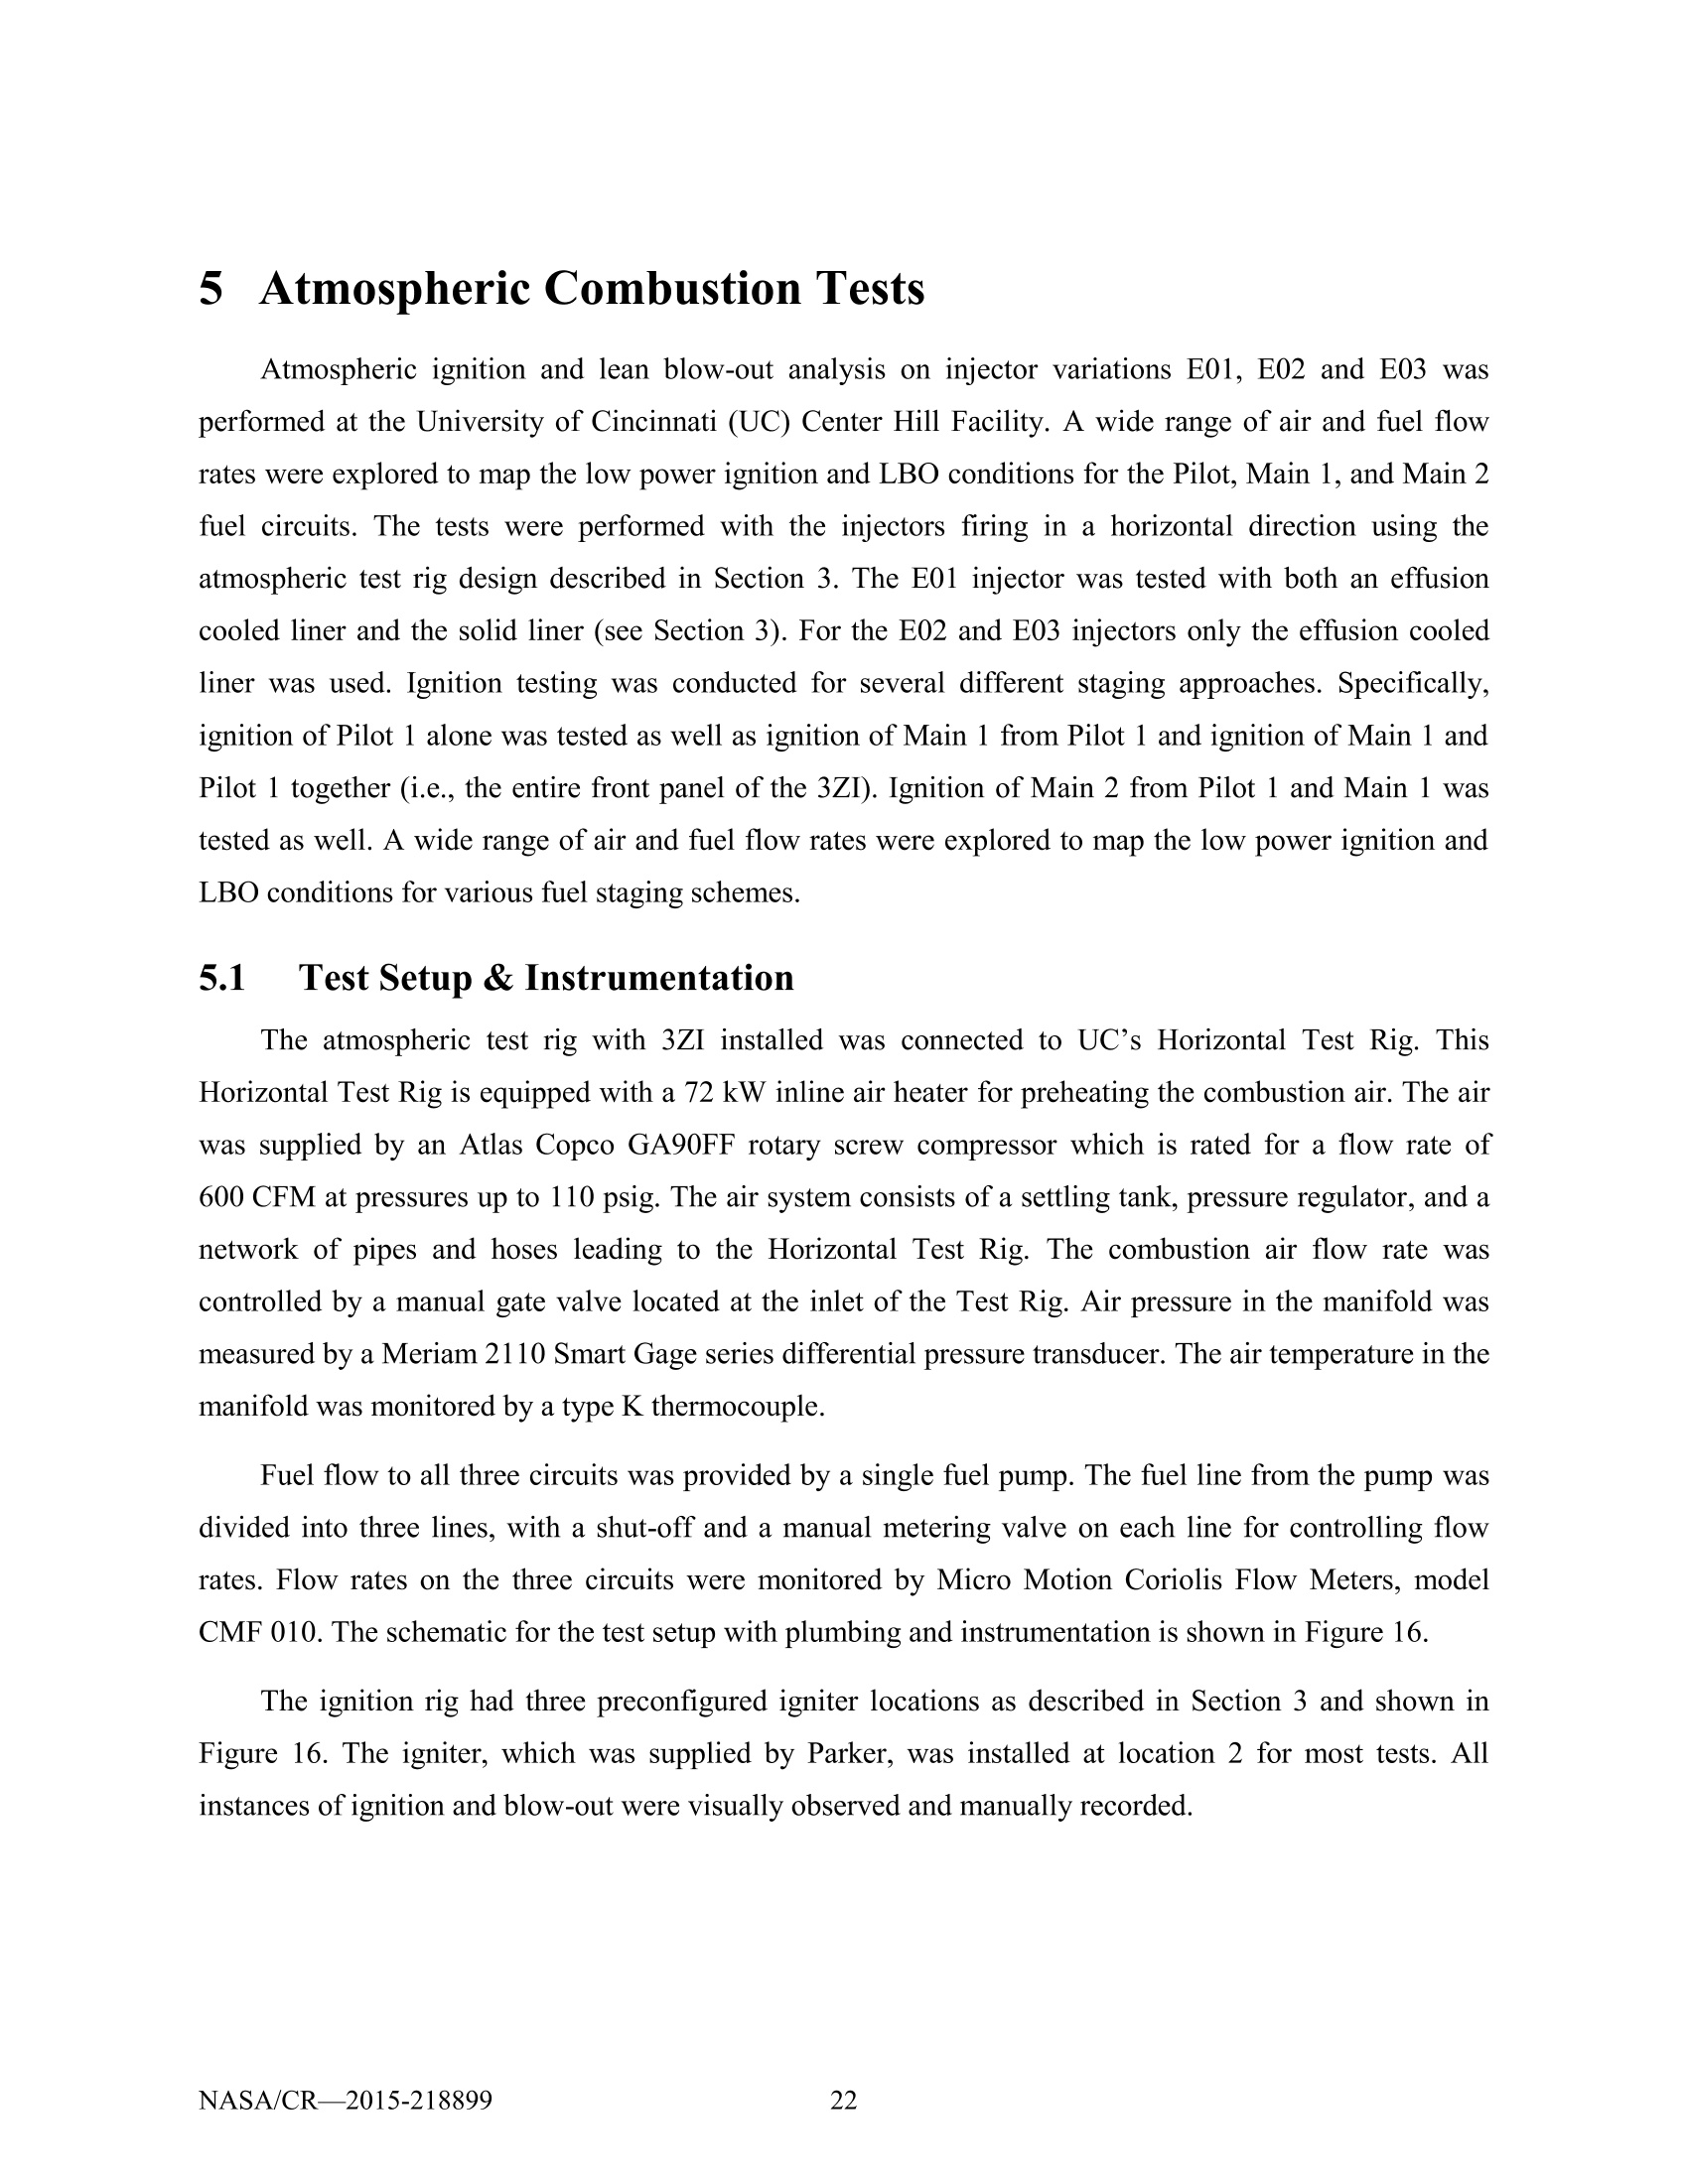
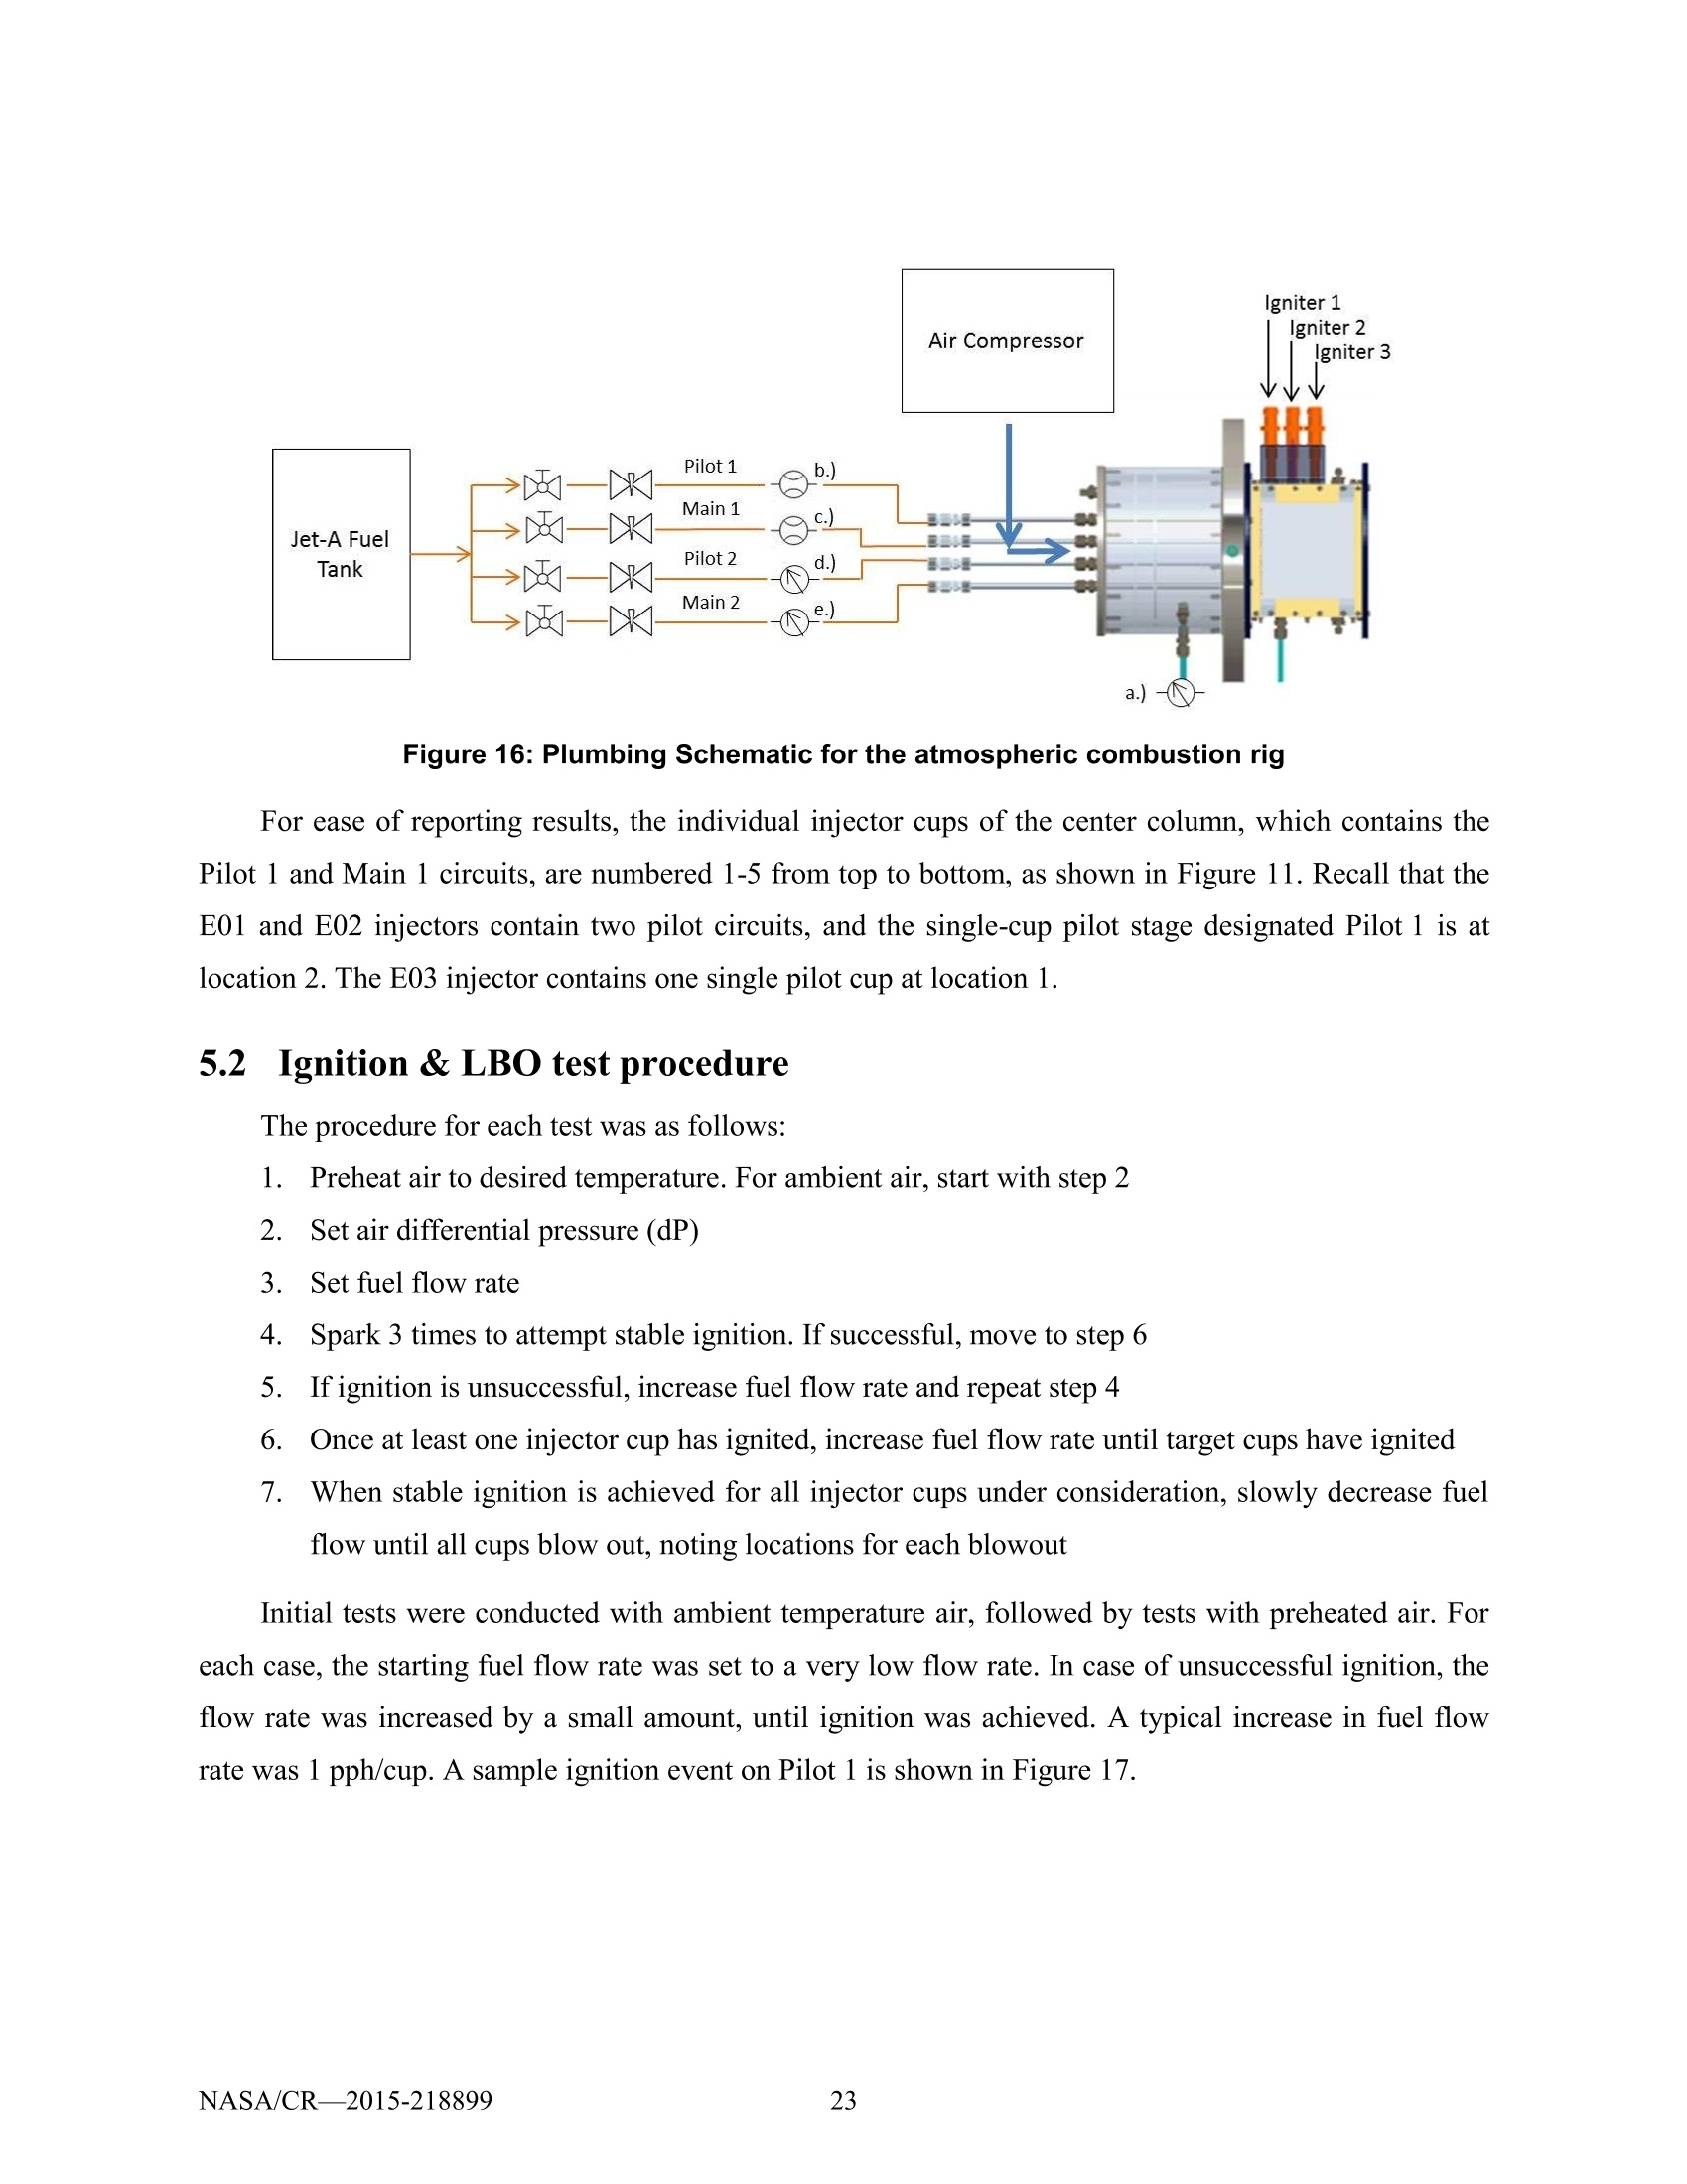
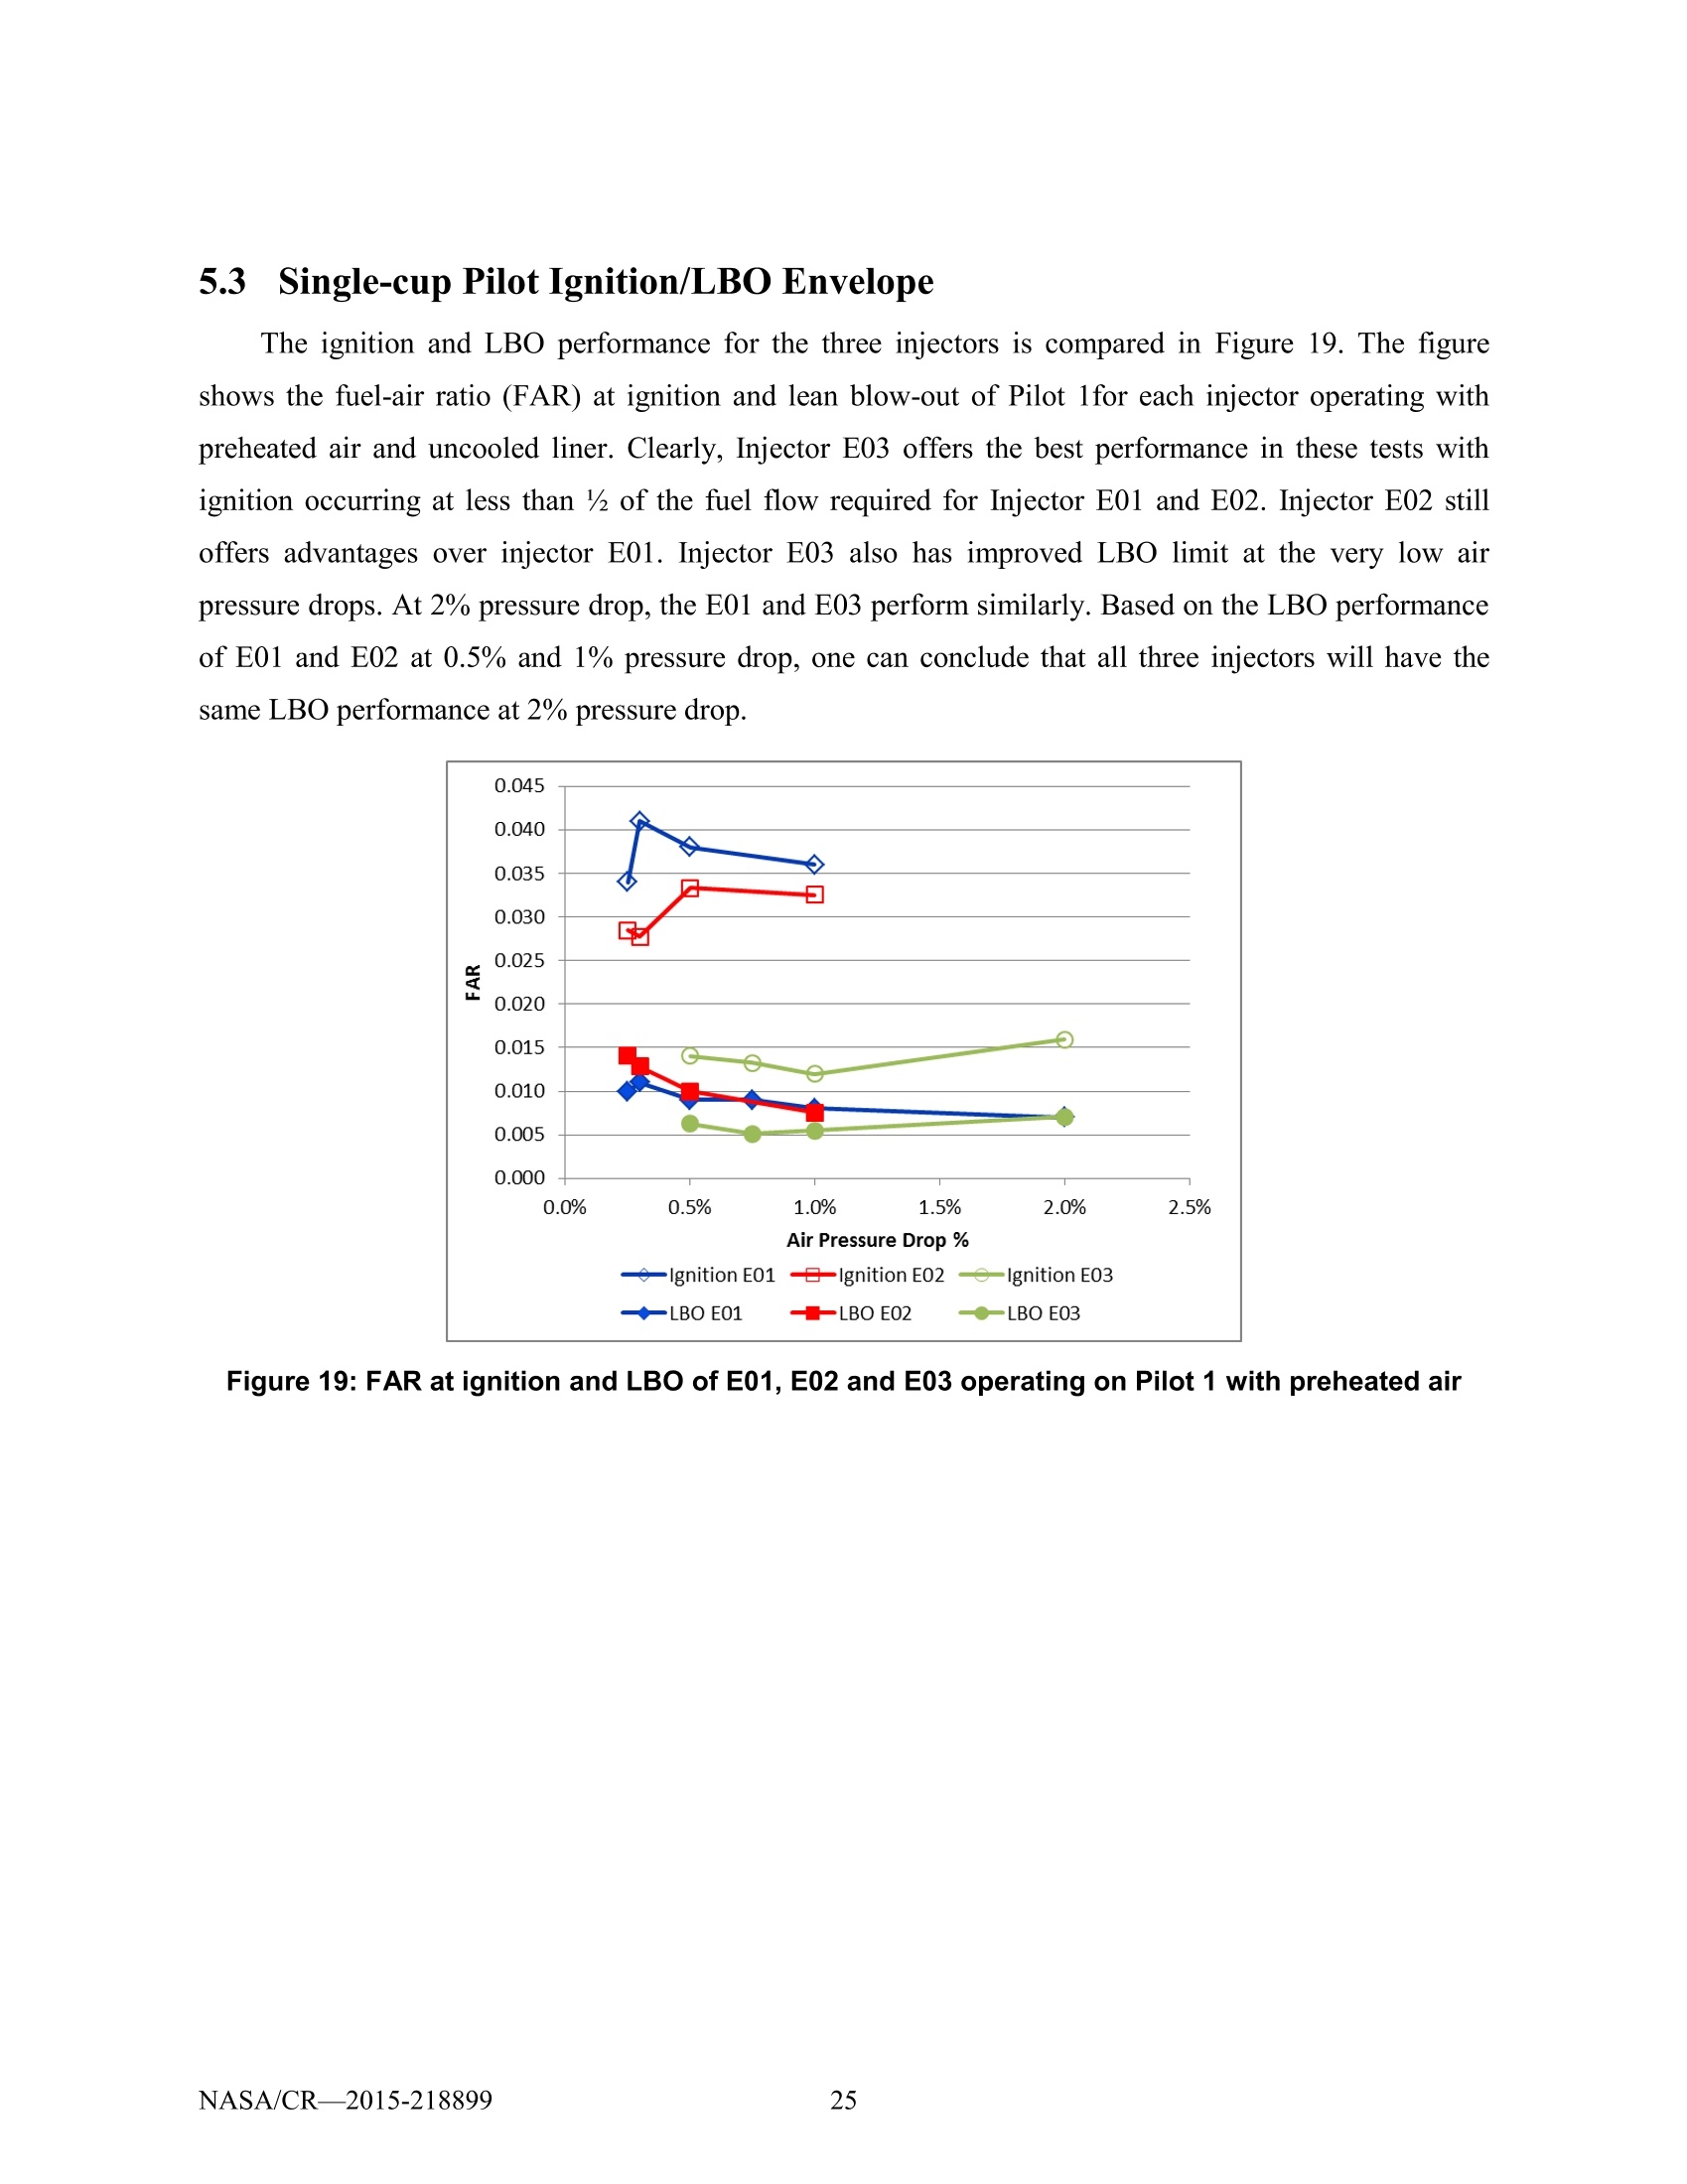
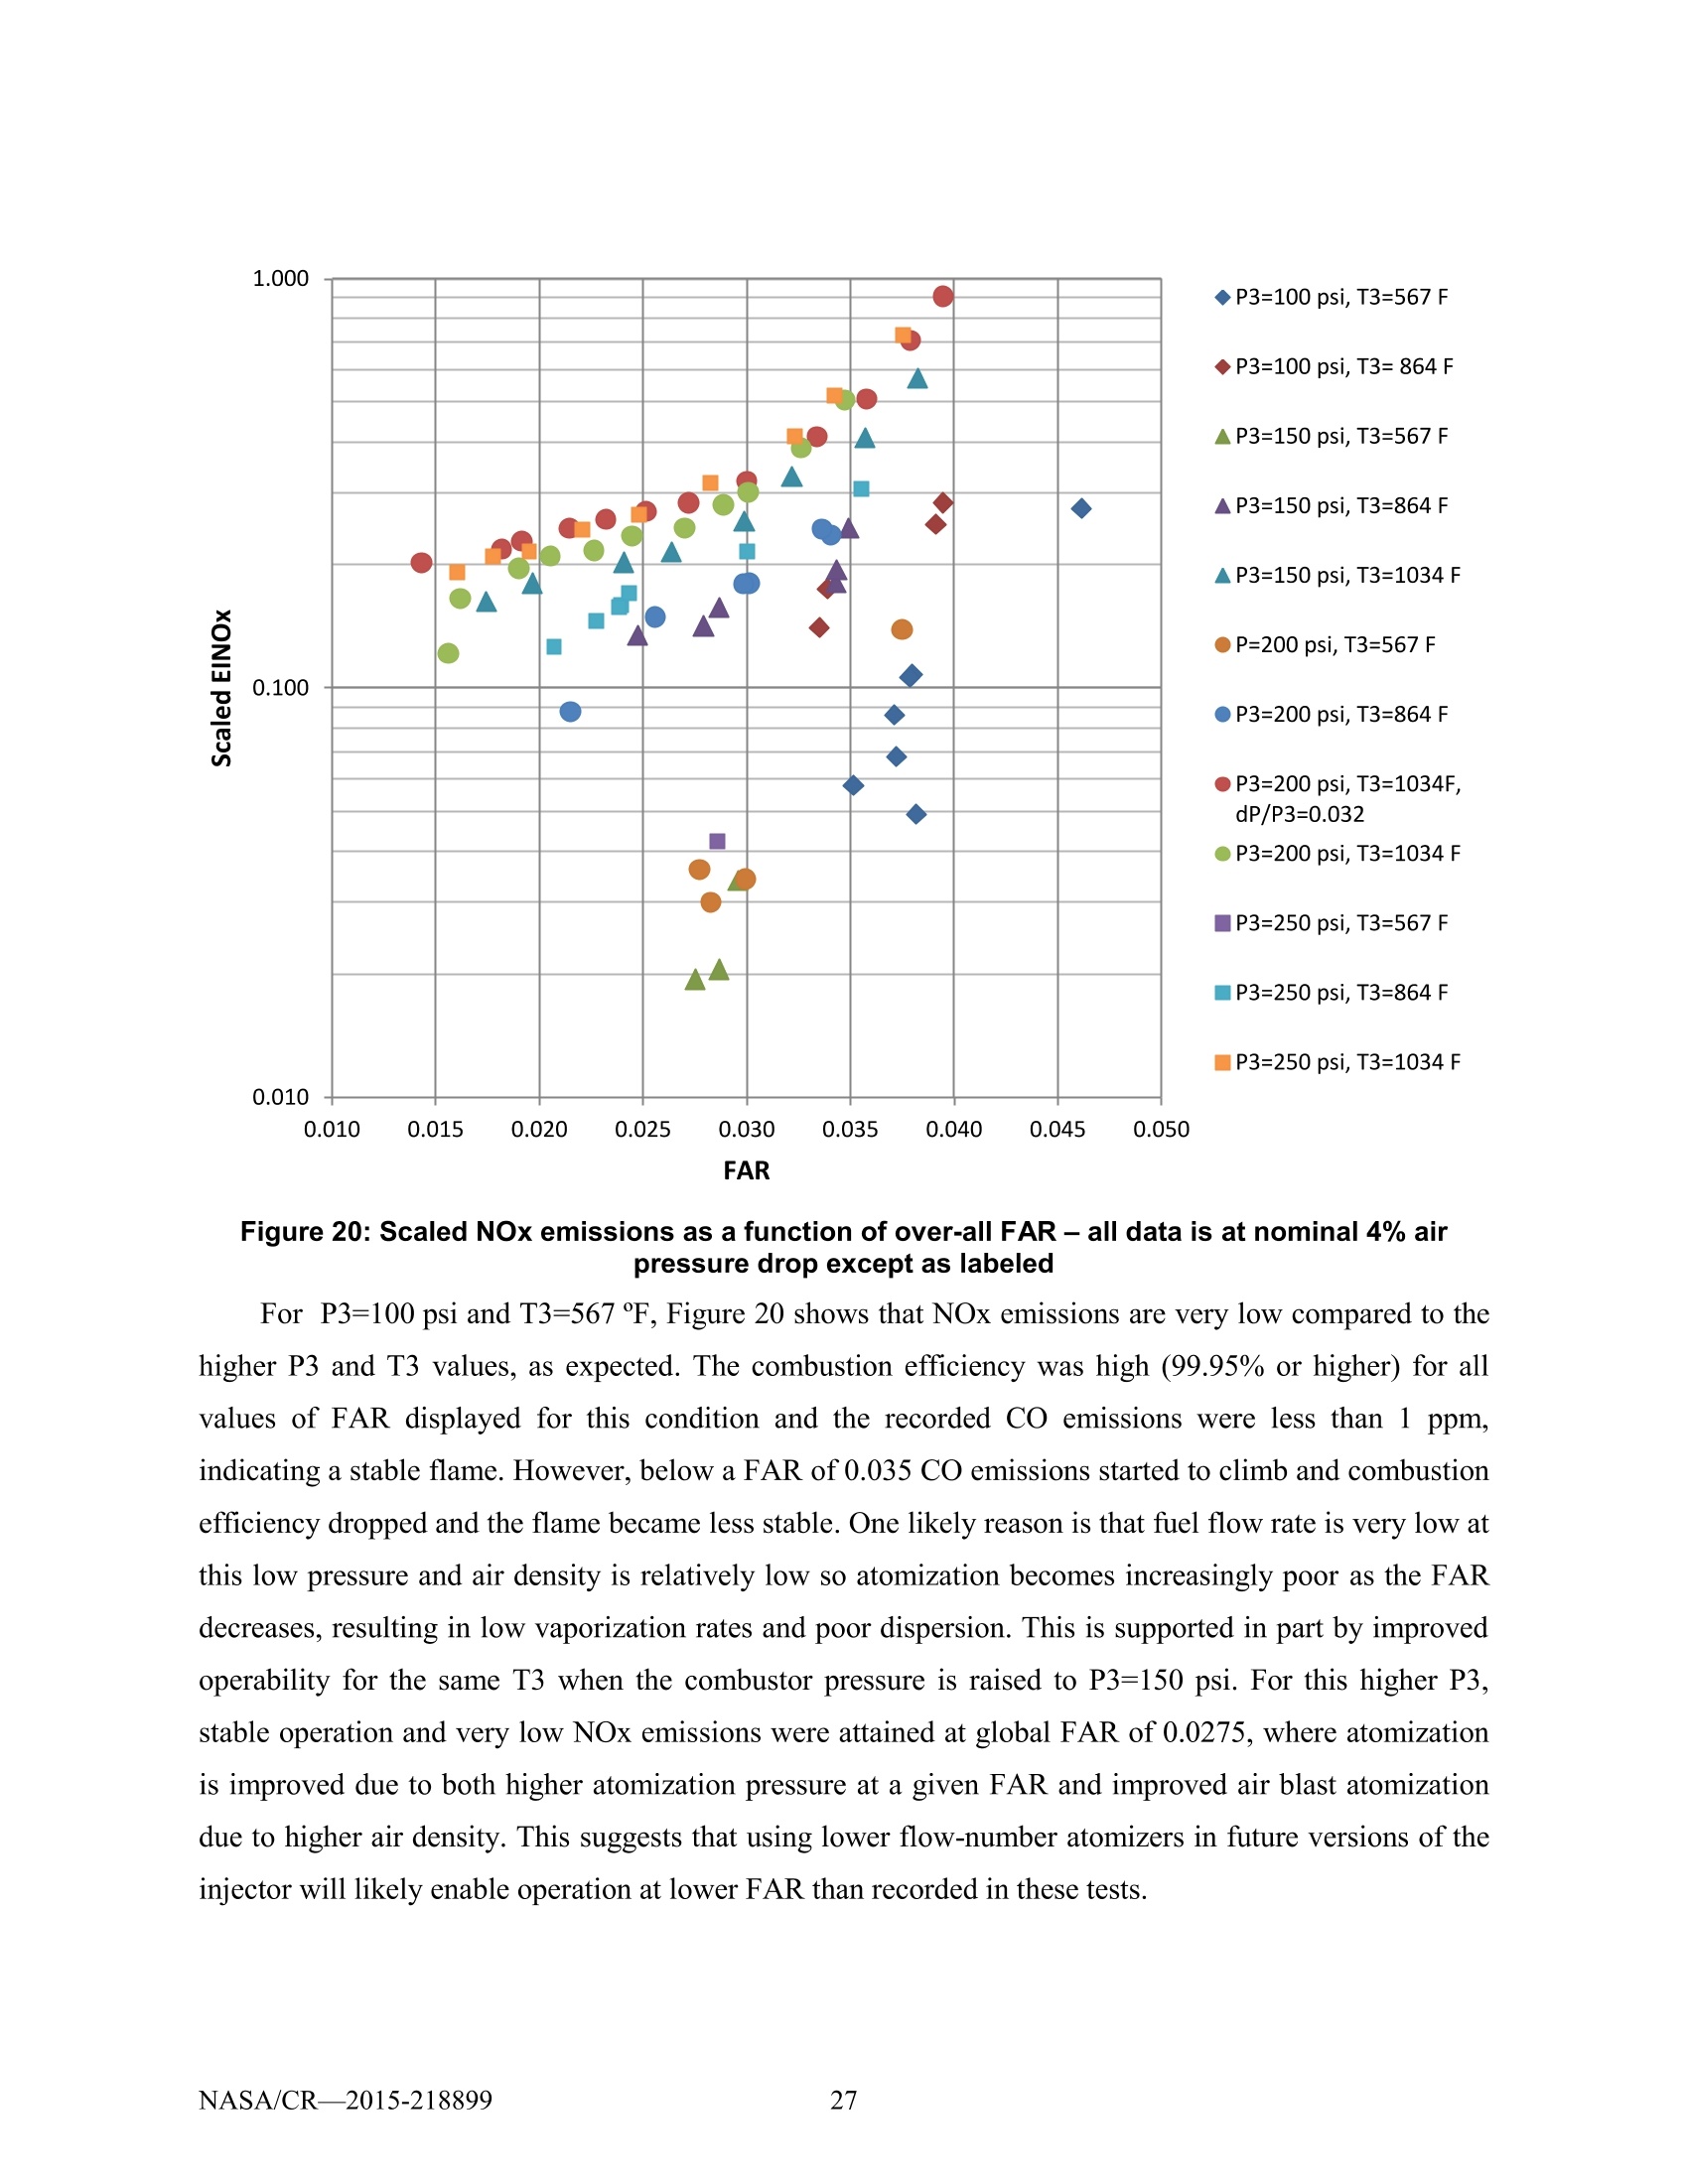


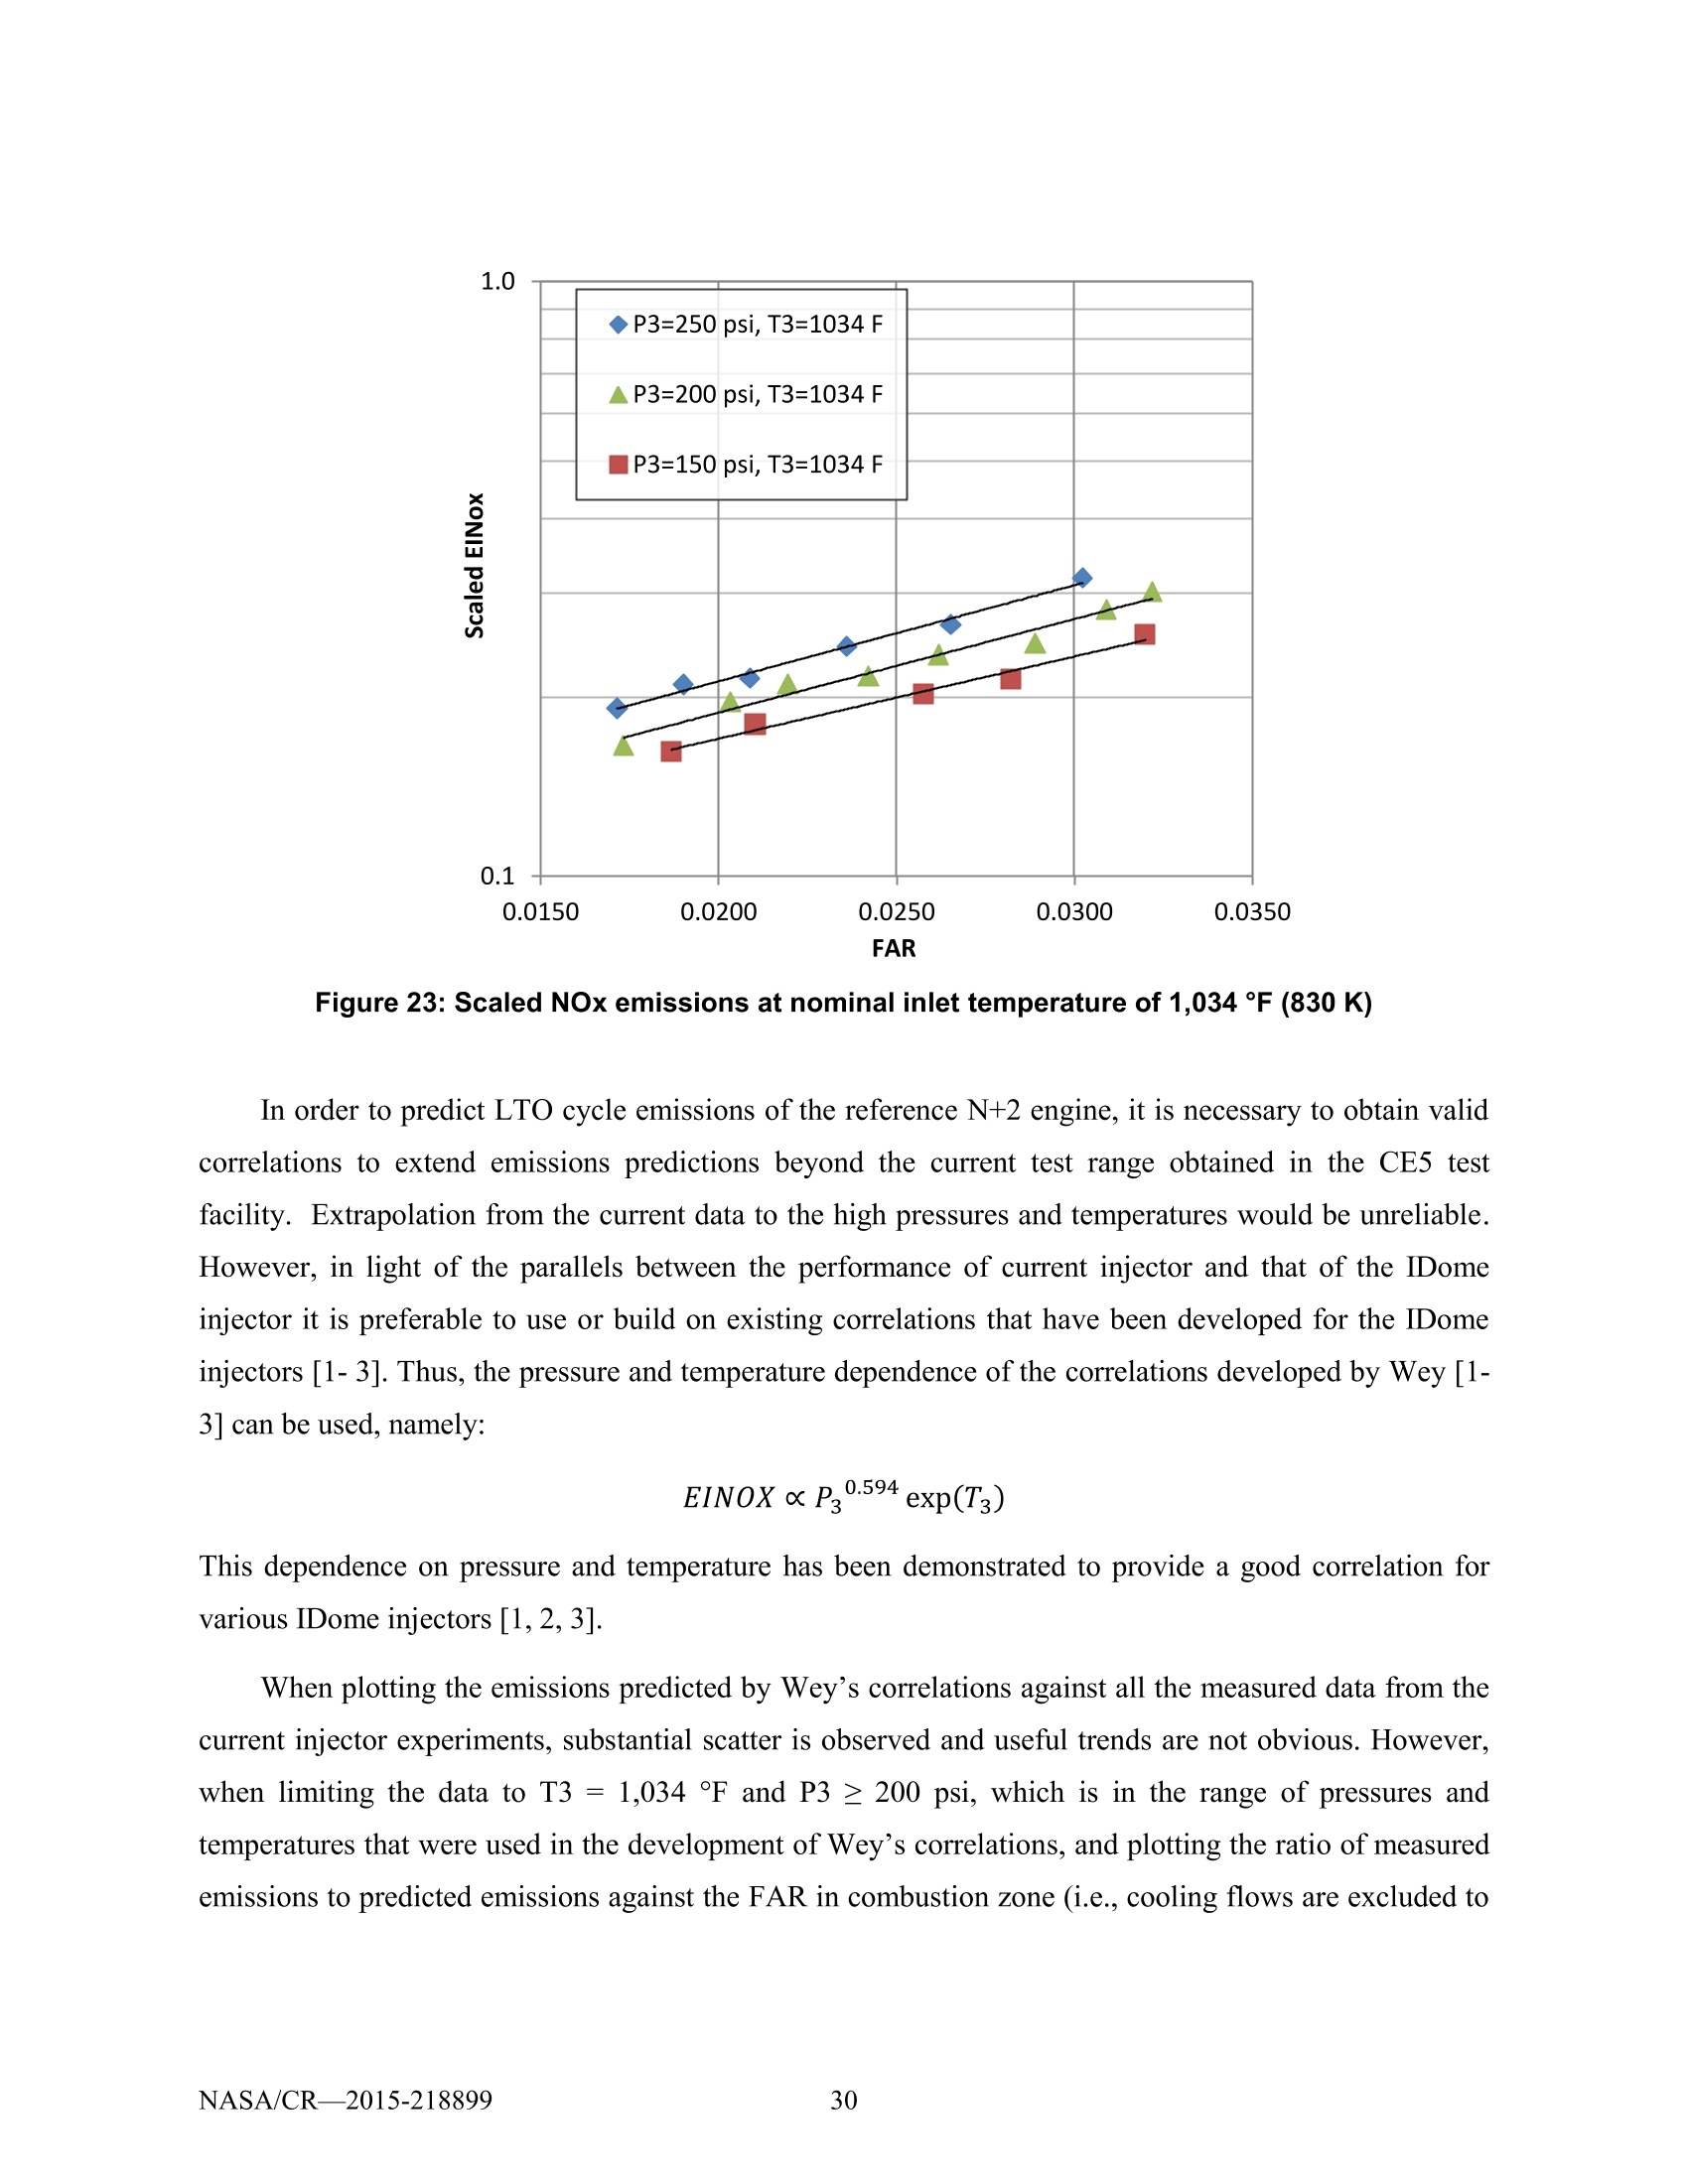
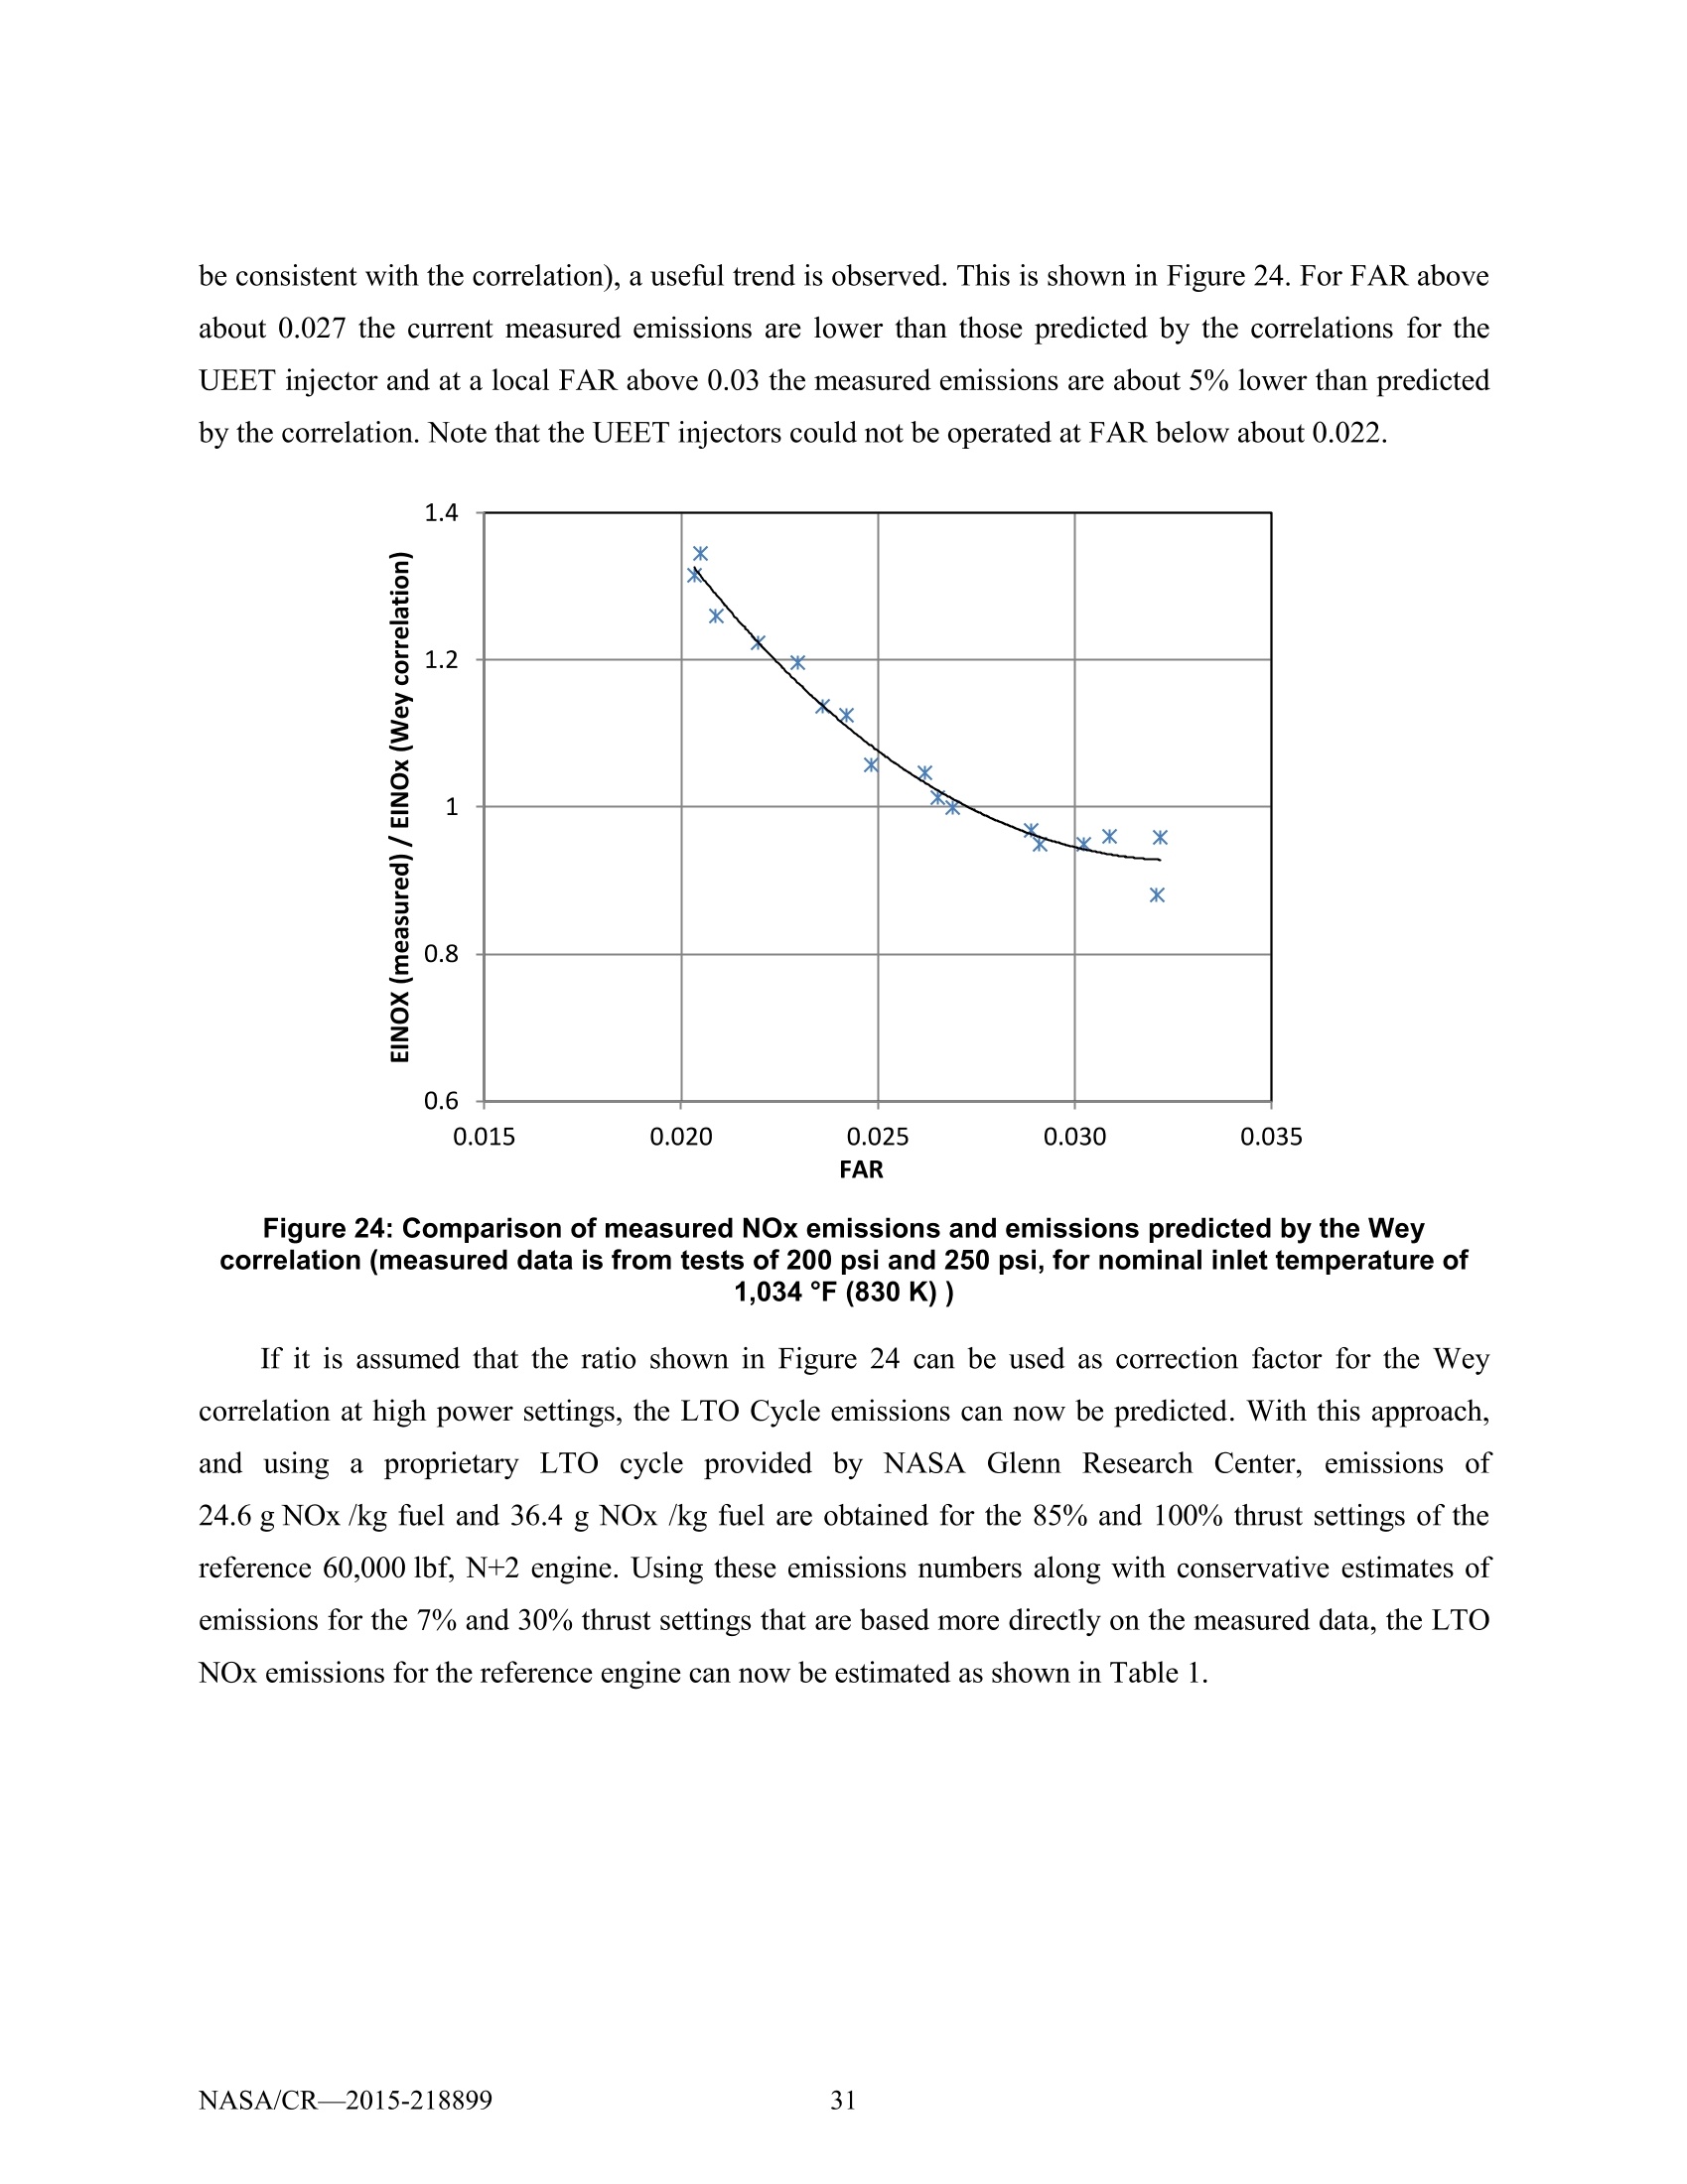
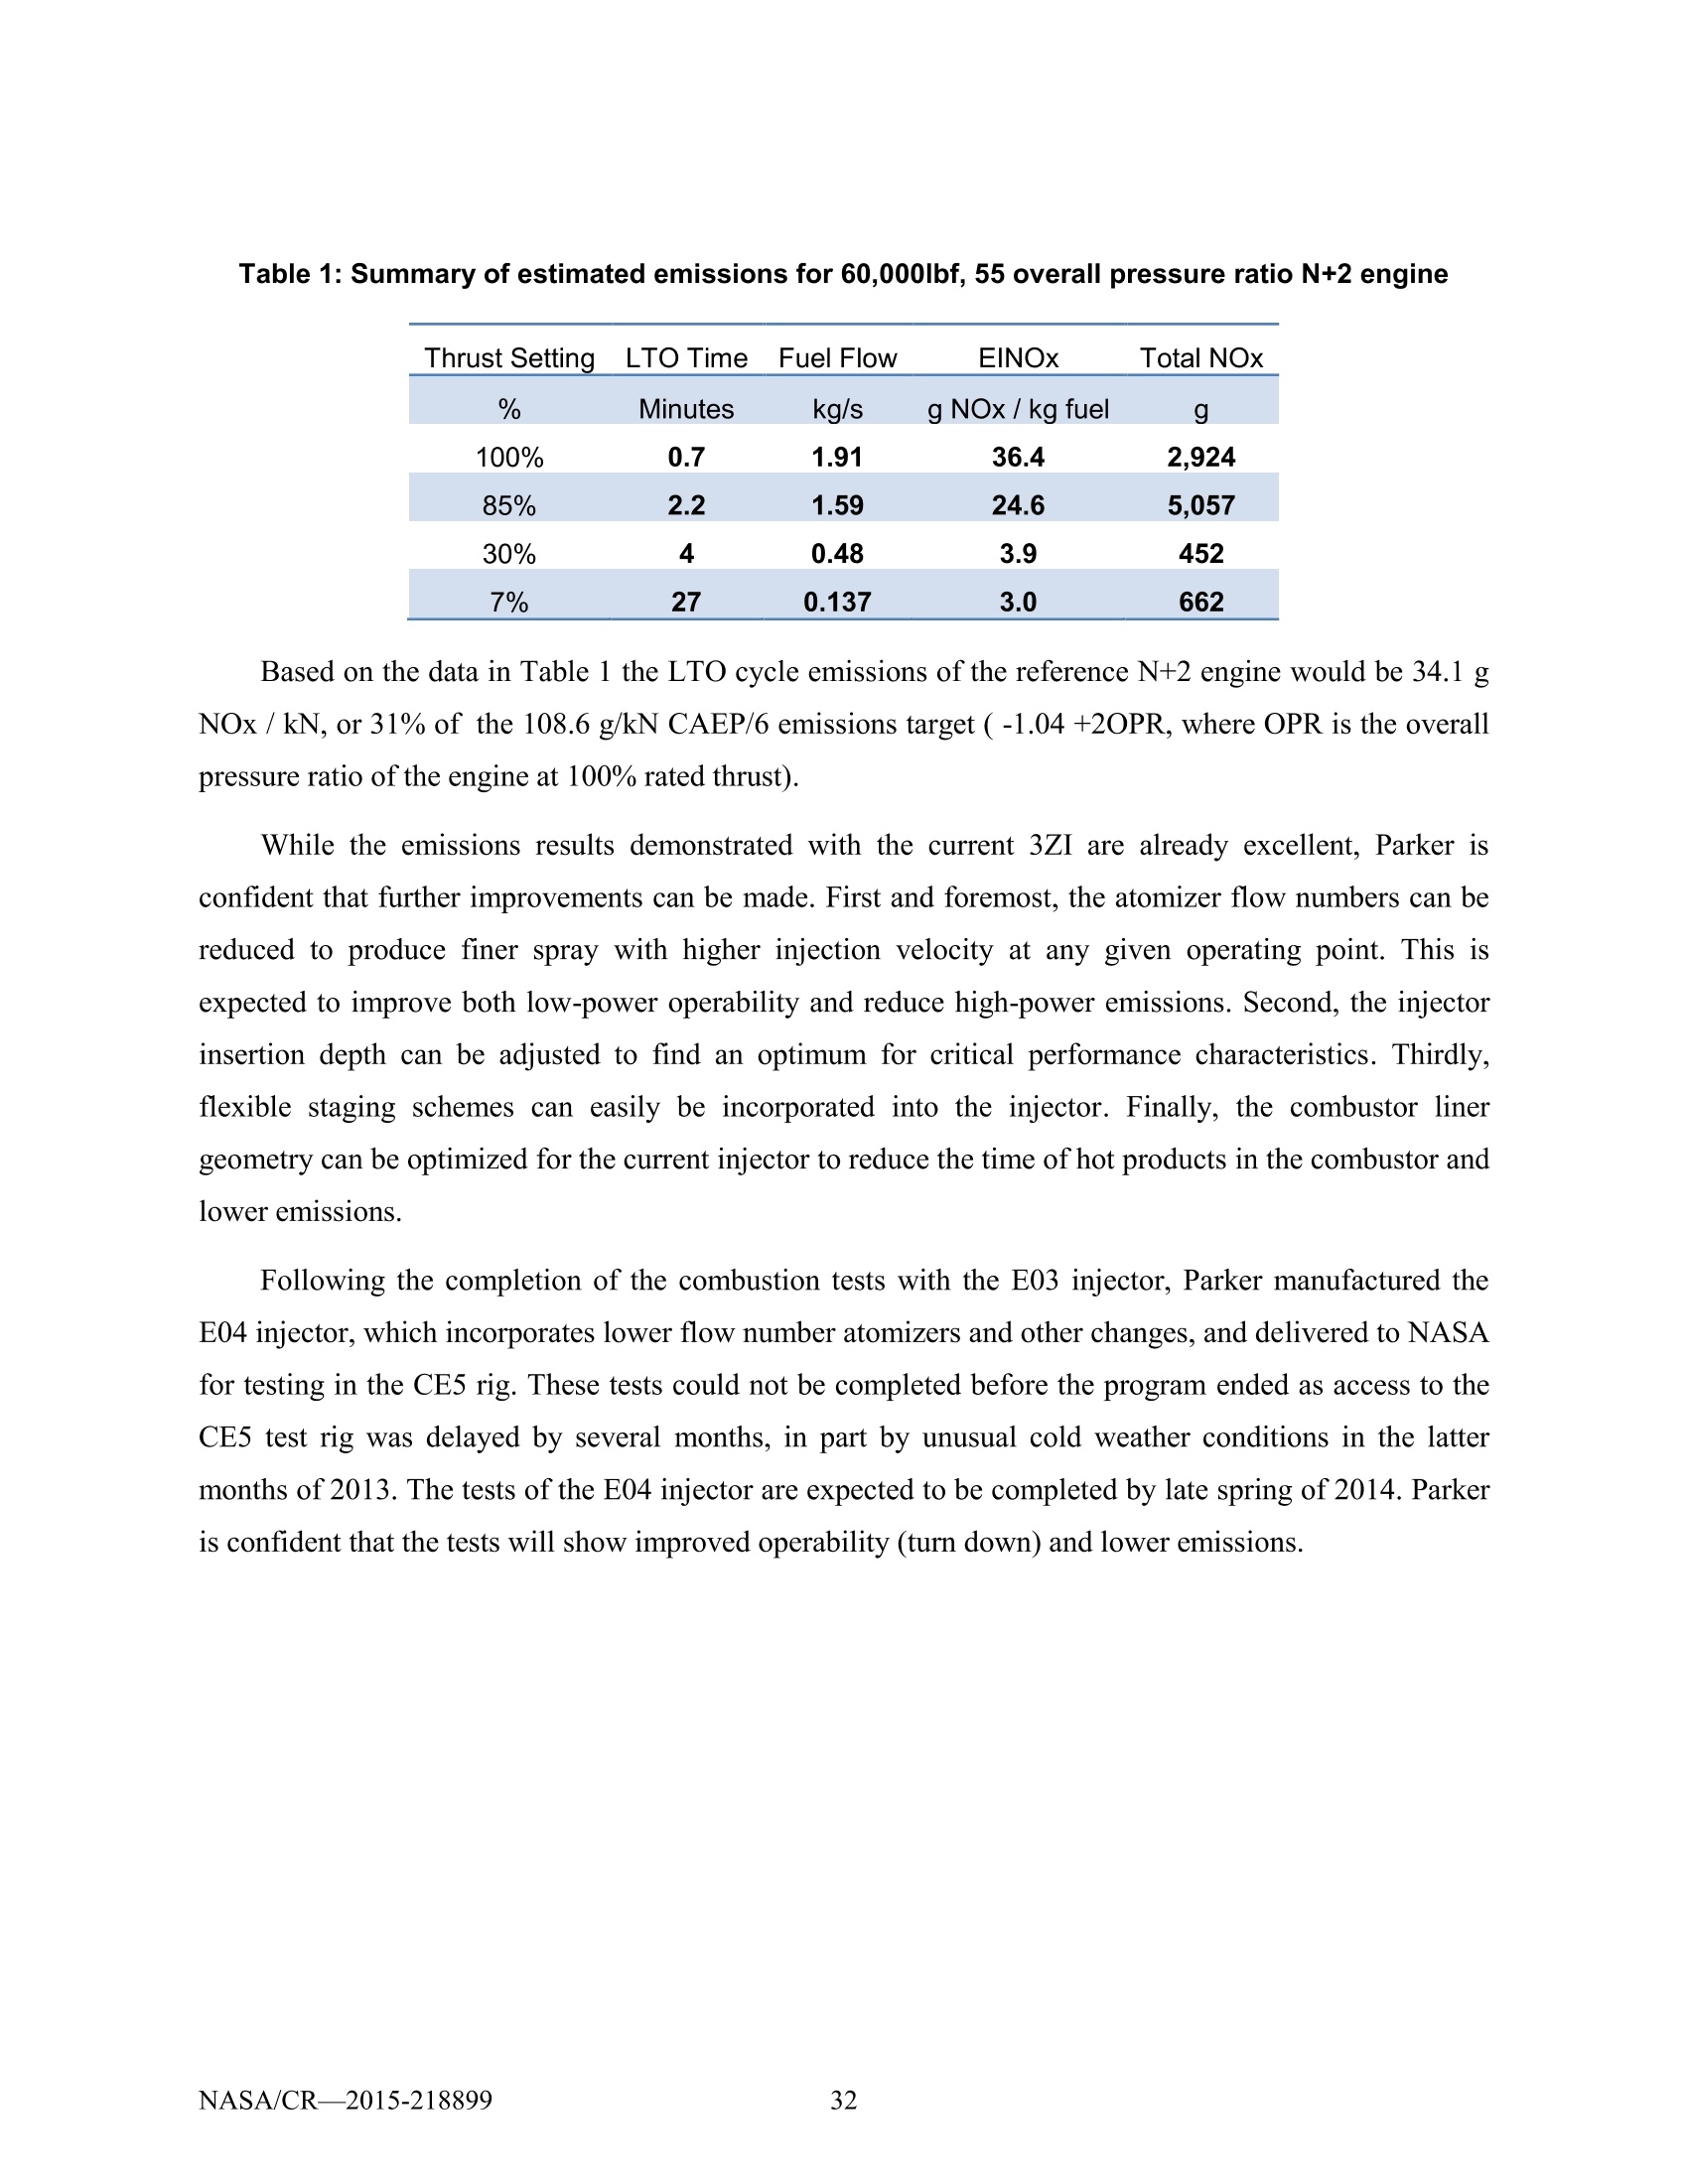


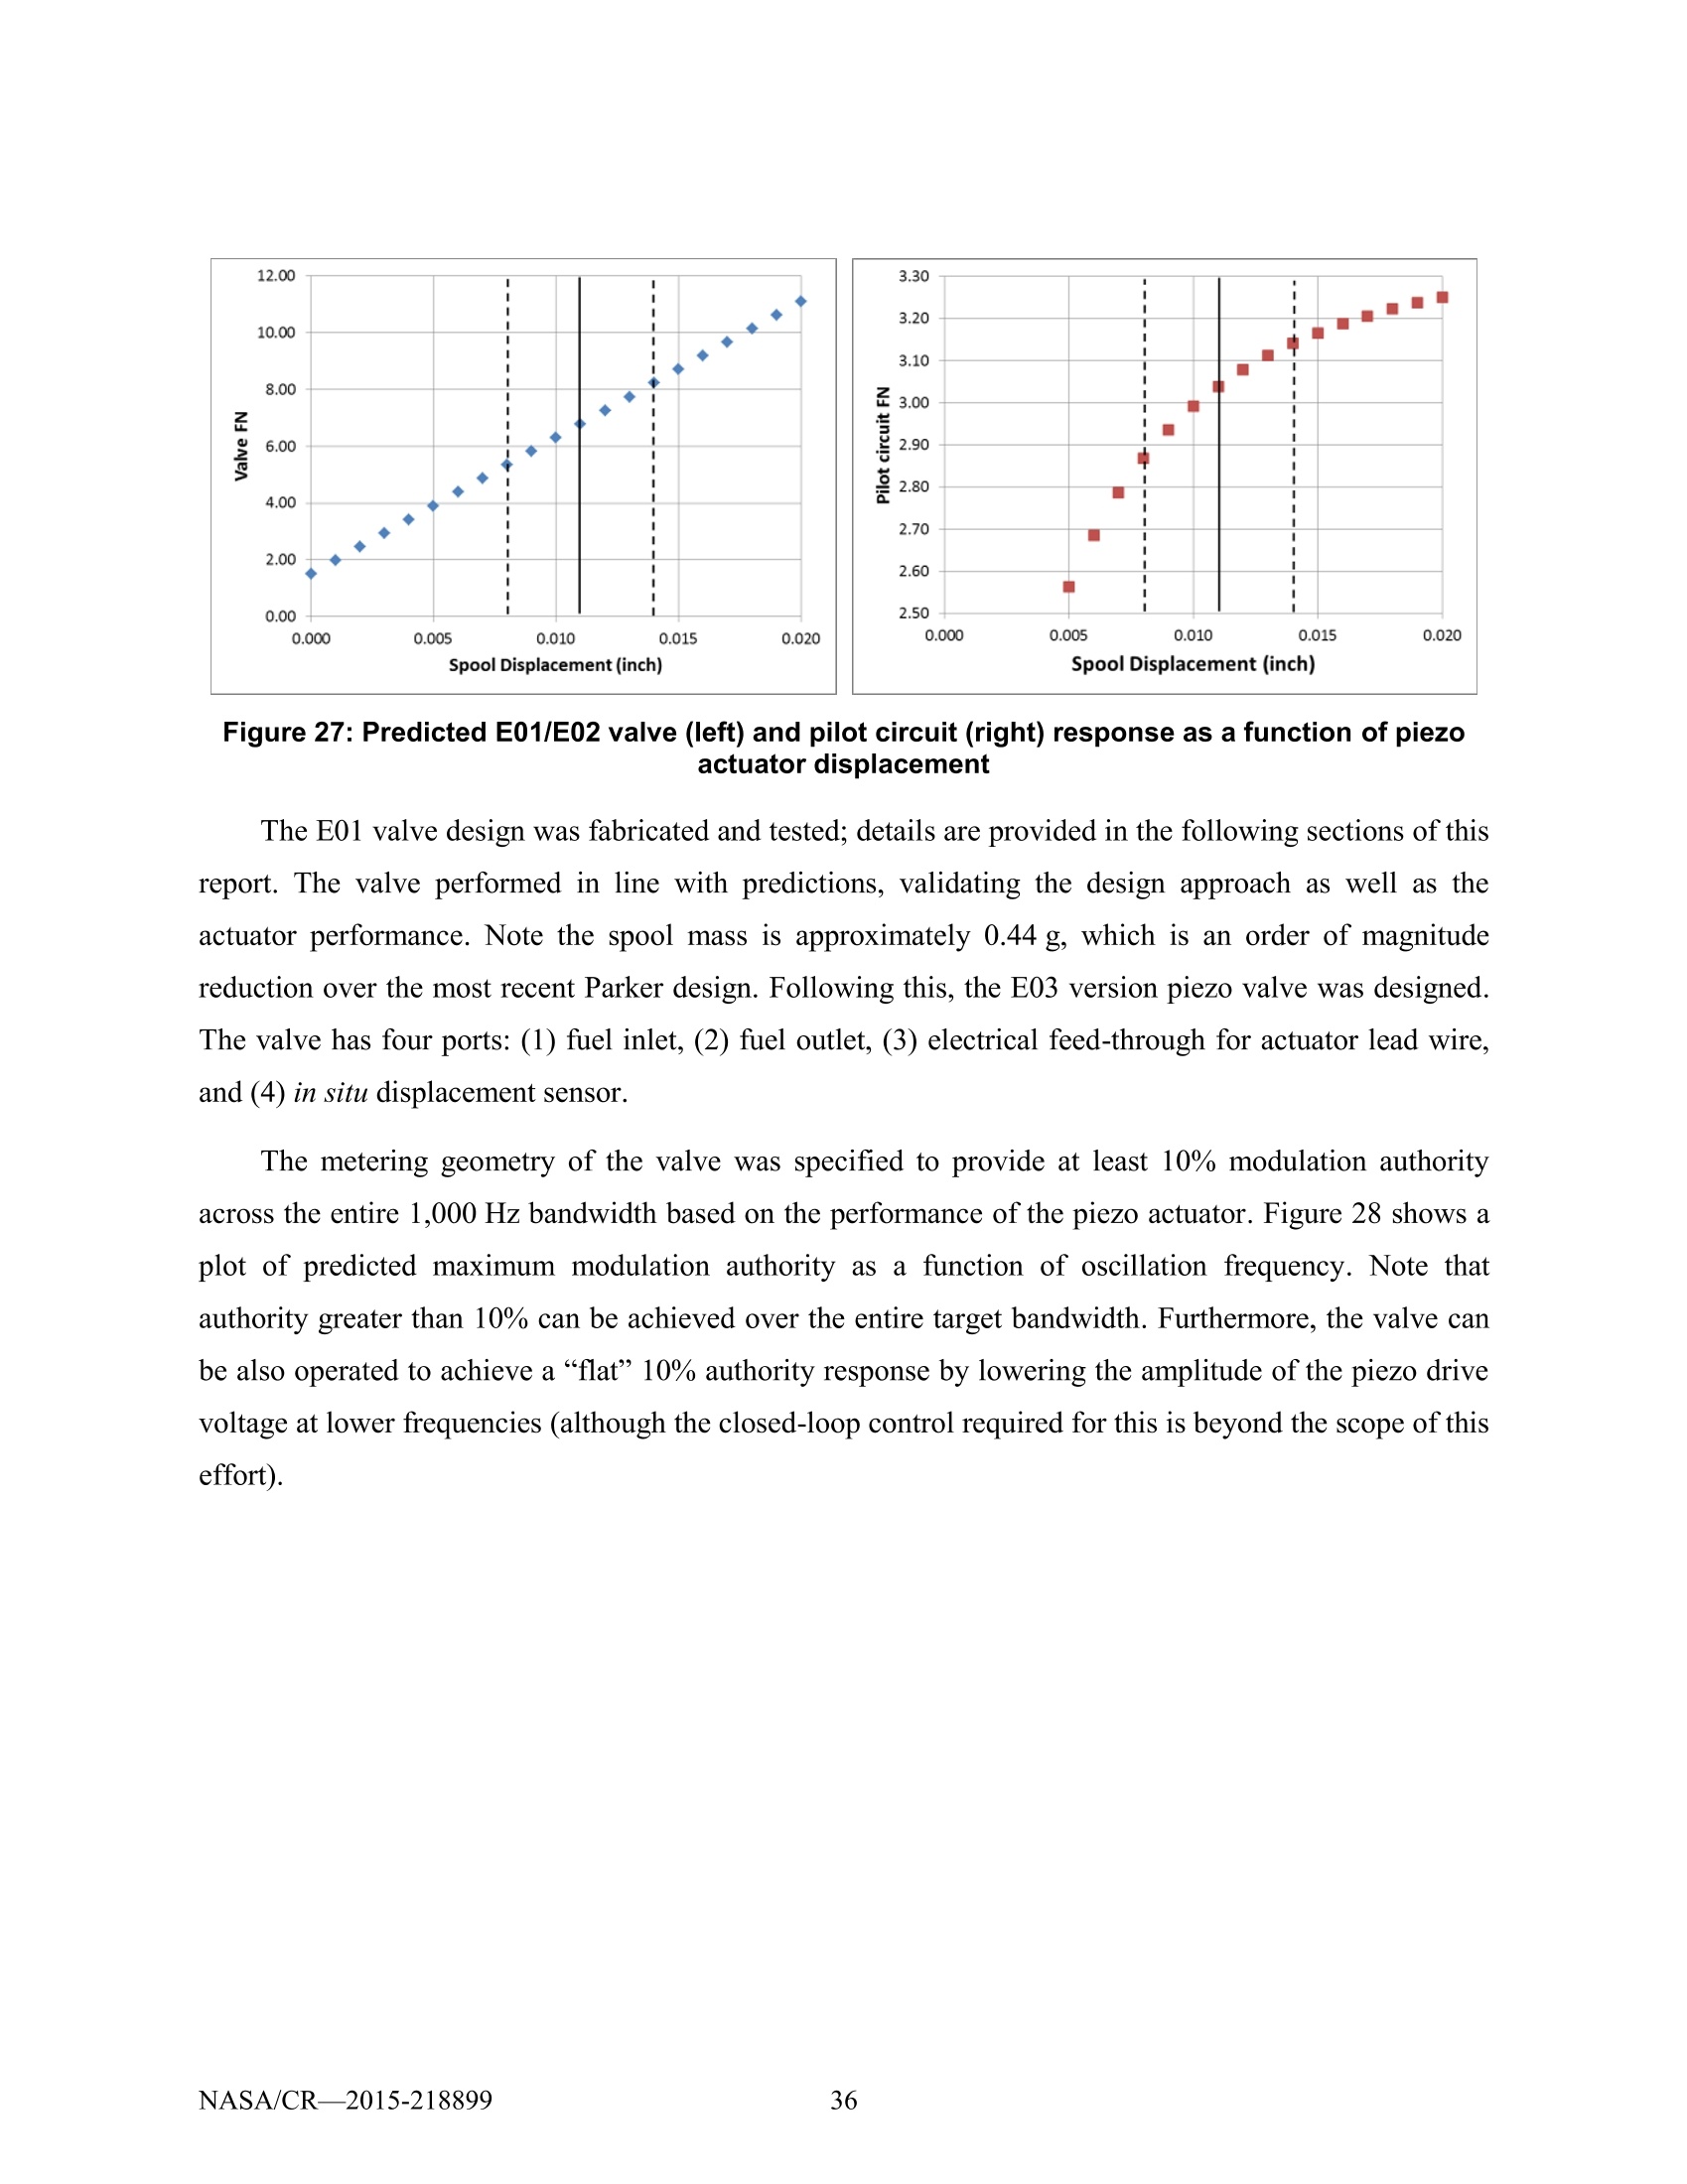
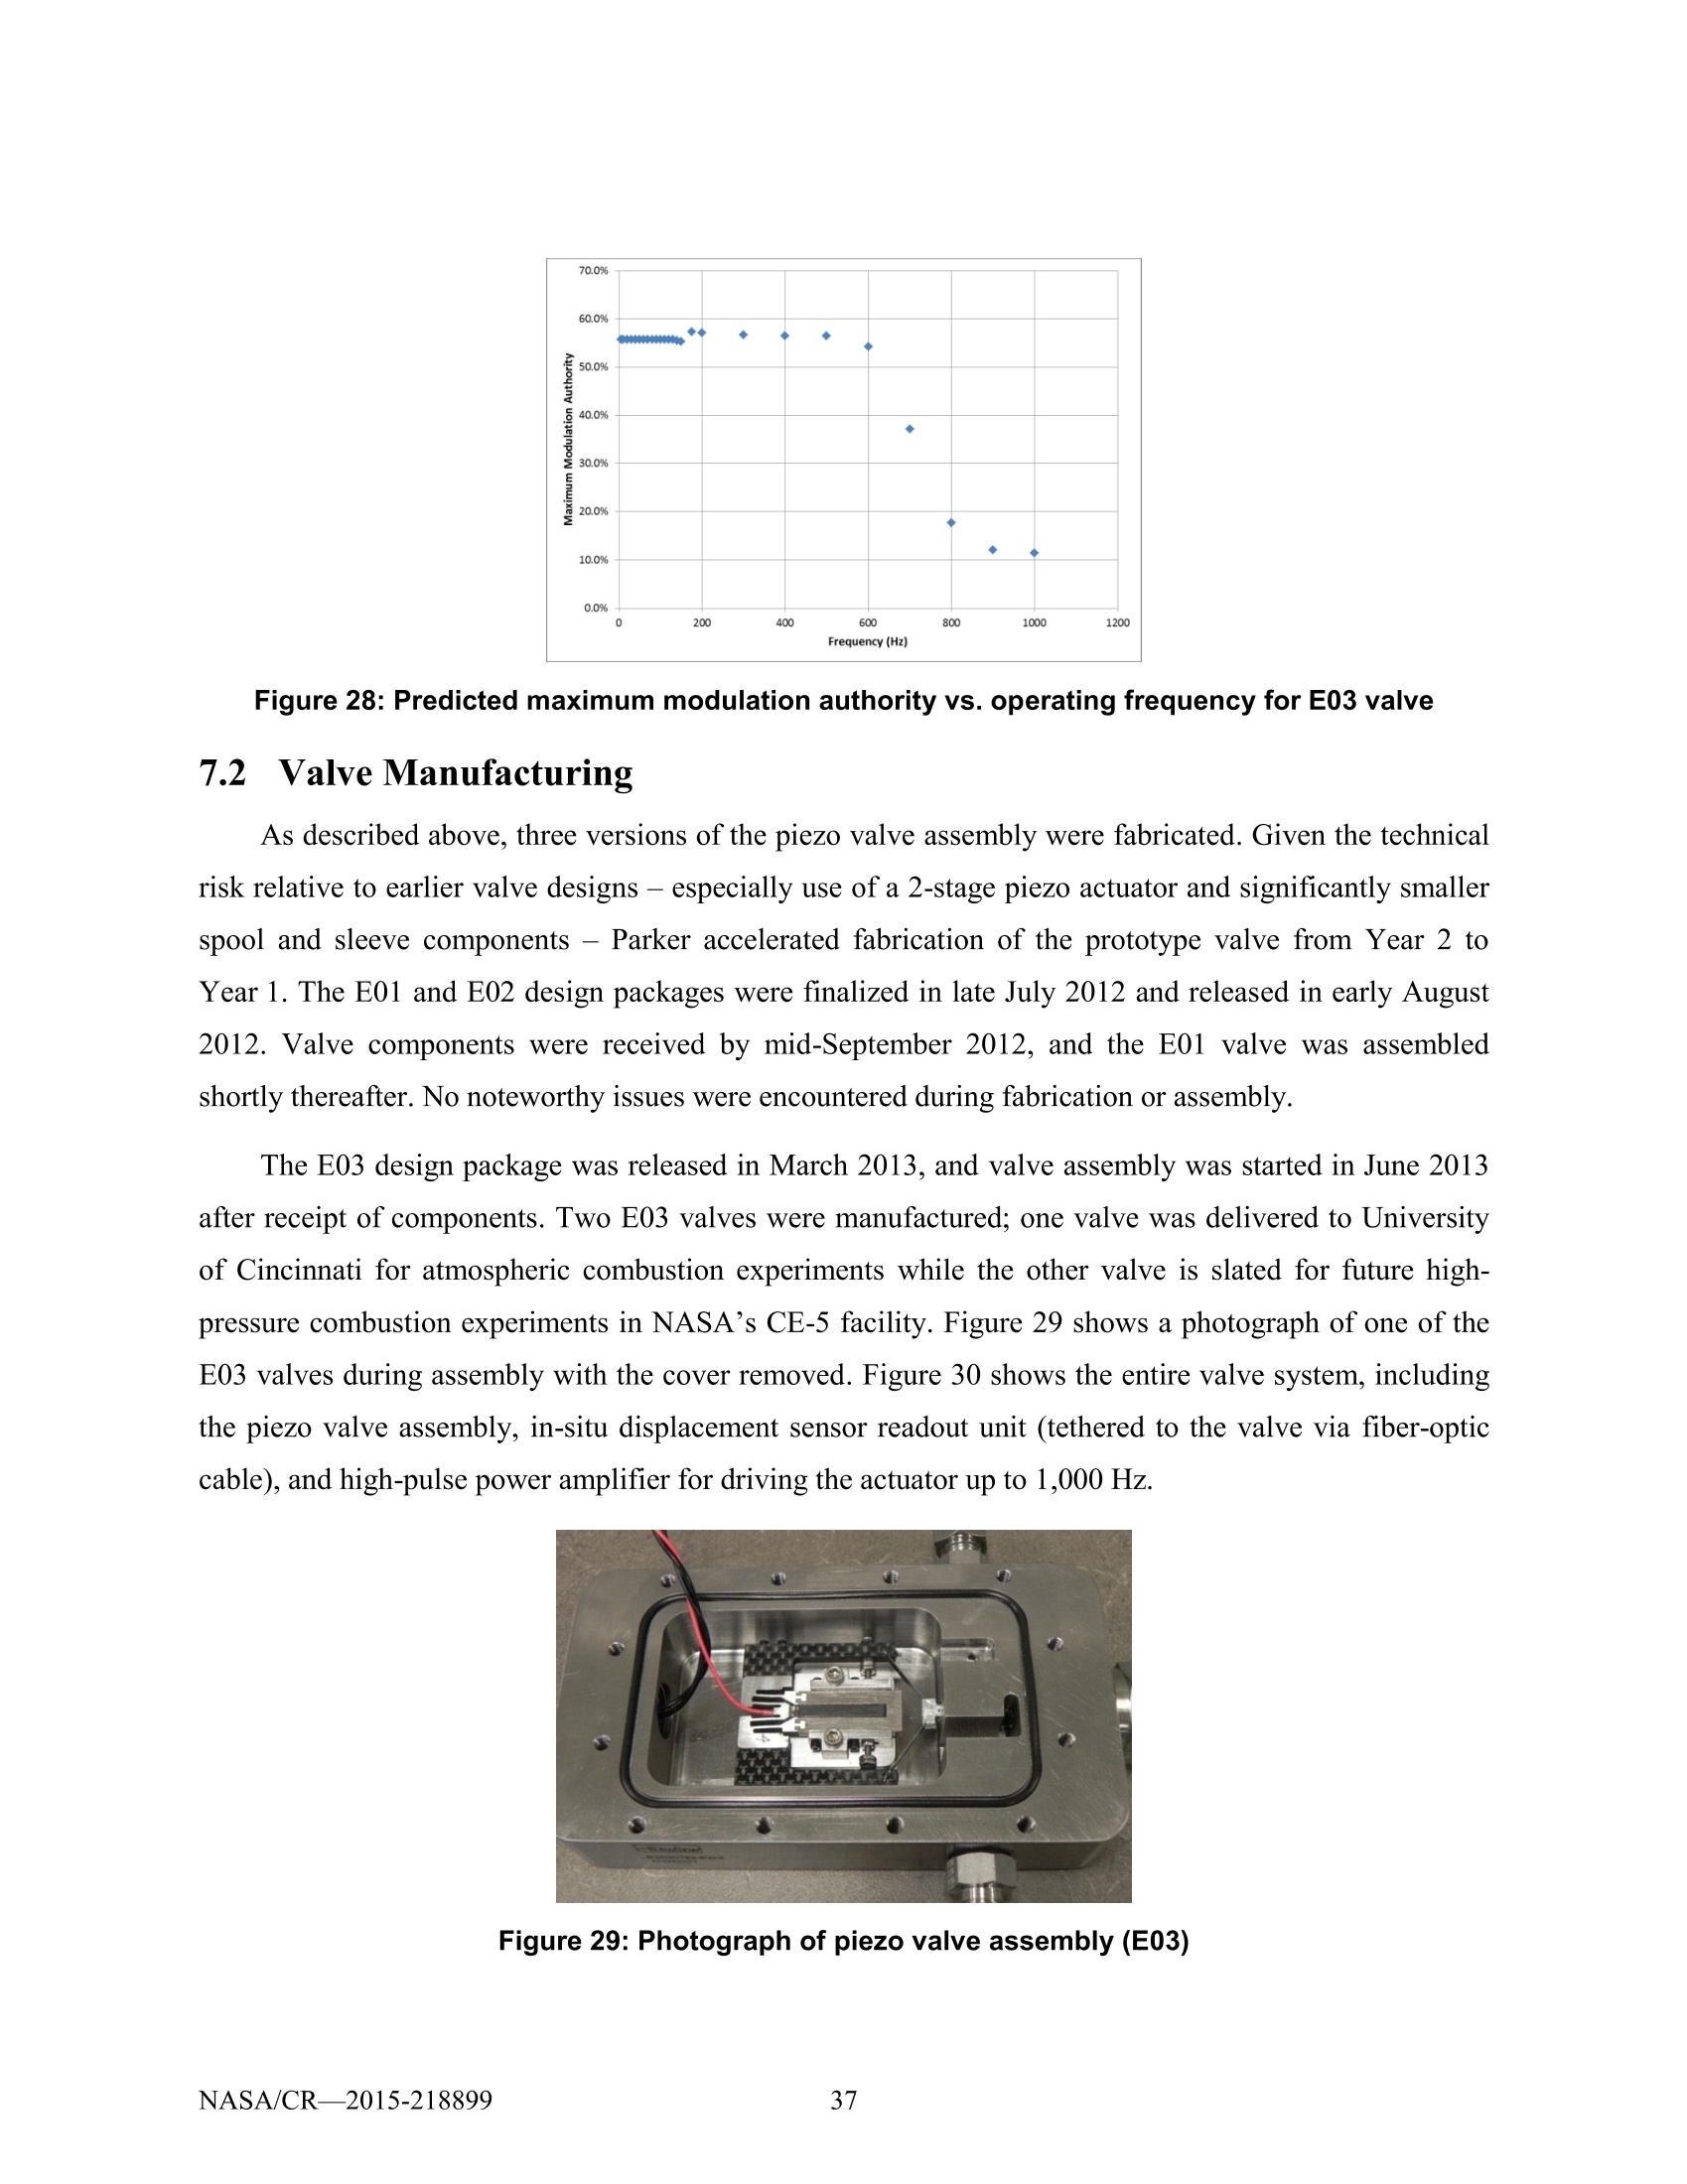
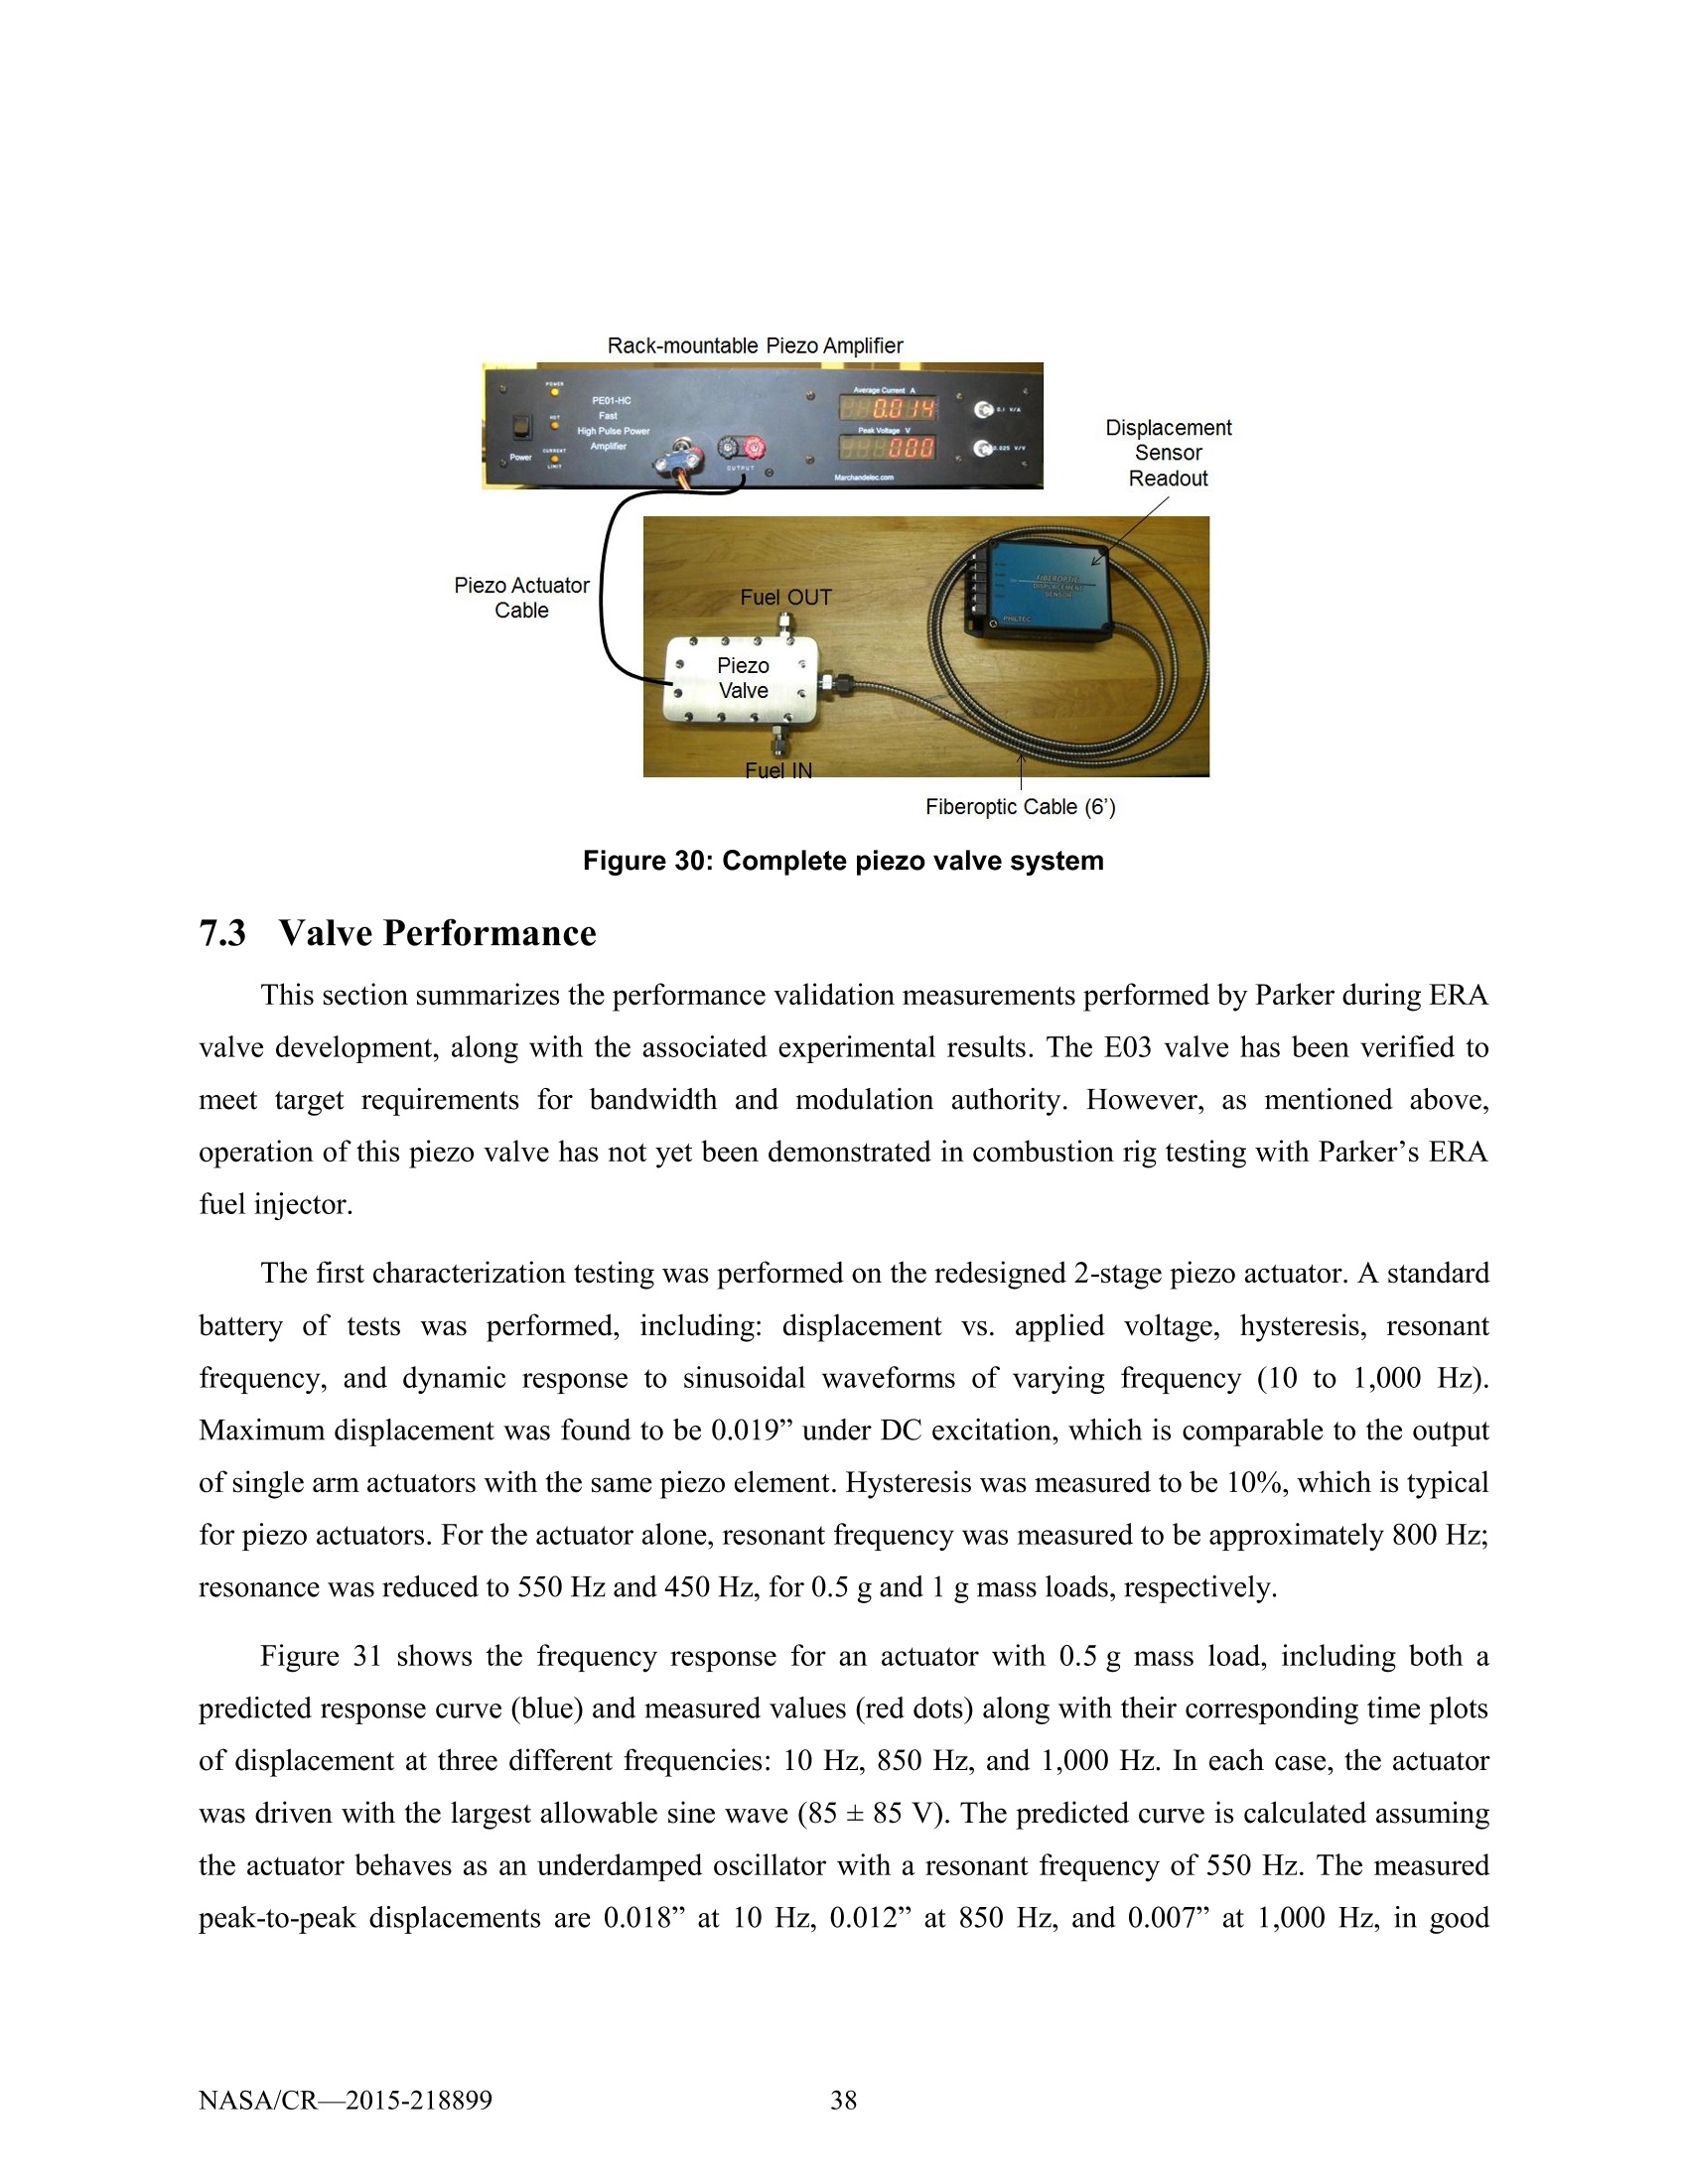
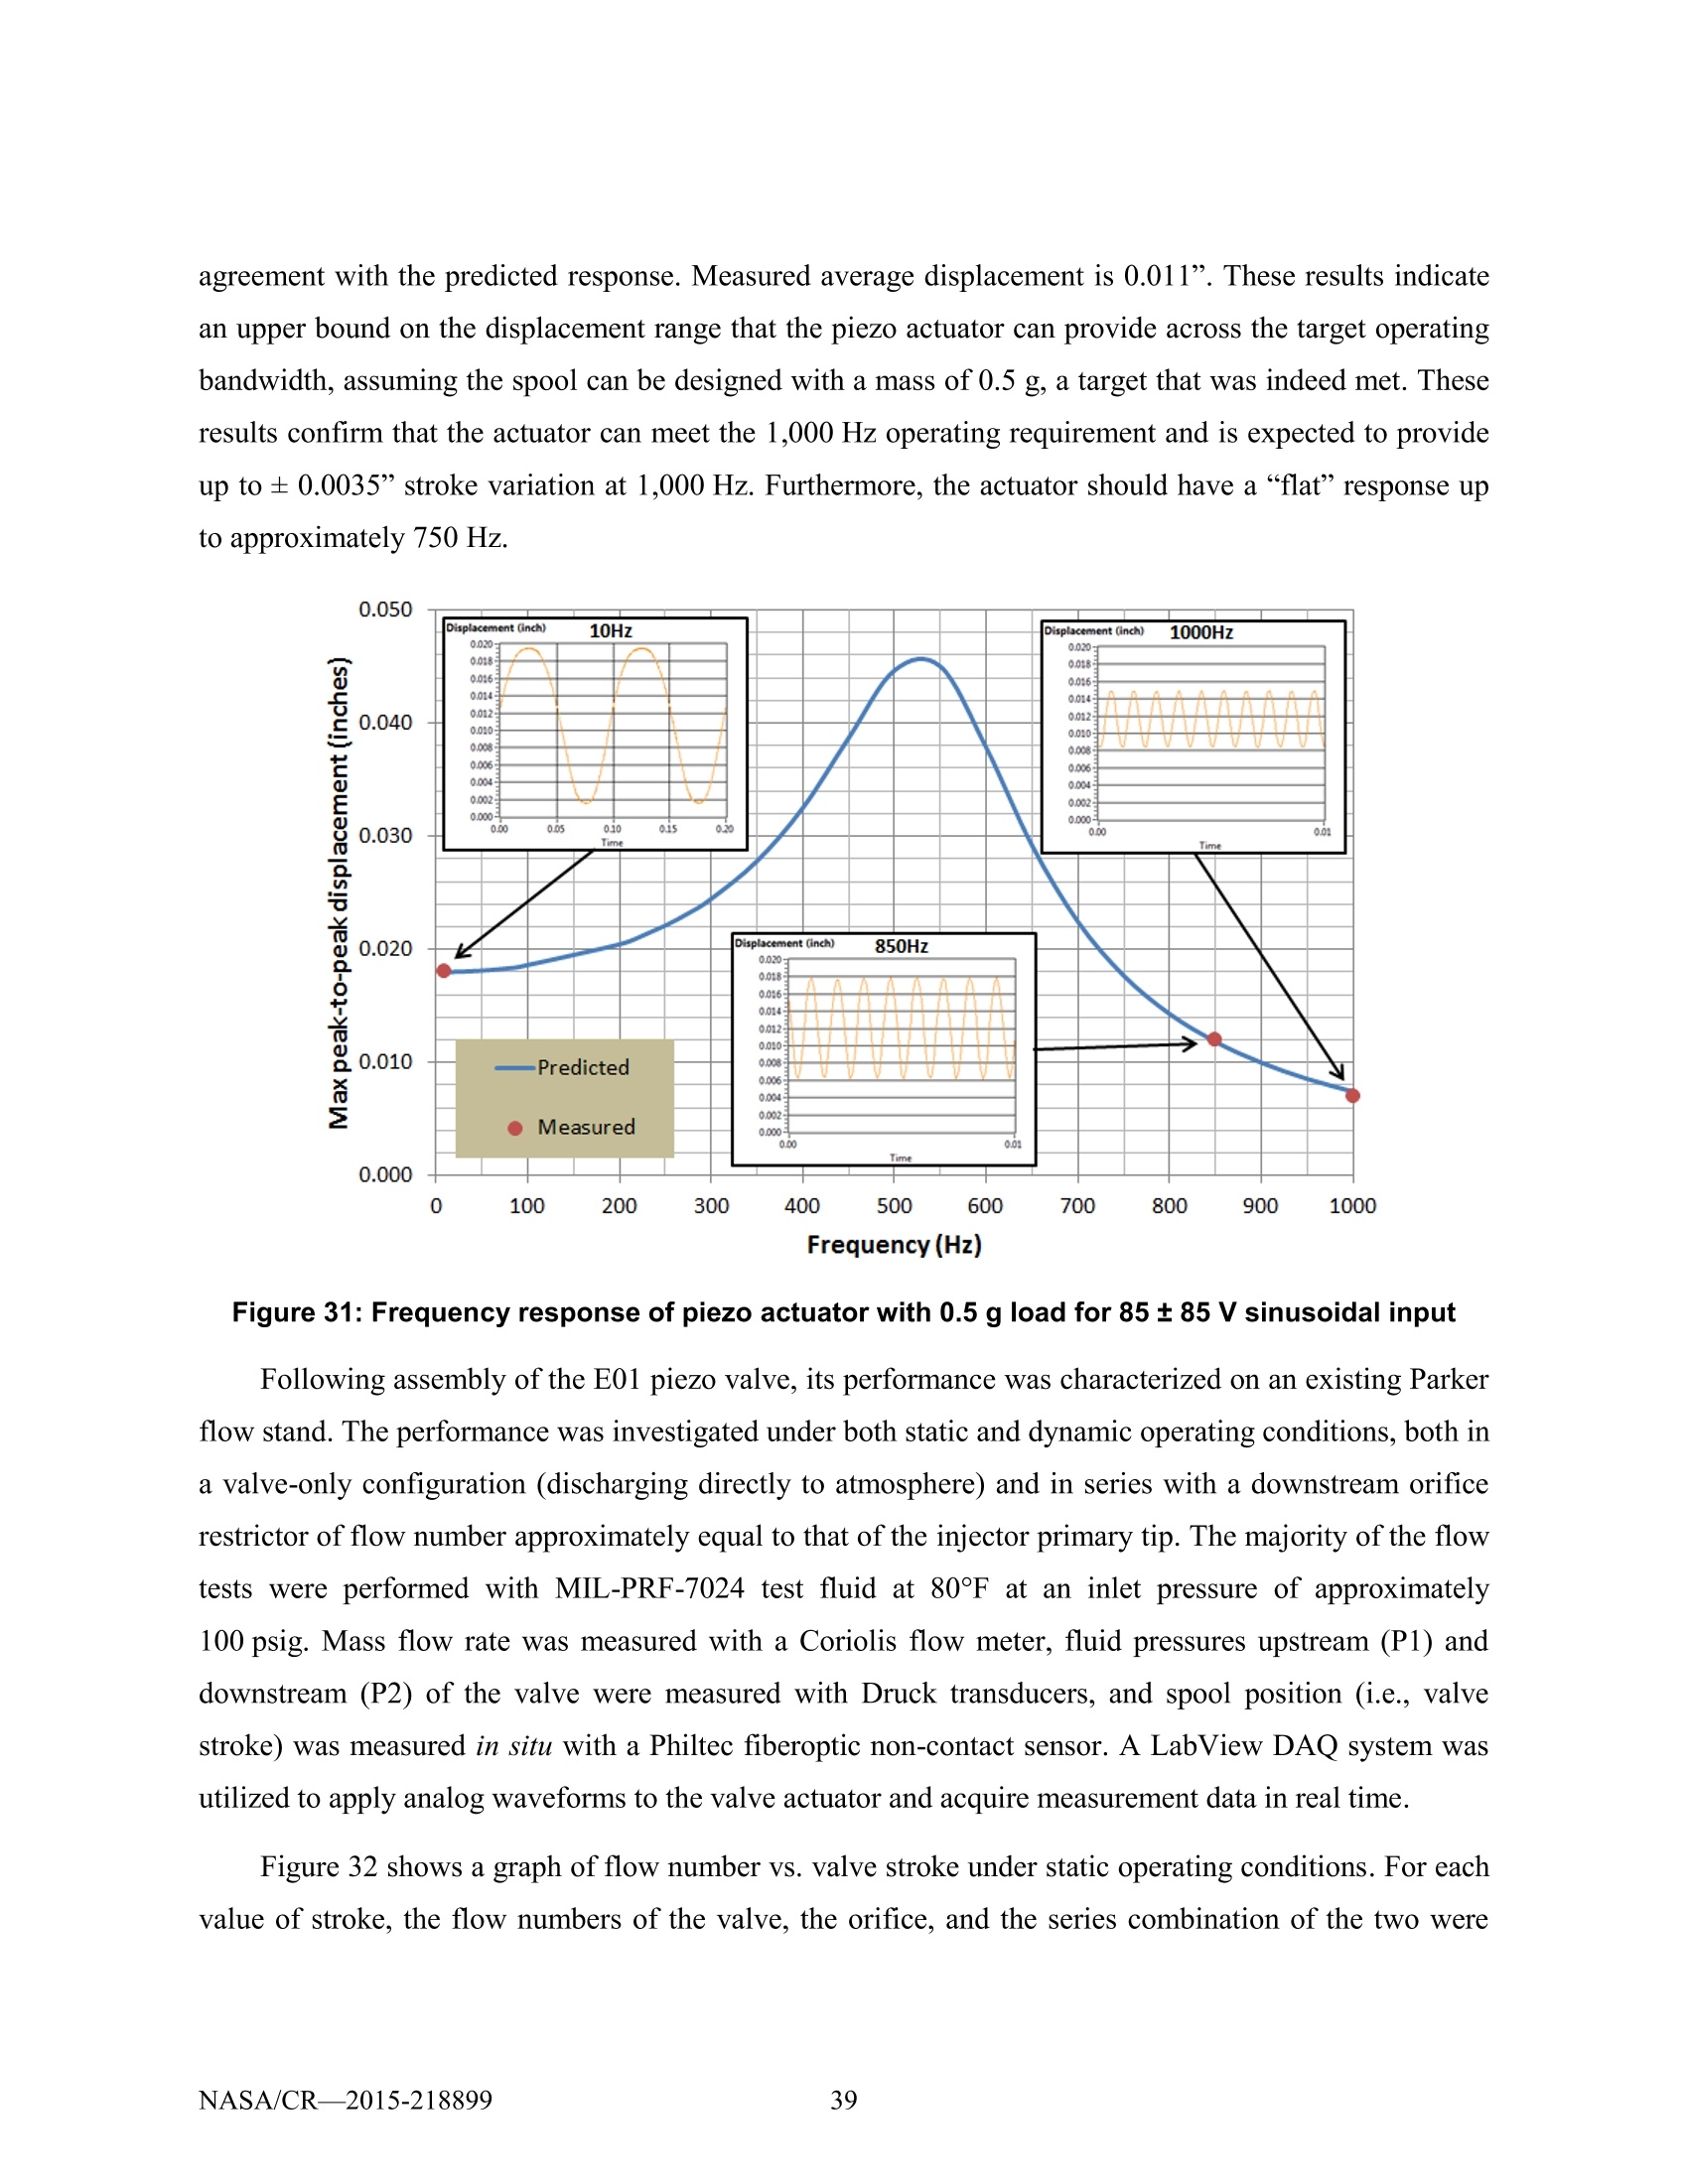
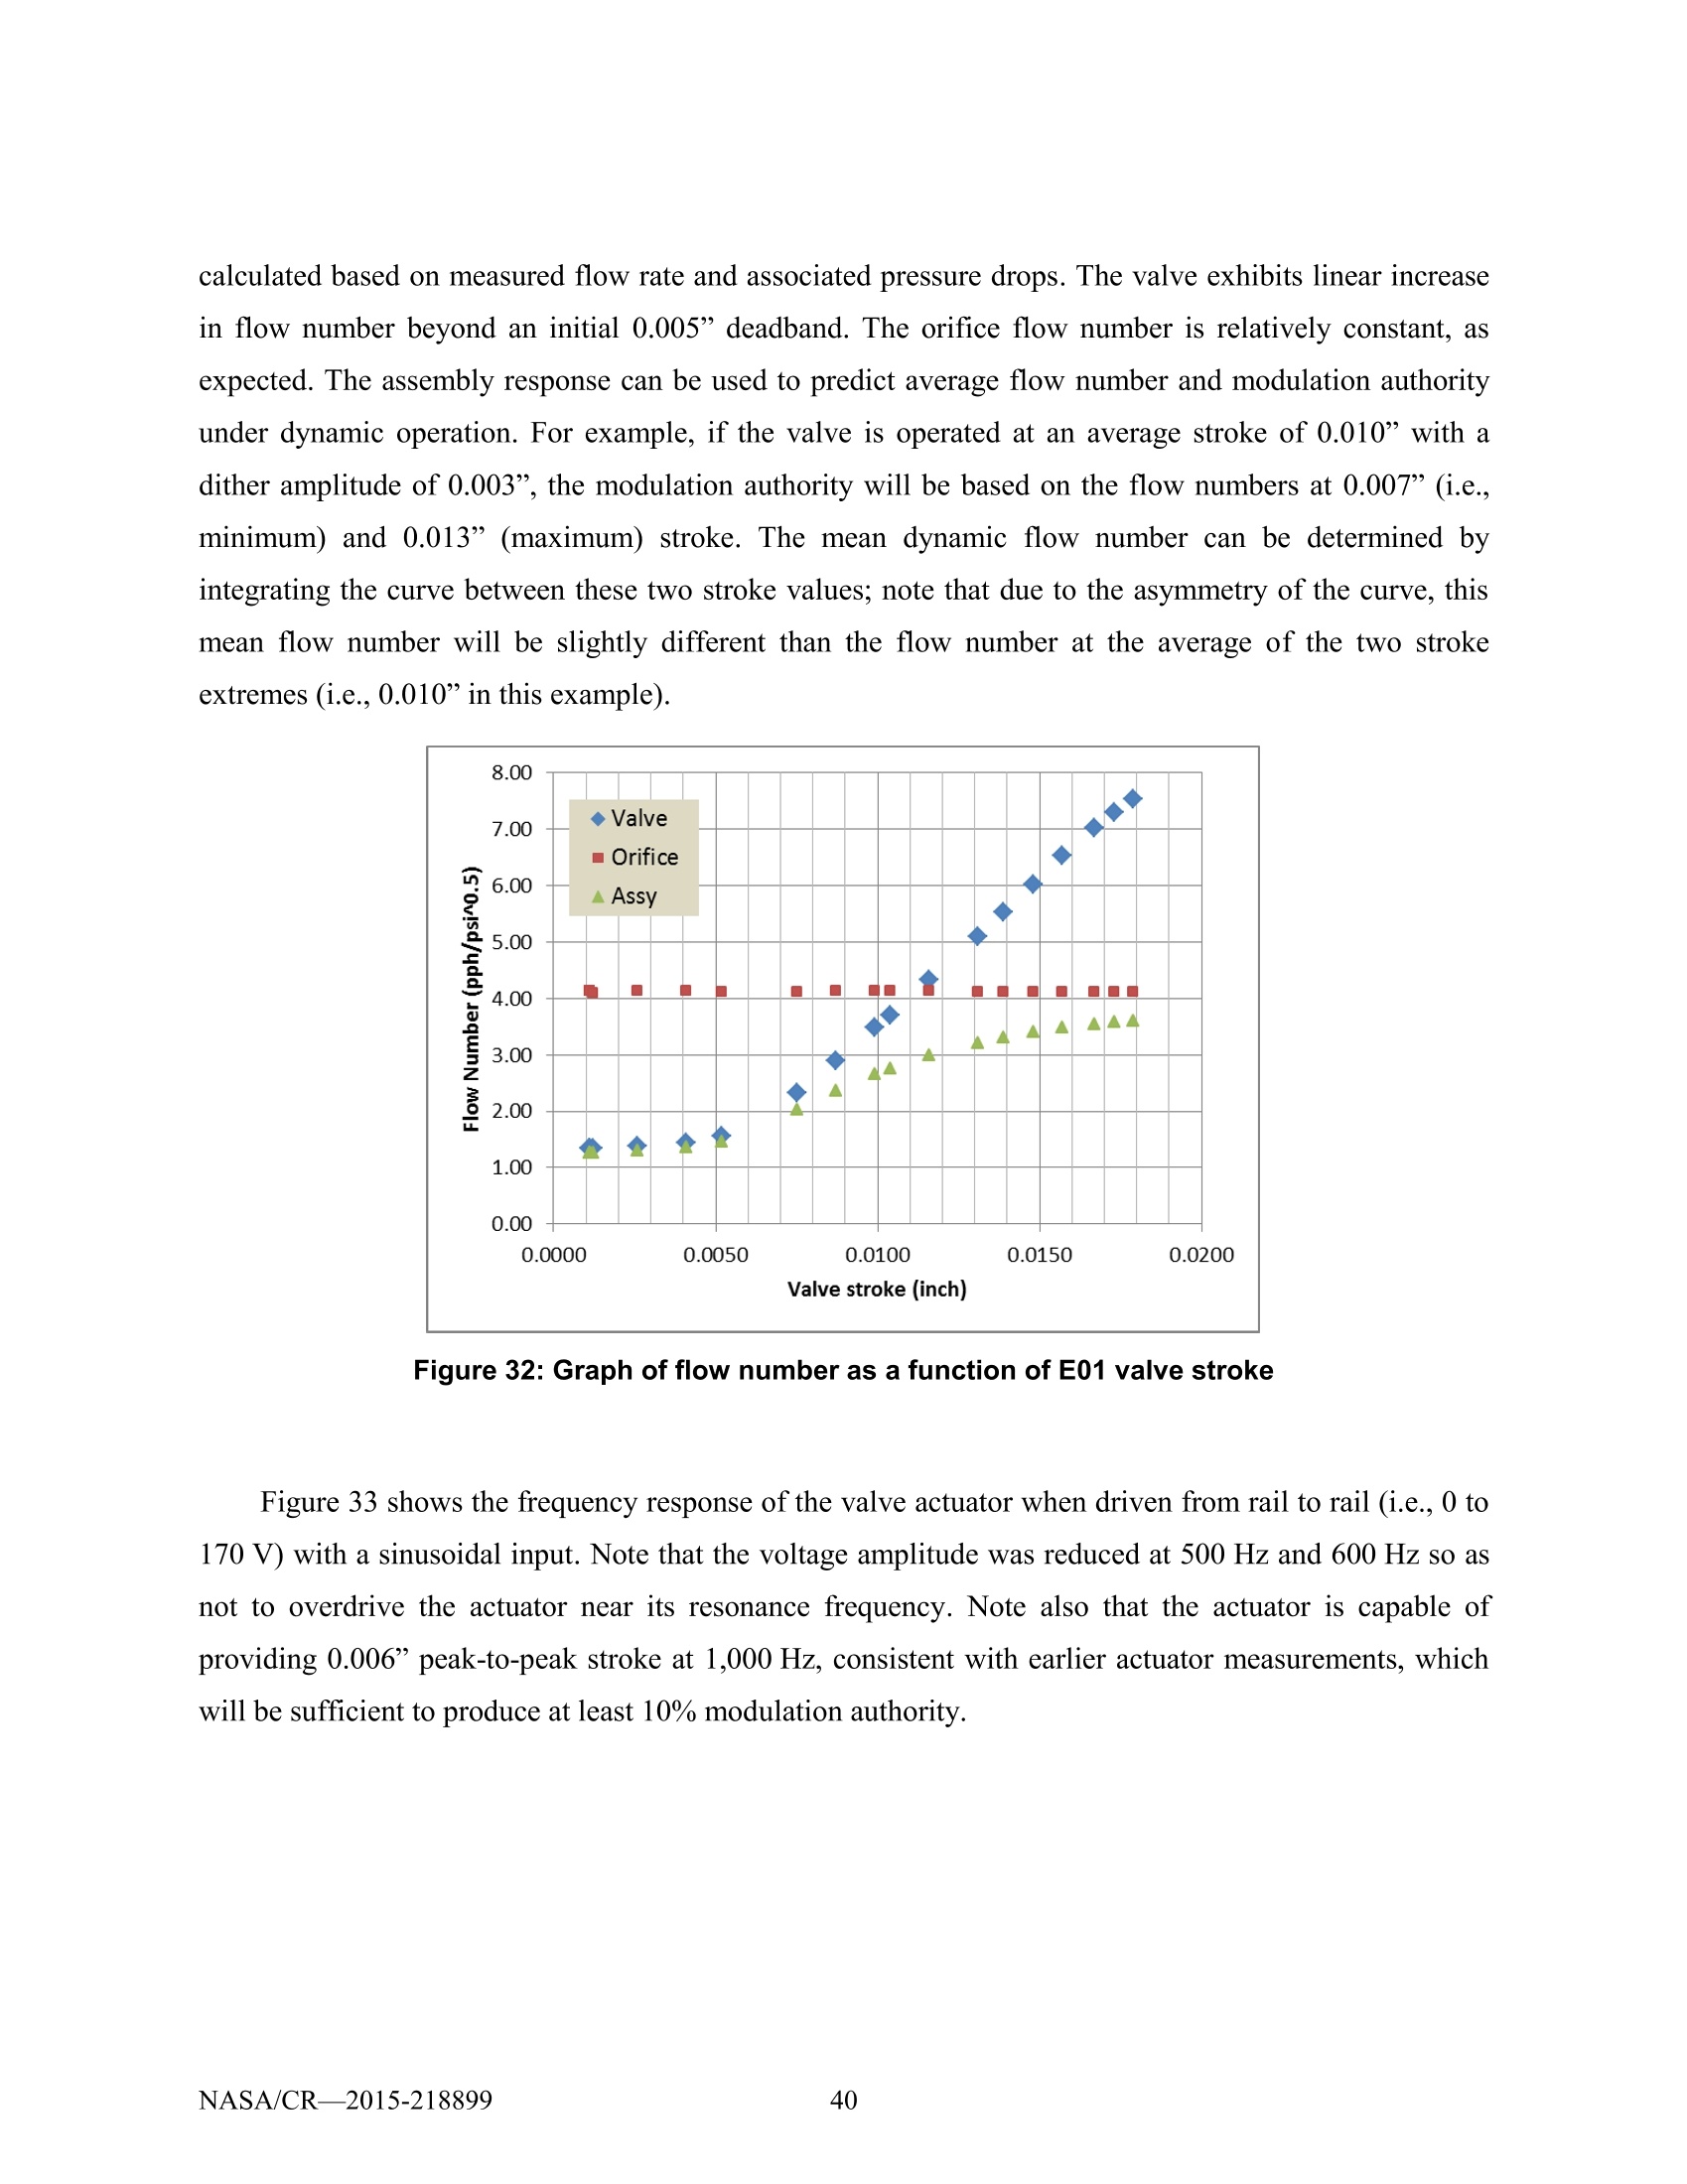
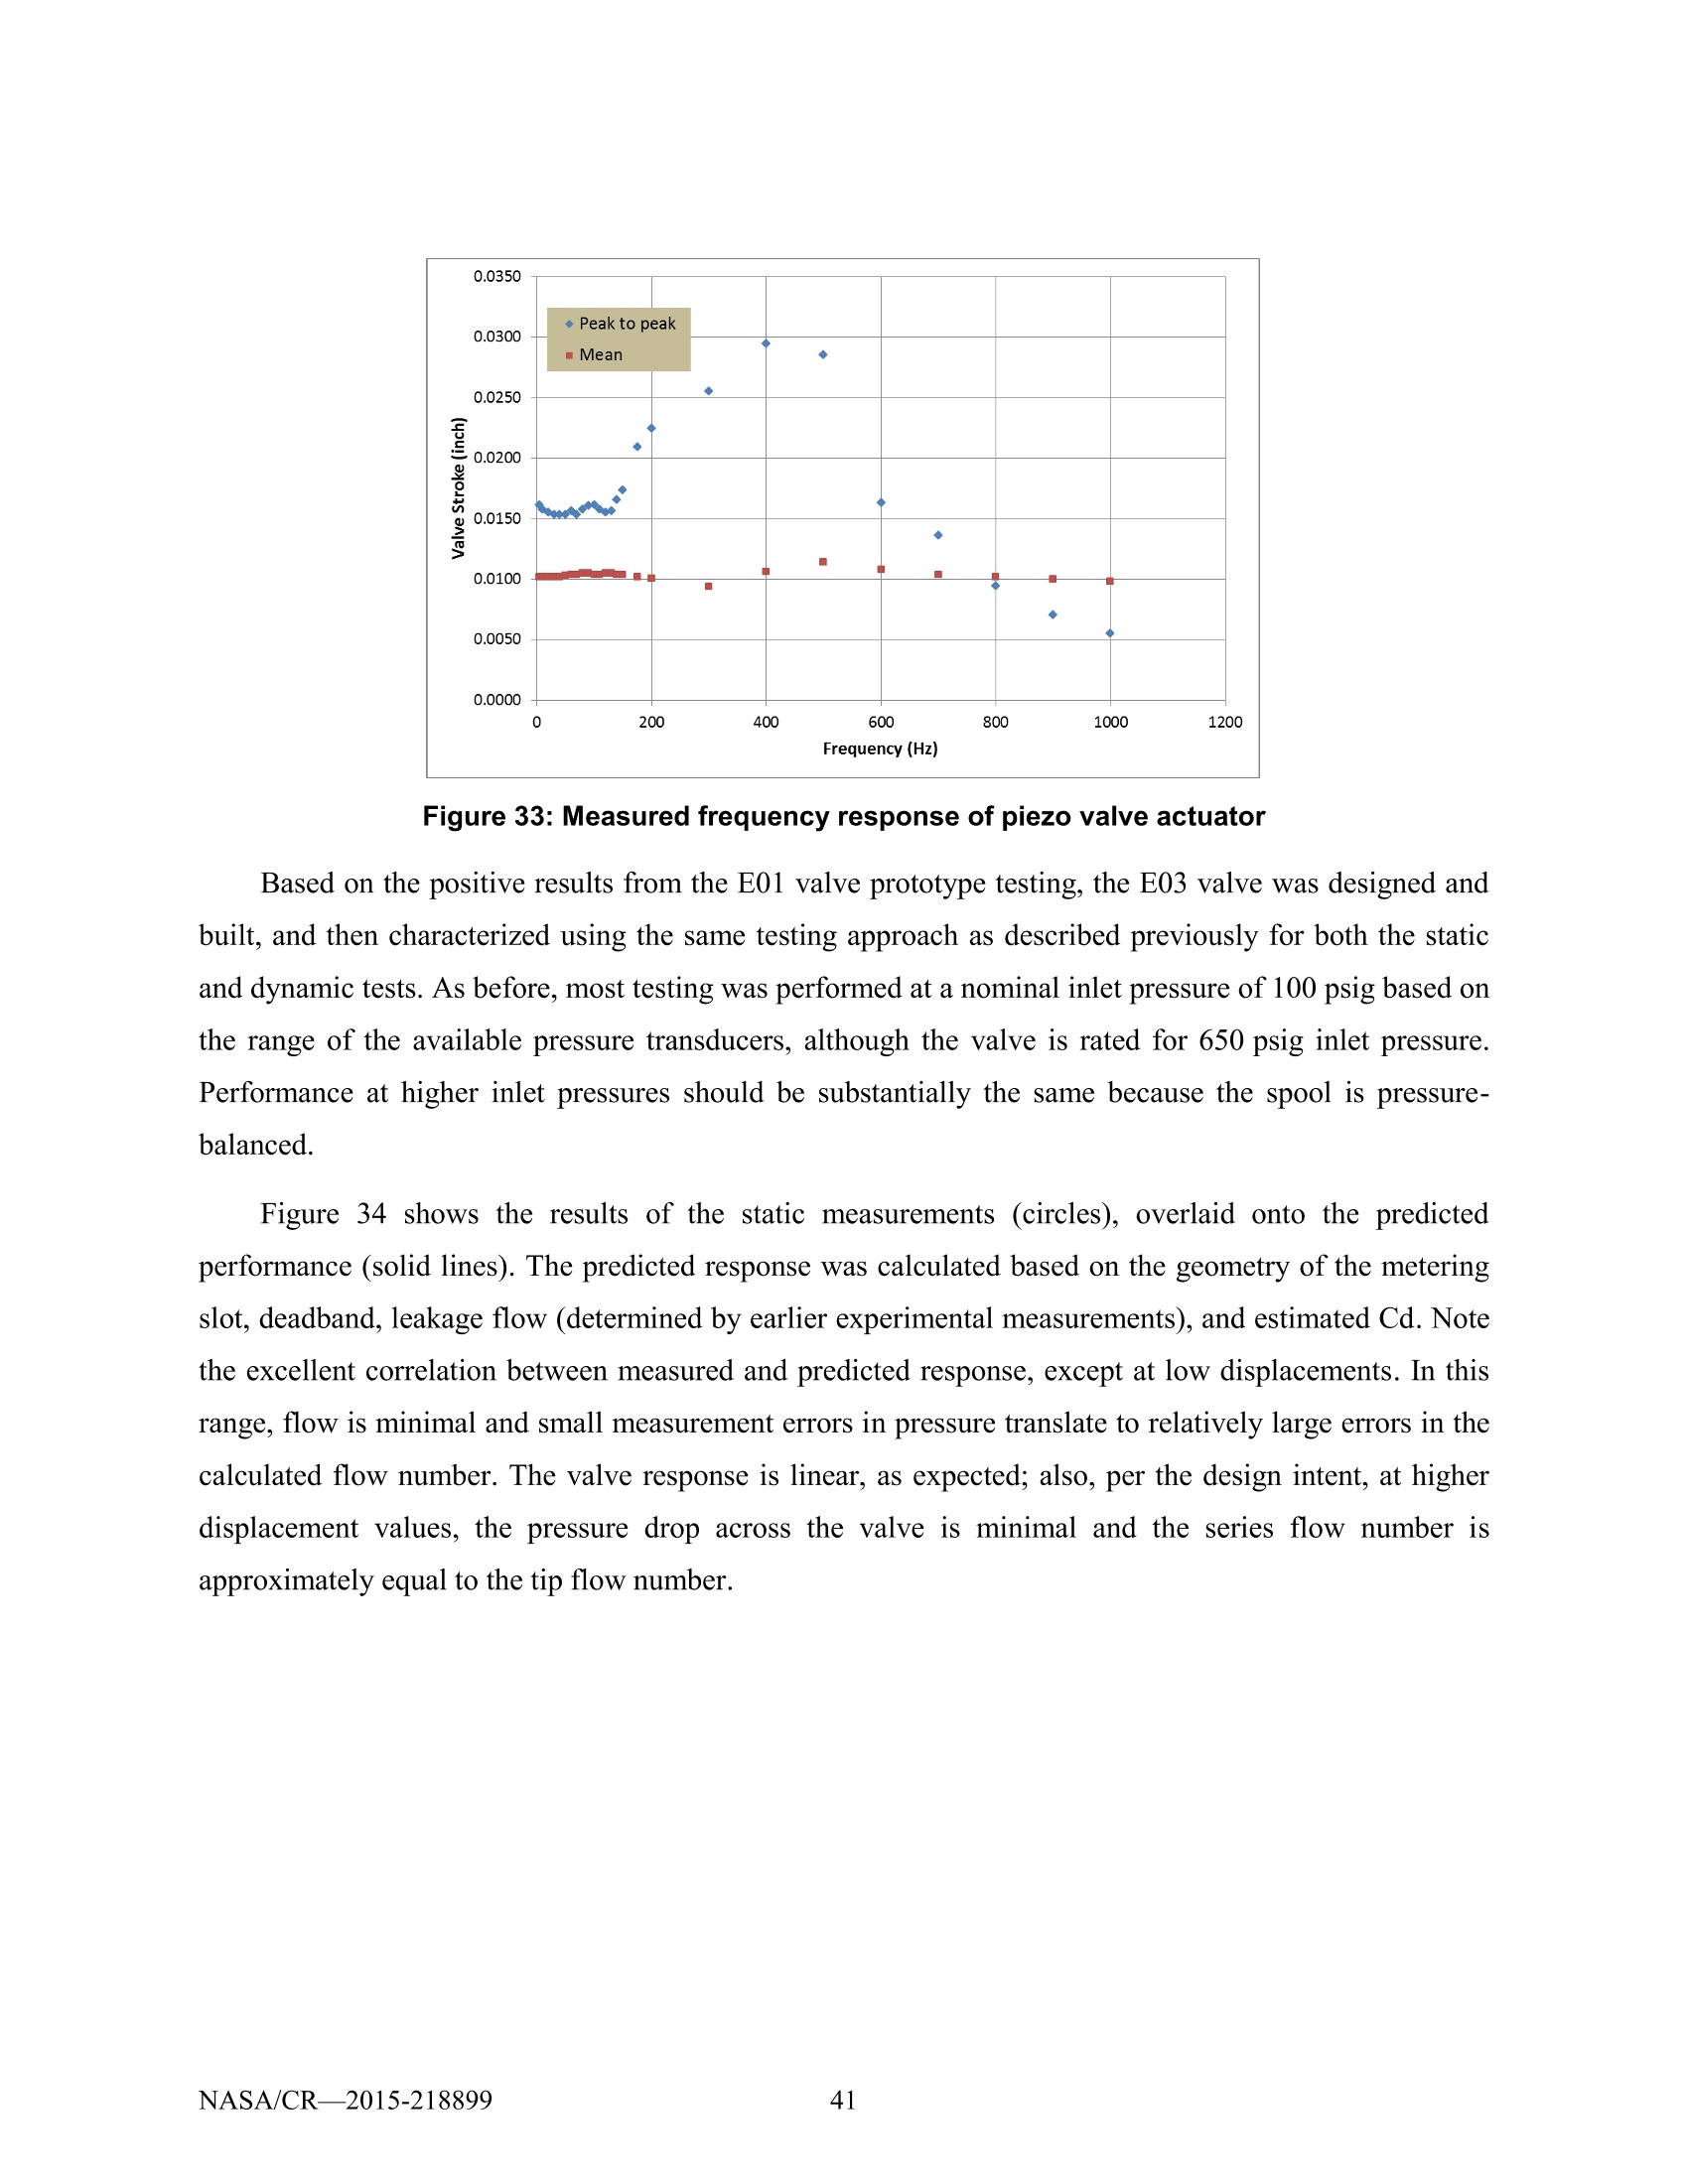
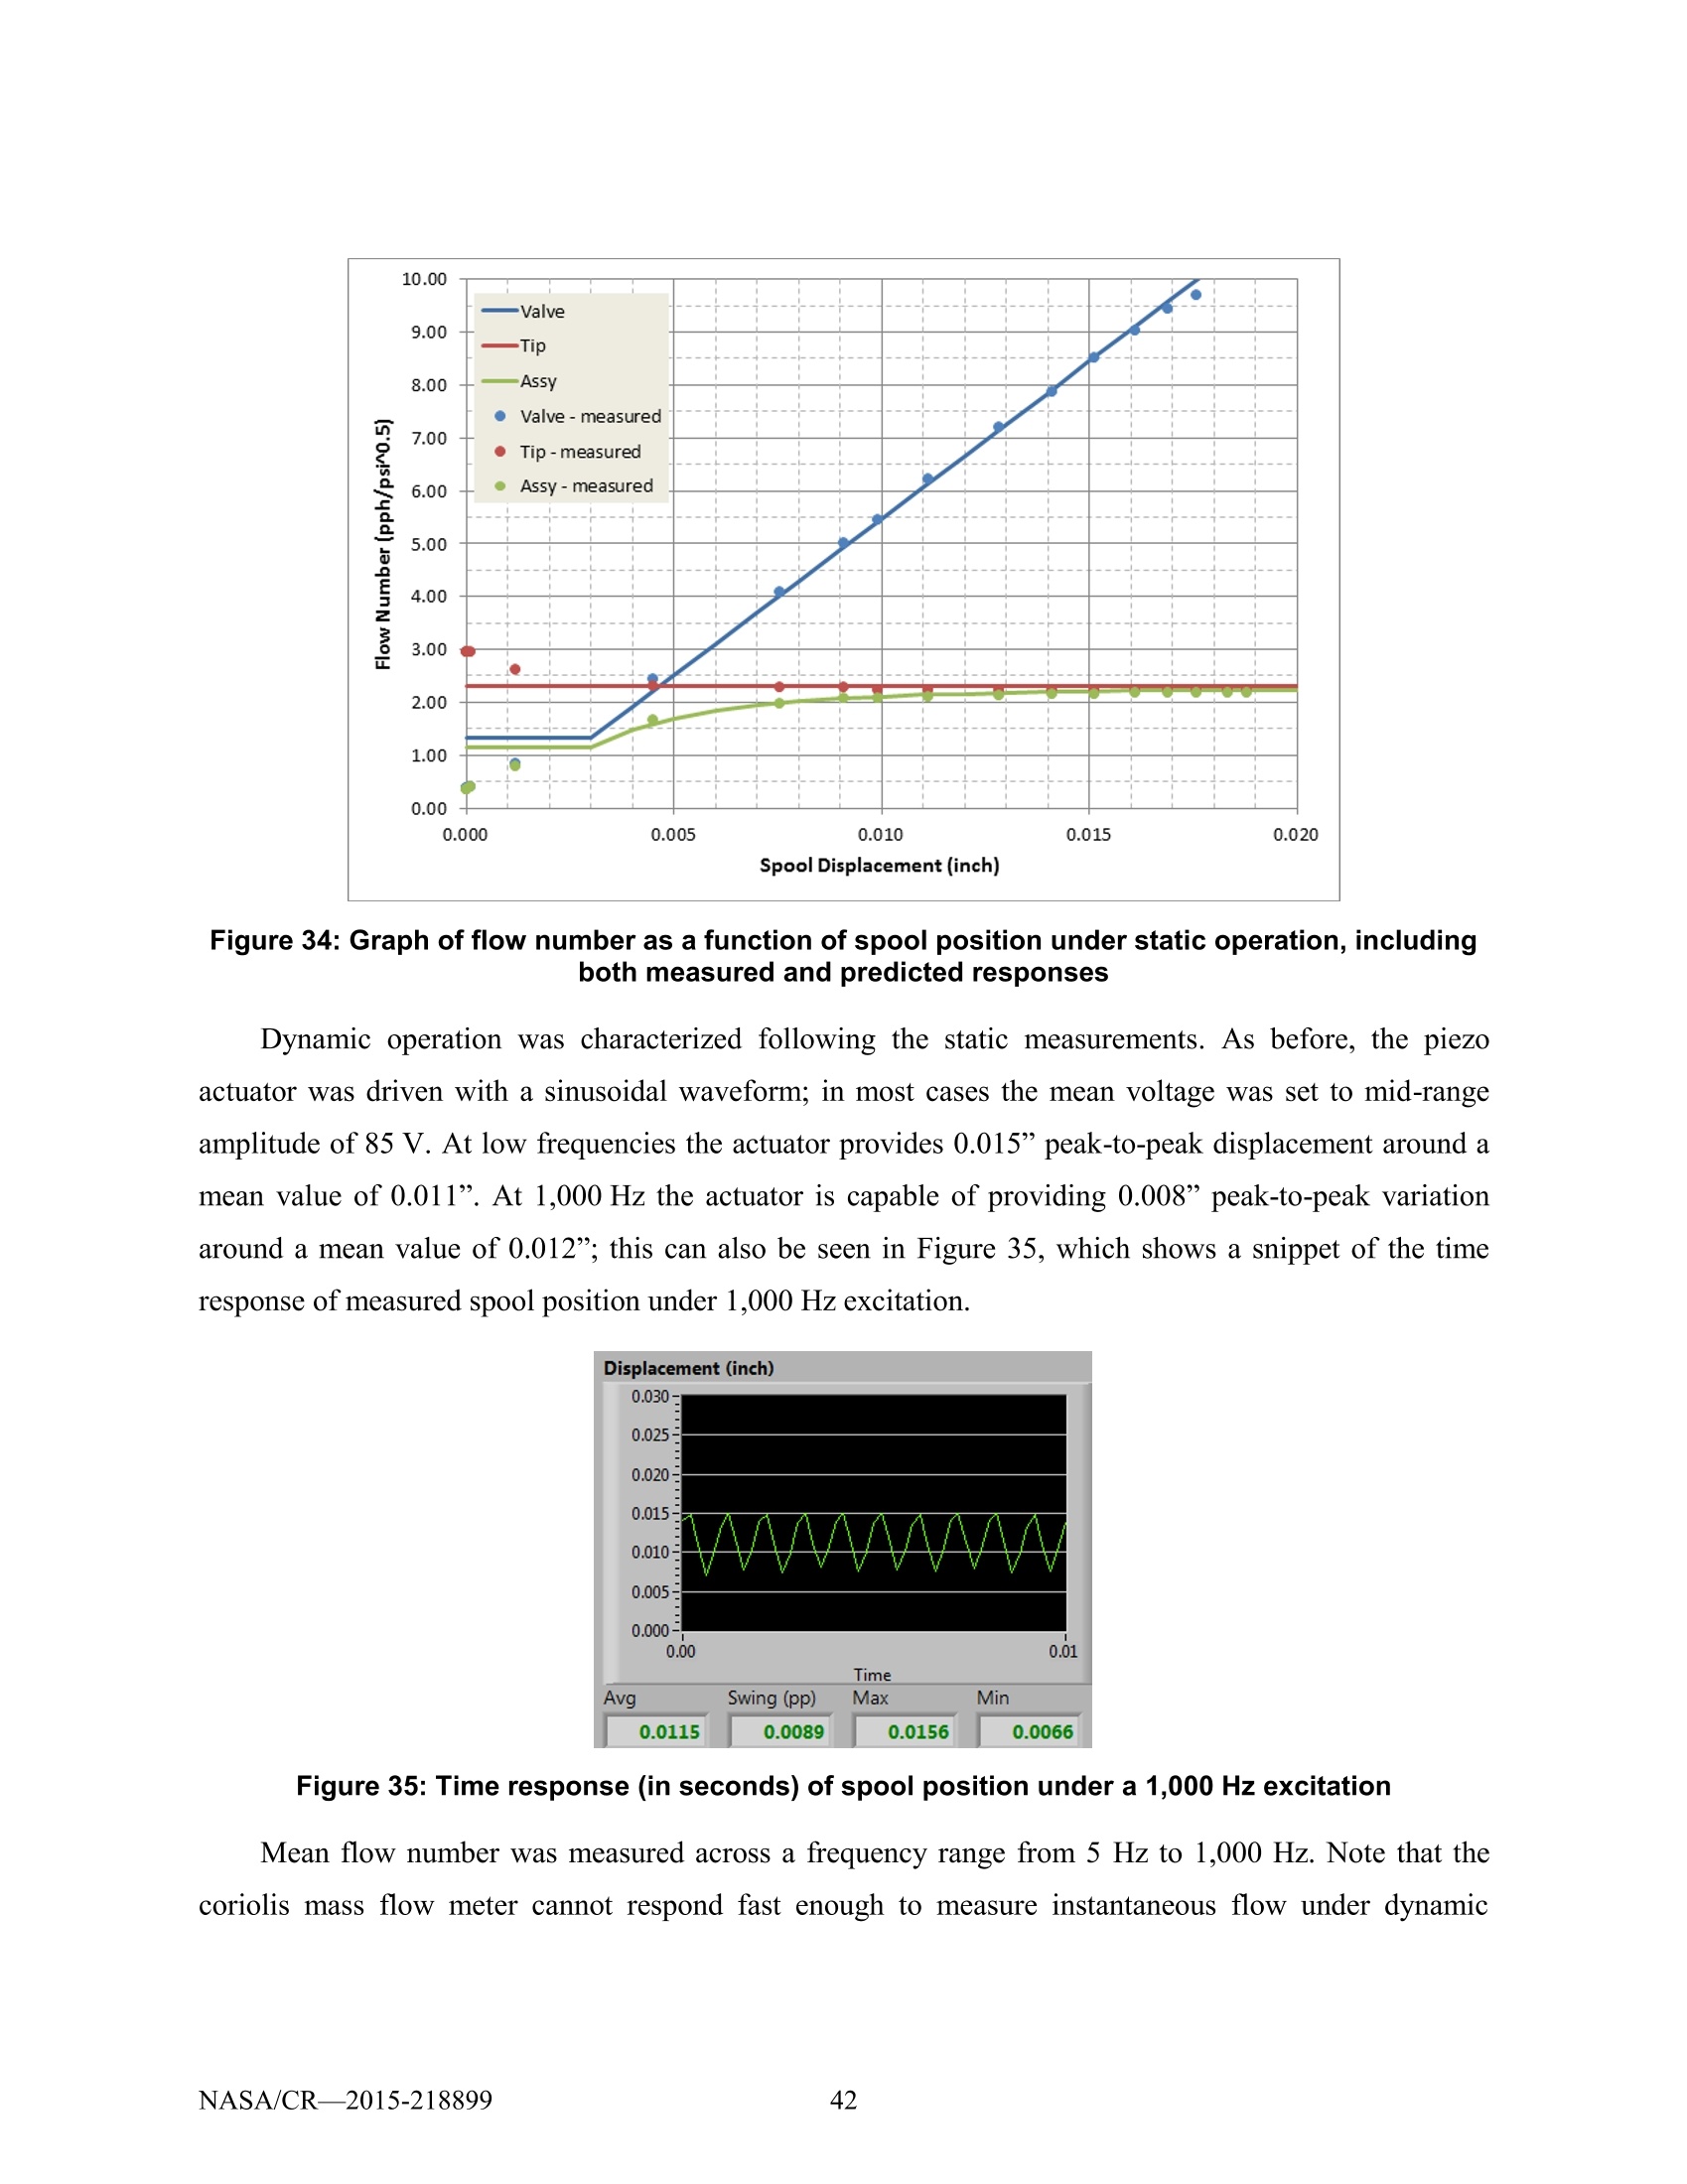
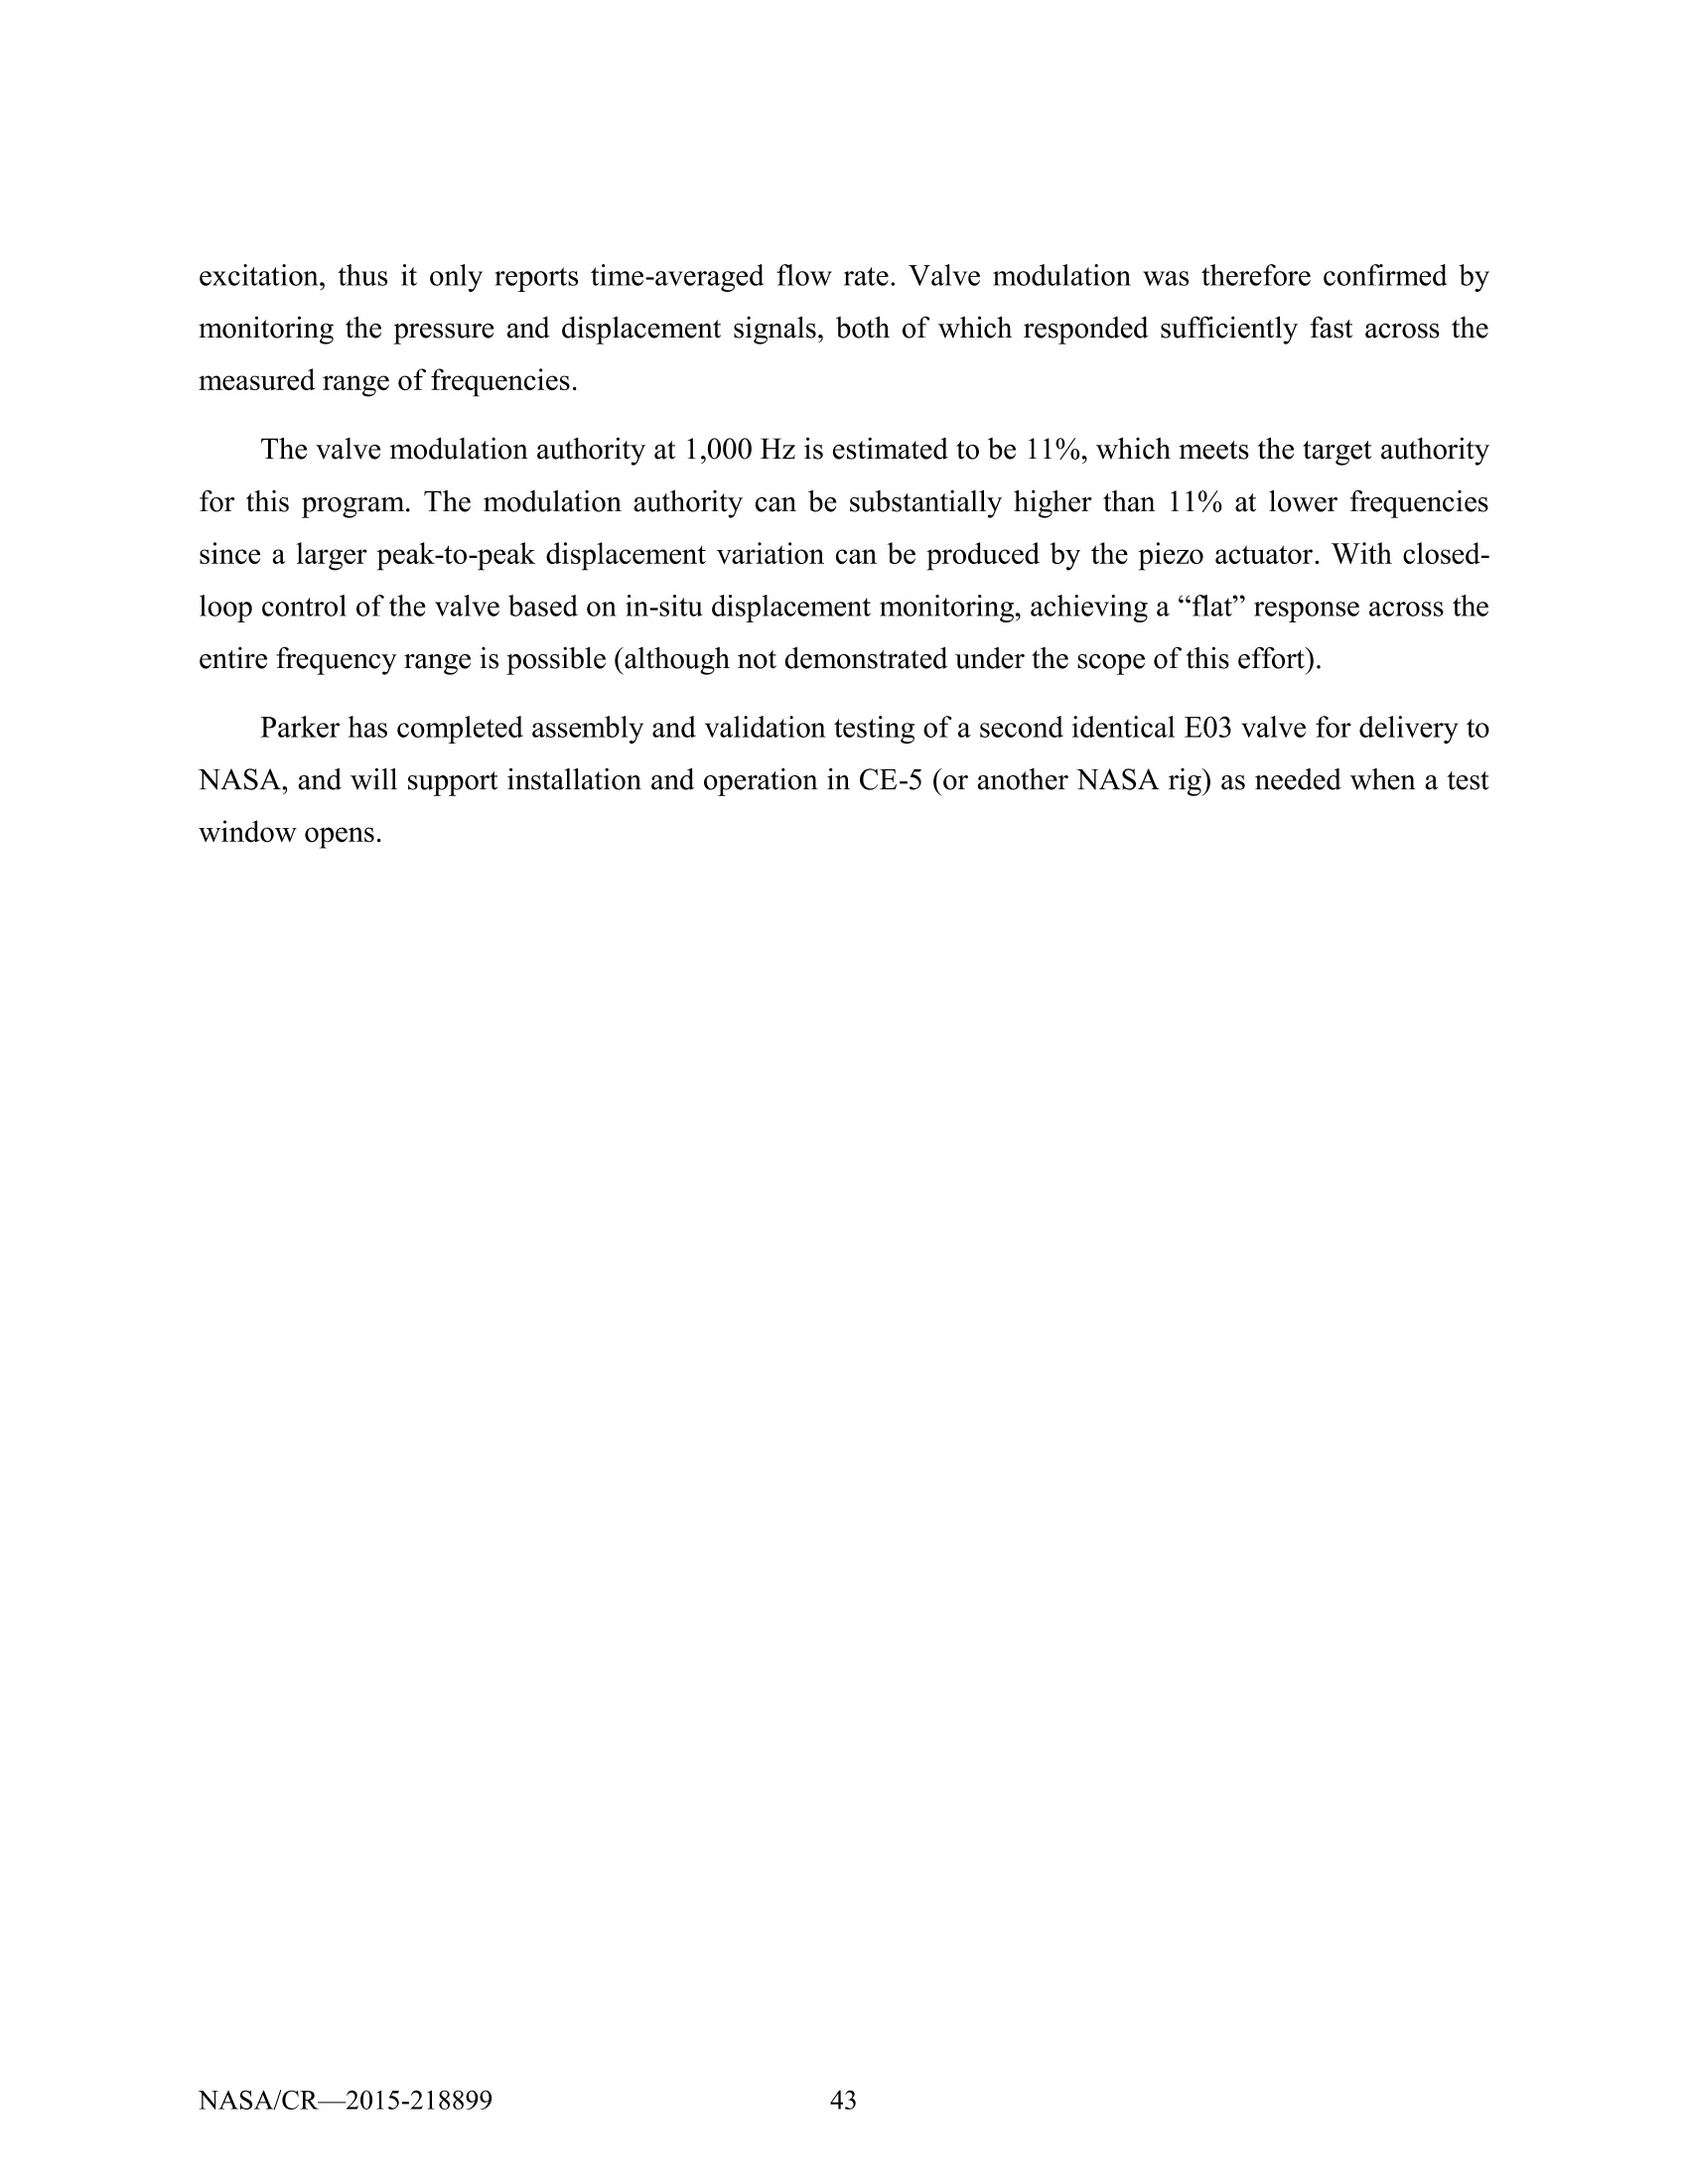


还剩50页未读,是否继续阅读?

产品配置单

北京欧兰科技发展有限公司为您提供《燃料喷雾中燃料喷雾液滴粒径和速度检测方案(激光干涉仪)》,该方案主要用于航天中燃料喷雾液滴粒径和速度检测,参考标准--,《燃料喷雾中燃料喷雾液滴粒径和速度检测方案(激光干涉仪)》用到的仪器有激光相位多普勒干涉仪LDV,PDI,PDPA,PDA
推荐专场

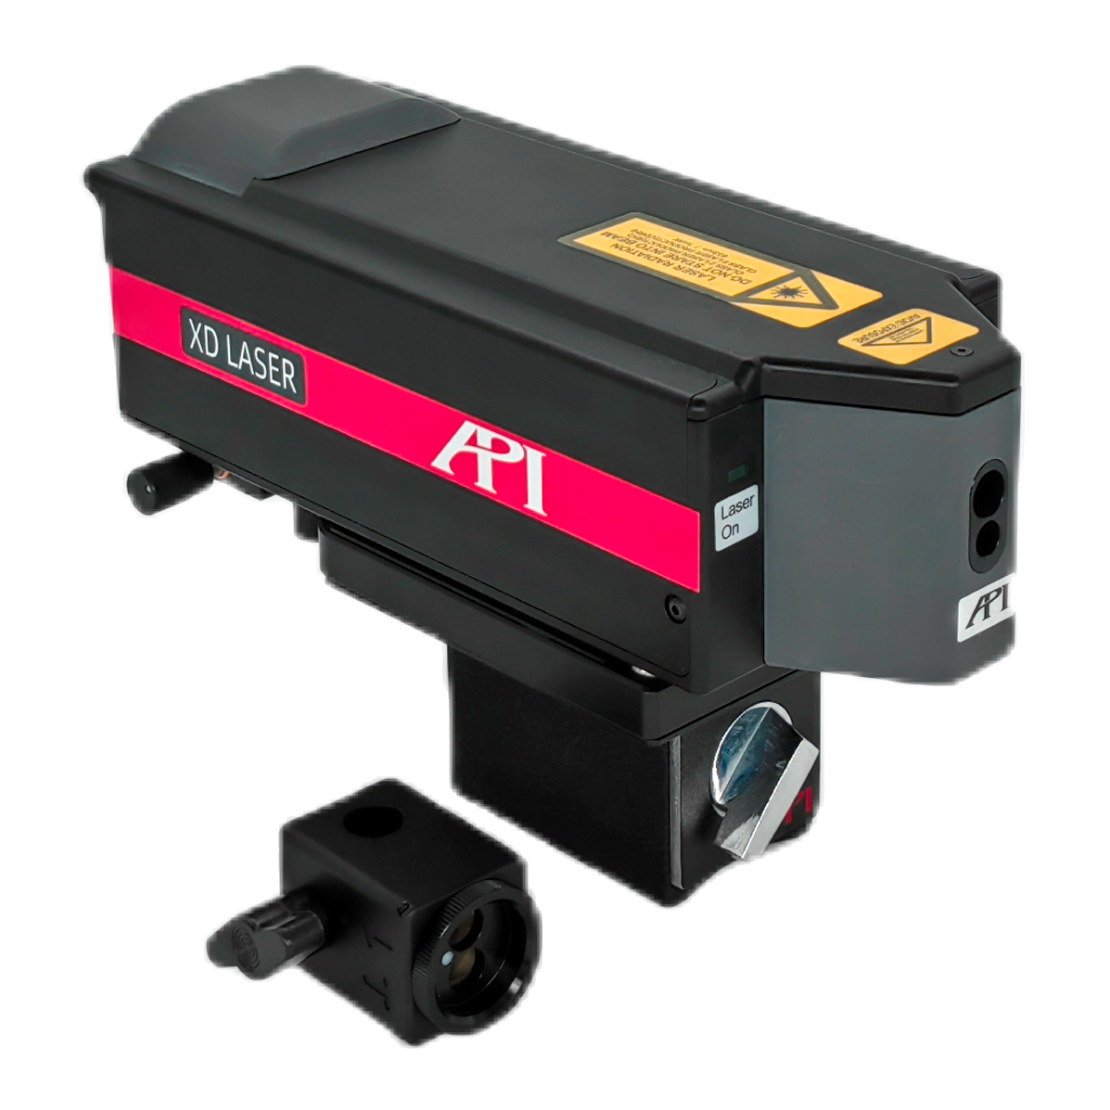
相关方案
更多
该厂商其他方案
更多