


方案详情
文
Comparison of the simple triexponential deconvolution with the freeform MEM shows that they are qualitatively similar for HSA-Q binding. The MEM is more sensitive to environmental and structural changes in the complex. The HORIBA Jobin Yvon 5000U lifetime spectrofluorometer with TCSPC is an integral part of researching structure-property relations during pro-tein-binding studies for the biochemical and medical fields.
方案详情

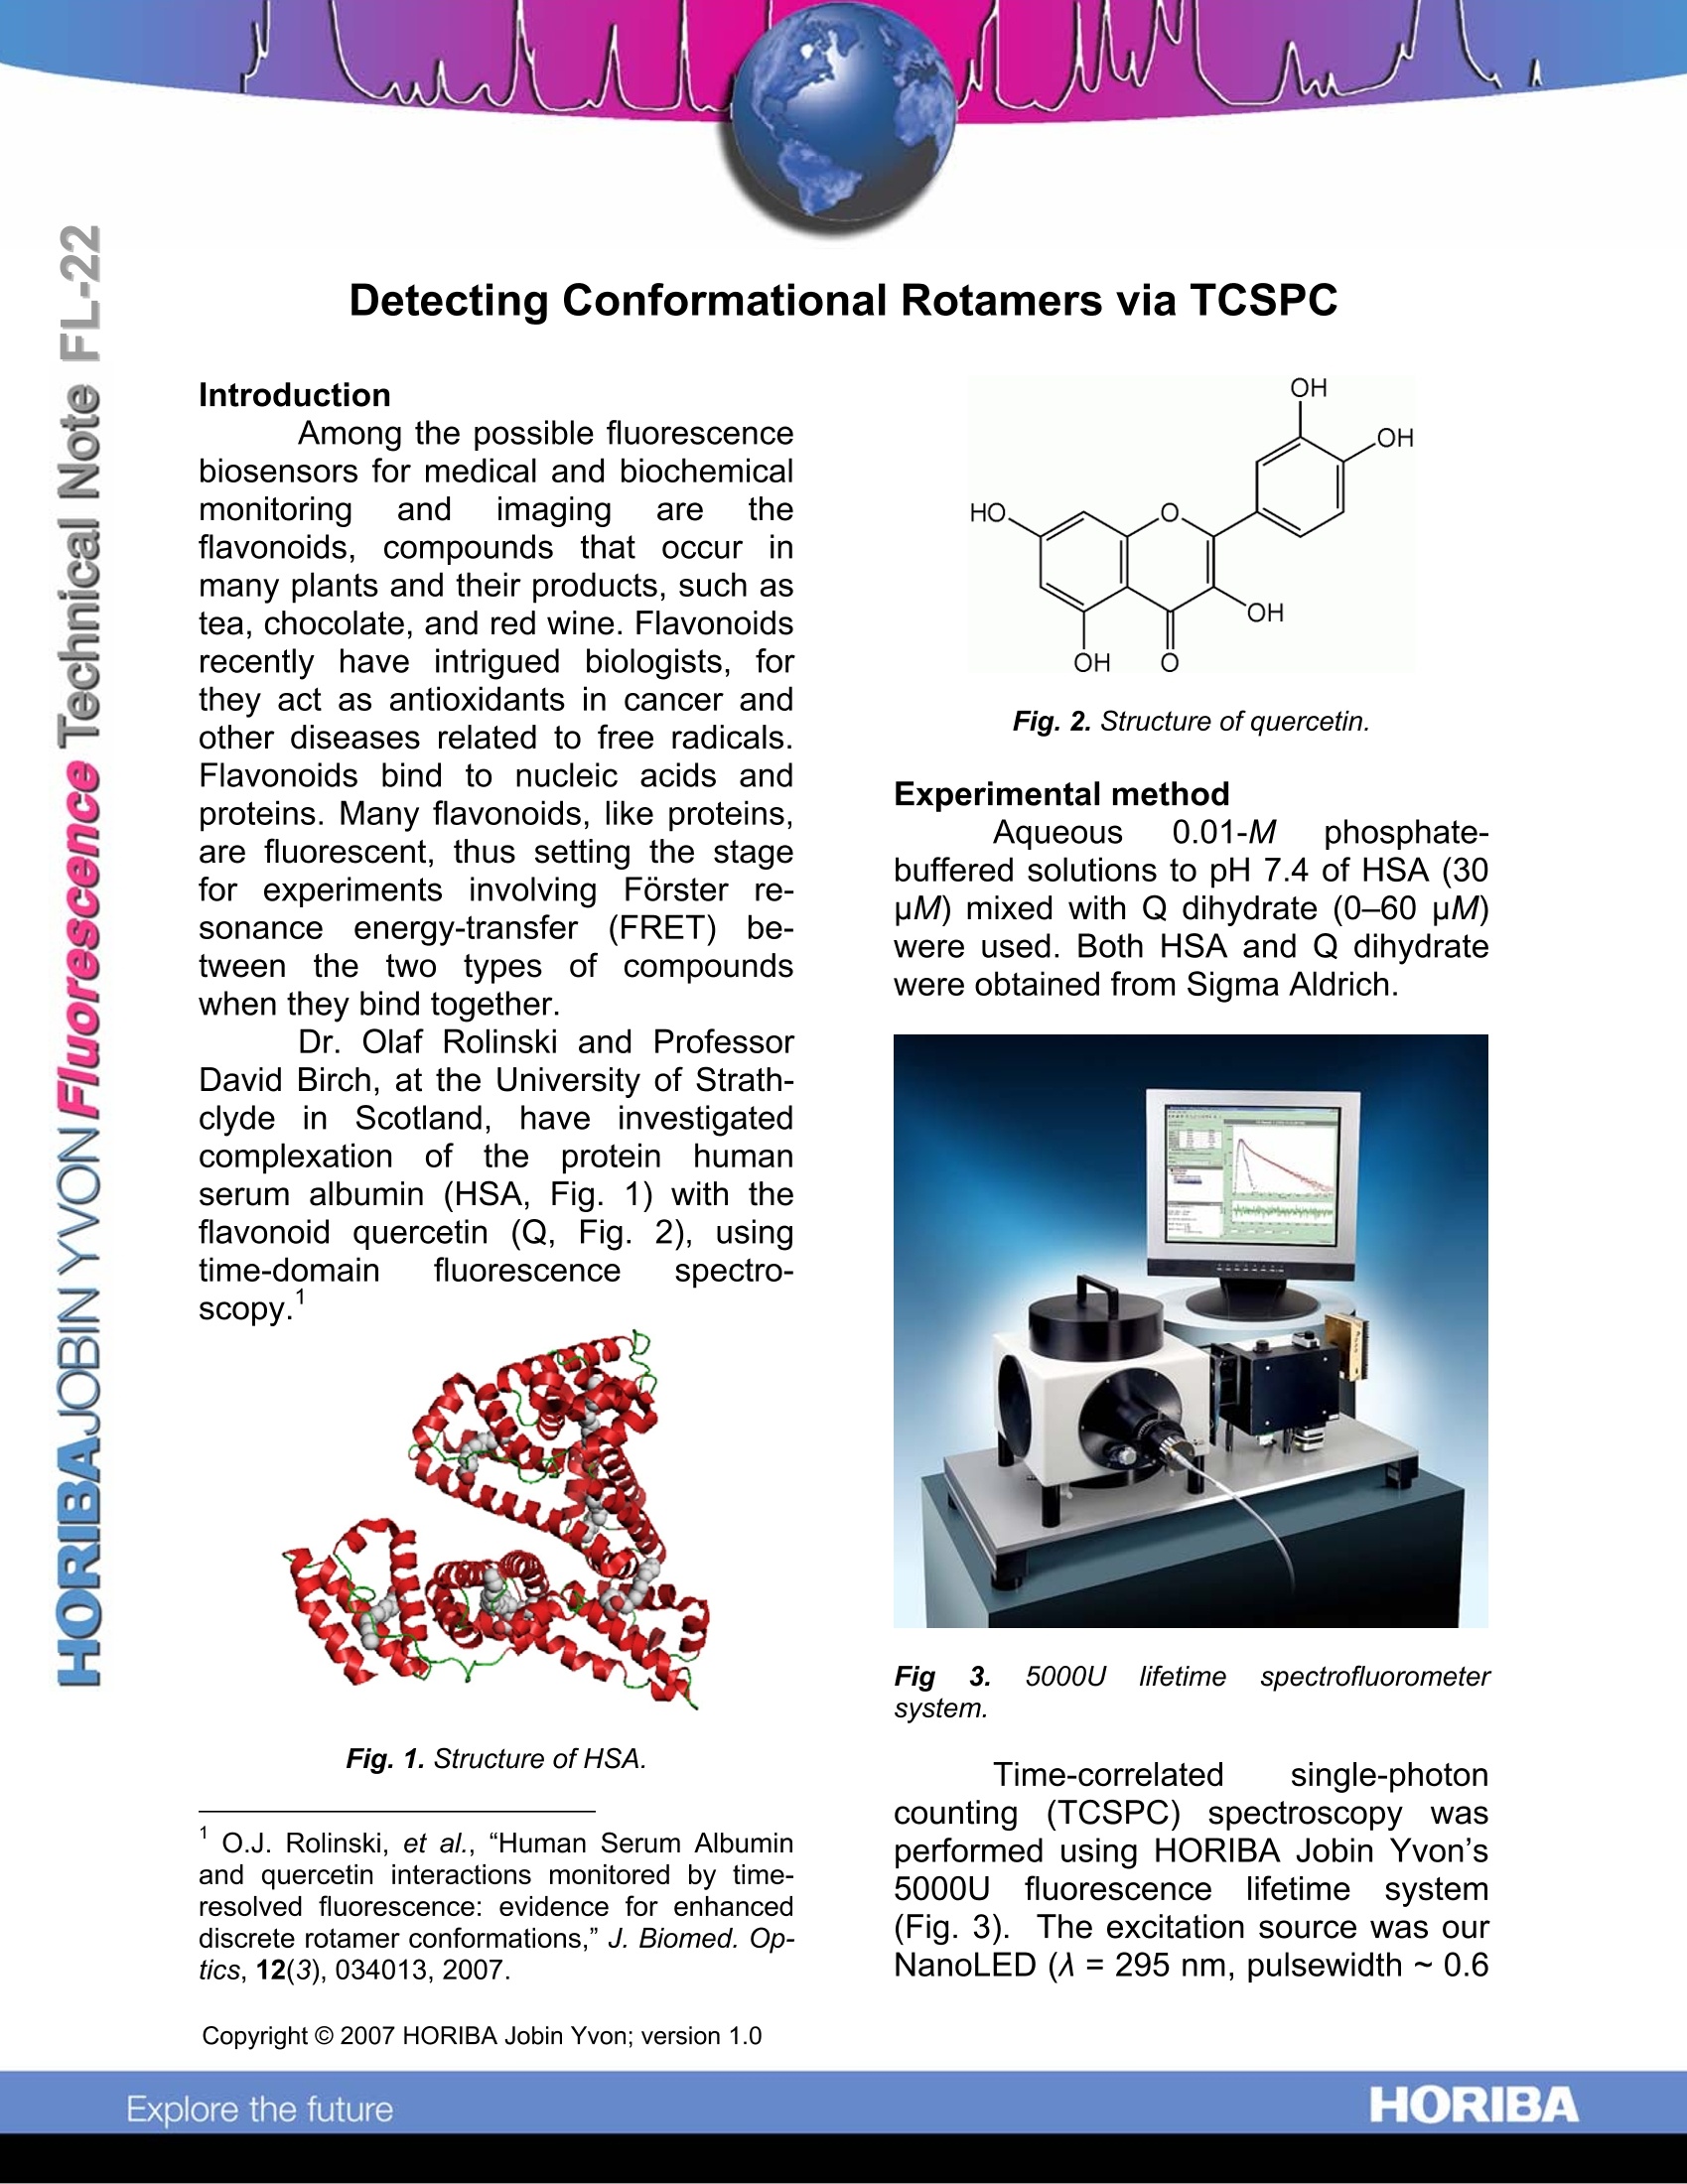
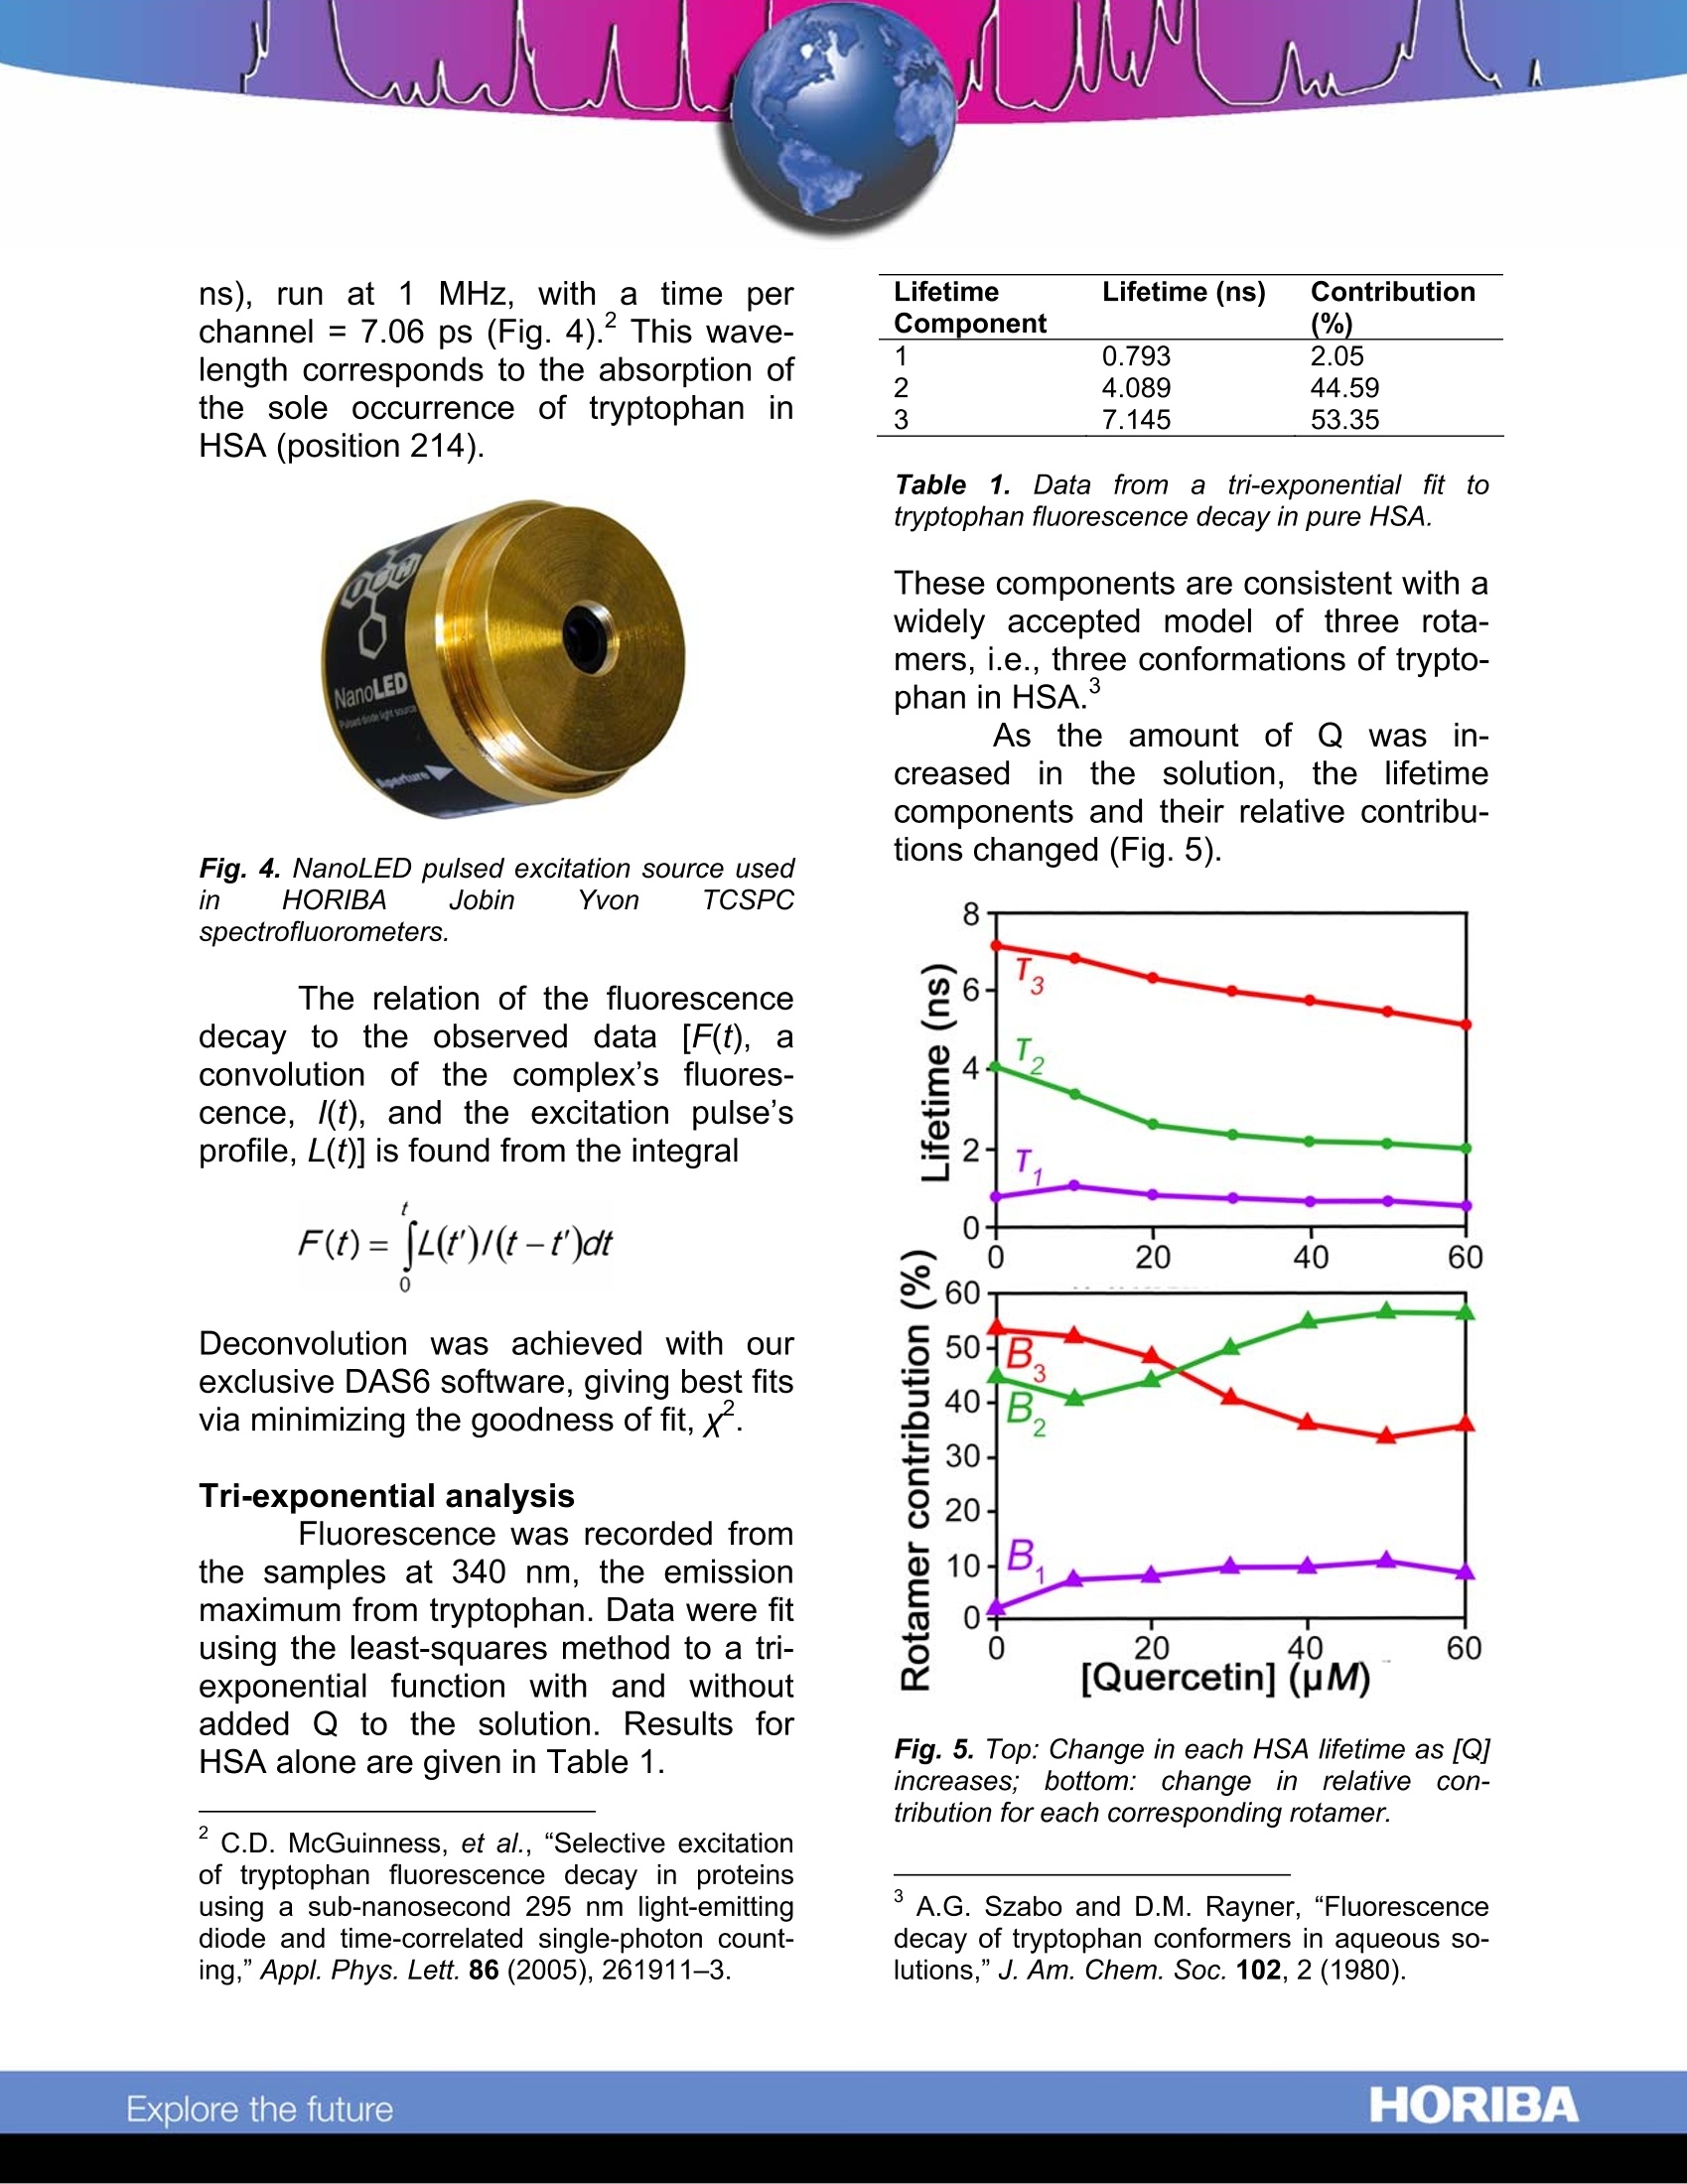
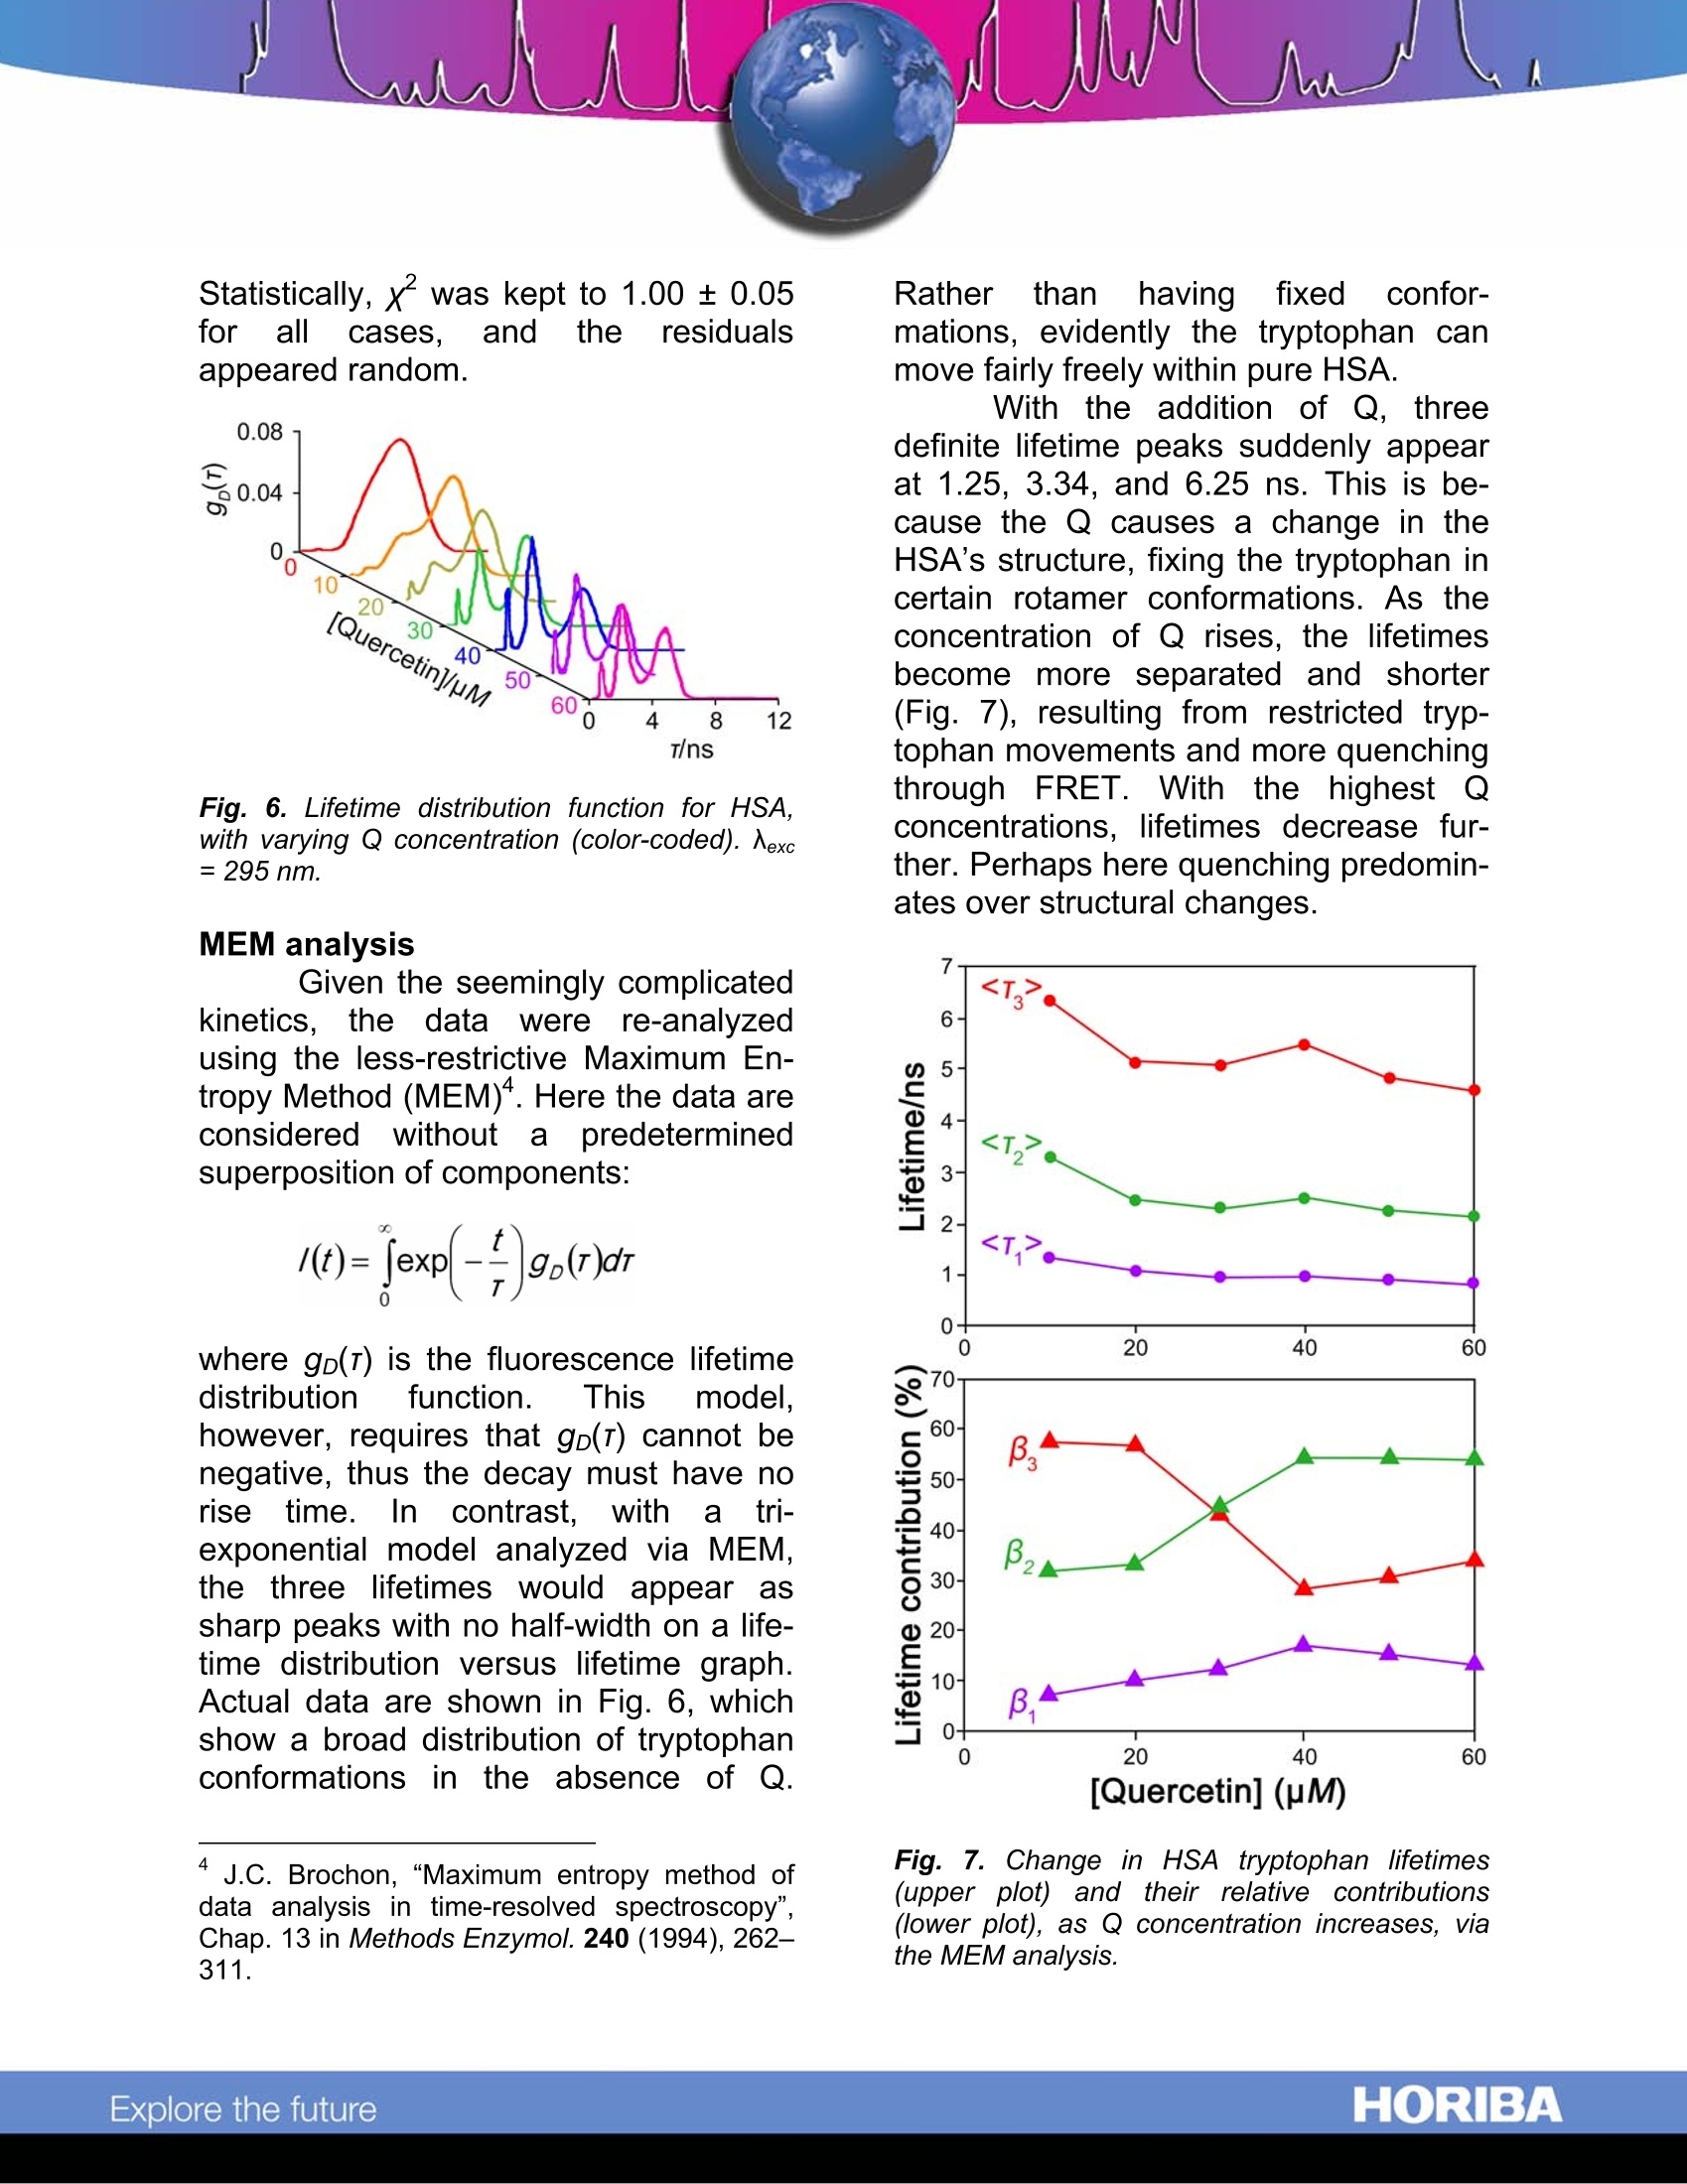
Detecting Conformational Rotamers via TCSPC Introduction Among the possible fluorescencebiosensors for medical and biochemicalmonitoring andiimaging are theflavonoids,, compounds that occur inmany plants and their products, such astea, chocolate, and red wine. Flavonoidsrecently have intrigued biologists, forthey act as antioxidants in cancer andother diseases related to free radicals.Flavonoids bind to nucleic acids andproteins. Many flavonoids, like proteins,are fluorescent, thus setting the stagefor experiments involving Forster re-Snance energy-transfer (FRET) be-tweeni the two types of compoundswhen they bind together. Dr. Olaf Rolinski and ProfessorDavid Birch, at the University of Strath-clyde in Scotland, have investigatedcomplexation of the protein humanserum albumin (HSA, Fig. 1) with theflavonoid quercetin (Q, Fig. 2), usingtime-domain fluorescence spectro-scopy. Fig. 1. Structure of HSA. ' O.J. Rolinski, et al.,“Human Serum Albuminand quercetin interactions monitored by time-resolved fluorescence:evidence for enhanceddiscrete rotamer conformations,”J. Biomed. Op-tics, 12(3),034013,2007. Fig. 2. Structure of quercetin. Experimental method Aqueous 0.01-Mphosphate-buffered solutions to pH 7.4 of HSA (30pM) mixed with Q dihydrate (0-60 pM)were used. Both HSA and Q dihydratewere obtained from Sigma Aldrich. Fig 3. 5000U lifetime spectrofluorometersystem. Time-correlated single-photoncounting (TCSPC) spectroscopy wasperformed using HORIBA Jobin Yvon’s5000U fluorescencelifetimesystem(Fig.3). The excitation source was ourNanoLED (A= 295 nm, pulsewidth ~ 0.6 ns), run at 1 MHz, with a time perchannel =7.06 ps (Fig. 4). This wave-length corresponds to the absorption ofthe sole occurrence of tryptophan inHSA (position 214). Fig. 4. NanoLED pulsed excitation source usedin HORIBA Jobin Yvon TCSPCspectrofluorometers. The relation of the fluorescencedecay to the observed data[F(t), aconvolution of the complex’s fluores-cence, /(t), and the excitation pulse’sprofile, L(t)] is found from the integral Deconvolution was achieved with ourexclusive DAS6 software, giving best fitsvia minimizing the goodness of fit, x. Tri-exponential analysis Fluorescence was recorded fromthe samples at 340 nm, the emissionmaximum from tryptophan. Data were fitusing the least-squares method to a tri-exponential function with and withoutadded Q to the solution. Results forHSA alone are given in Table 1. ‘C.D. McGuinness, et al., “Selective excitationof tryptophan fluorescence decay in proteinsusing a sub-nanosecond 295 nm light-emittingdiode and time-correlated single-photon count-ing,"Appl. Phys. Lett.86 (2005), 261911-3. Lifetime Lifetime (ns) Contribution Component (%) 1 0.793 2.05 4.089 44.59 7.145 53.35 Table 1. Data from atri-exponential fit:ttotryptophan fluorescence decay in pure HSA. These components are consistent with awidely accepted model of three rota-mers, i.e., three conformations of trypto-phan in HSA.' As the amount ofQ wasin-creased in the solution, the lifetimecomponents and their relative contribu-tions changed (Fig. 5). Fig. 5. Top: Change in each HSA lifetime as [Q]increases; bottom: change inrelativecon-tribution for each corresponding rotamer. ( A.G. Szabo a n d D . M. Rayner,“F l uorescence decay o f tryptophan conformers in aqueous so- lutions,"J. Am. Chem. Soc. 102, 2(1980). ) Statistically, x? was kept to 1.00±0.05forrallcases, andtheresidualsappeared random. Fig. 6. Lifetime distribution function for HSA,with varying Q concentration (color-coded). exc=295nm. MEM analysis Given the seemingly complicatedkinetics, the data were re-analyzedusing the less-restrictive Maximum En-tropy Method (MEM)4. Here the data areconsidered withoutaapredeterminedsuperposition of components: where gp(T) is the fluorescence lifetimedistribution function. This model.however, requires that gp(T) cannot benegative, thus the decay must have norise: time.In contrast,witha tri-exponential model analyzed via MEM,the three lifetimes would appear assharp peaks with no half-width on a life-time distribution versus lifetime graph.Actual data are shown in Fig. 6, whichshow a broad distribution of tryptophanconformationsinthe absence of Q. ( 4 J.C. Brochon , “Maximum entropy method ofdata analysis in time-resolved spectroscopy" , Chap. 13 in Methods Enzymol. 240 ( 1994), 2 62- 1311. ) Rather thanhaving fixed confor-mations, evidently the tryptophan canmove fairly freely within pure HSA. With the addition of Q, threedefinite lifetime peaks suddenly appearat 1.25, 3.34, and 6.25 ns. This is be-cause the Q causes a change in theHSA’s structure, fixing the tryptophan incertain rotamer conformations. As theconcentration of Q rises, the lifetimesbecome more separated and shorter(Fig. 7), resulting from restricted tryp-tophan movements and more quenchingthrough FRET. WWiitthh the highest Qconcentrations, lifetimes decrease fur-ther. Perhaps here quenching predomin-ates over structural changes. Fig. 7. Change in HSA tryptophan lifetimes(upper plot) and their relative contributions(lower plot), as Q concentration increases, viathe MEM analysis. Conclusions Comparison of the simple tri-exponential deconvolution with the free-torm MMEMshows thattthey arequalitatively similar for HSA-Q binding.The MEM is more sensitive to environ-mental and structural changes in the complex.. The HORIBAJobiYnvon5000U lifetime spectrofluorometer withTCSPC is an integral part of researchingstructure-property relations during pro-tein-binding studies for the biochemicaland medical fields. ( USA: H ORIBA Jobin Yvon In c ., 3 8 80 Park Avenue, Edison, NJ 08 8 20-3012, Toll-Free:+1 - 866-jobinyvon Tel: +1-732-494-8660, F ax: + 1 - 732-549-5125, E - mail: info@jobinyvon.com,www.jobinyvon.com ) ( France: H ORIBA Jobin Yvon S . A . S., 1 6-18, rue du Canal , 91165 Longjumeau Cedex, T el: +33 ( 0) 1 64 54 1 3 0 0, Fax: +33 (0) 1 69 09 9 3 1 9, w ww.jobinyvon.fr Japan: H ORIBA Ltd., J Y Optical Sales Dept, Hig a s h i-Kanda, Daij i Building, 1-7-8 Higashi-Kanda ) ( Chiyoda-ku, T okyo 1 0 1-0031, T e l:+81 (0) 3 3861 8231,w w w.jyhoriba.jp ) Copyright C HORIBA Jobin Yvon; version .HORIBAExplore the future HORIBAExplore the future Comparison of the simple triexponential deconvolution with the freeform MEM shows that they are qualitatively similar for HSA-Q binding. The MEM is more sensitive to environmental and structural changes in the complex. The HORIBA Jobin Yvon 5000U lifetime spectrofluorometer with TCSPC is an integral part of researching structure-property relations during pro-tein-binding studies for the biochemical and medical fields.
确定

还剩2页未读,是否继续阅读?

产品配置单
HORIBA(中国)为您提供《人血清白蛋白中构象旋转异构体检测方案(分子荧光光谱)》,该方案主要用于其他中构象旋转异构体检测,参考标准--,《人血清白蛋白中构象旋转异构体检测方案(分子荧光光谱)》用到的仪器有HORIBA DeltaPro超快时间分辨荧光光谱仪
相关方案
更多
该厂商其他方案
更多