


方案详情
文
We demonstrate an AlGaN light-emitting diode LED giving pulses of ?600 ps full width half maximum, 0.35 ?W average power, 0.6 mW peak power, and ?12 nm bandwidth at 295 nm. This source is ideal for protein intrinsic tryptophan ?uorescence decay research without the unwanted excitation of tyrosine and paves the way to lab-on-a-chip protein assays using ?uorescence decay times. Fluorescence decay and anisotropy decay measurements of human serum albumin are reported and the usefulness of the 295 nm LED demonstrated in comparisons with a nanosecond ?ashlamp and LEDs with nominal wavelength emission of 280 nm. © 2005 American Institute of Physics.[ DOI: 10.1063/1.1984088?]
方案详情

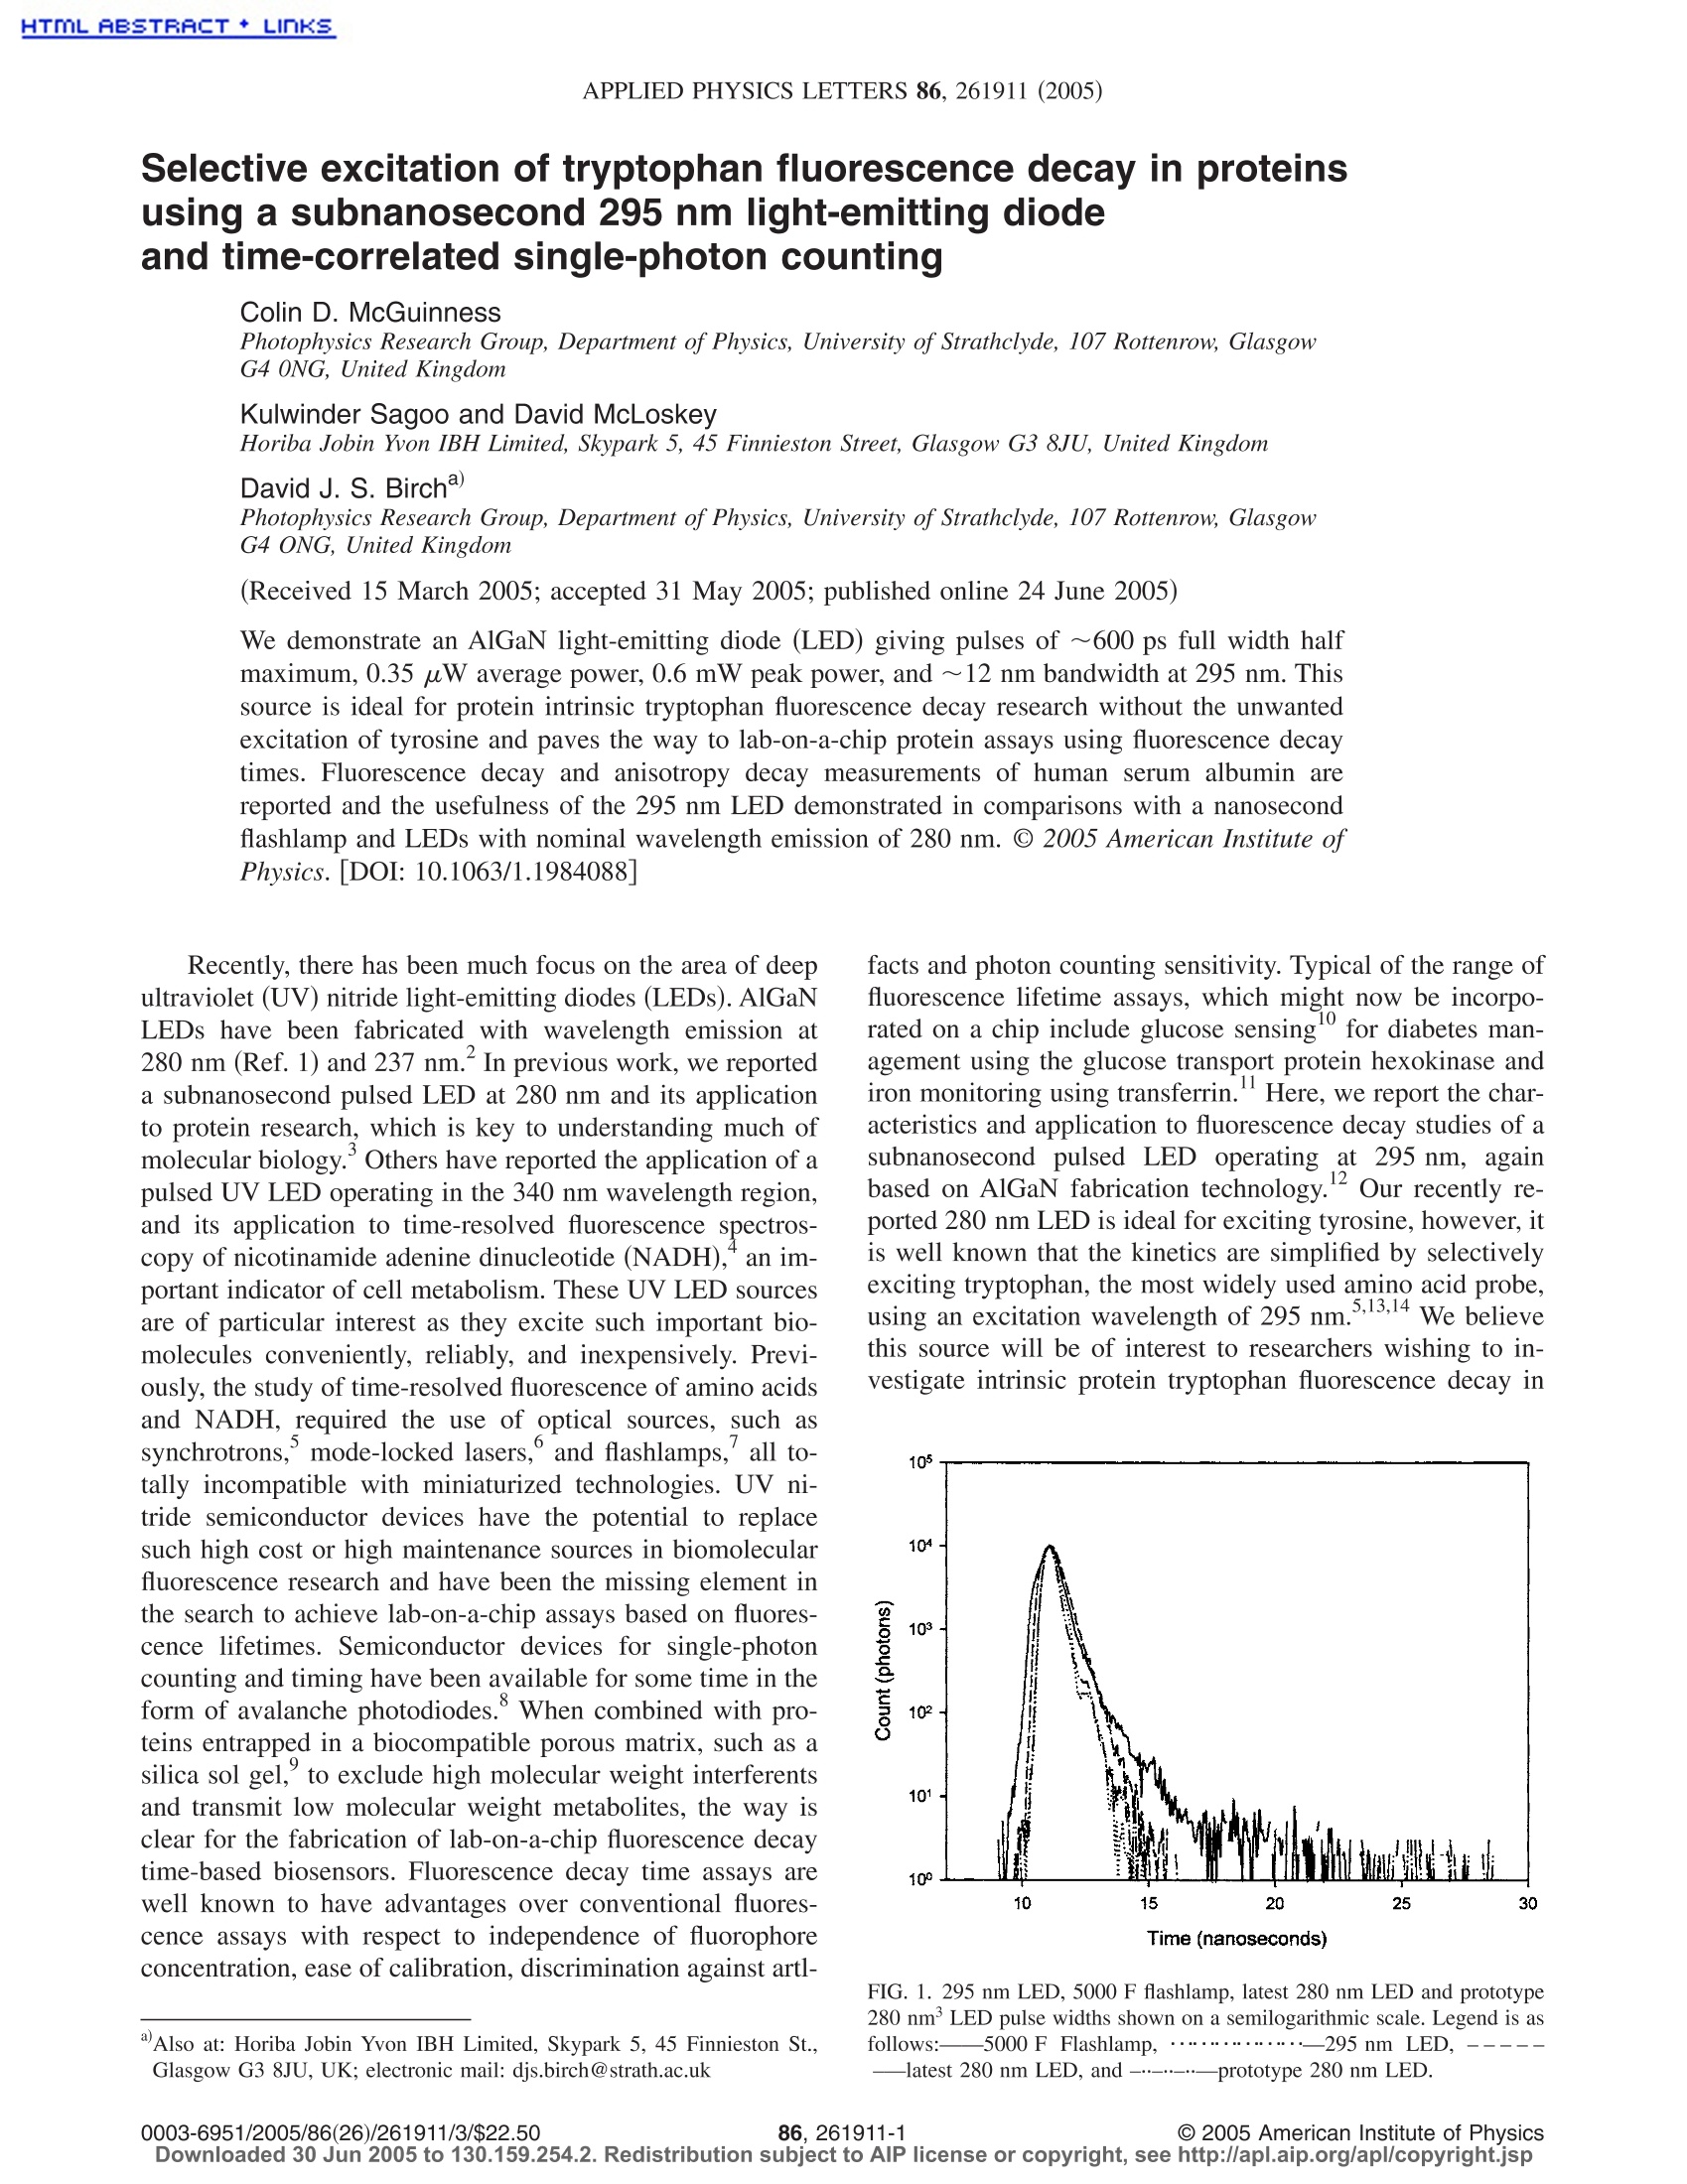
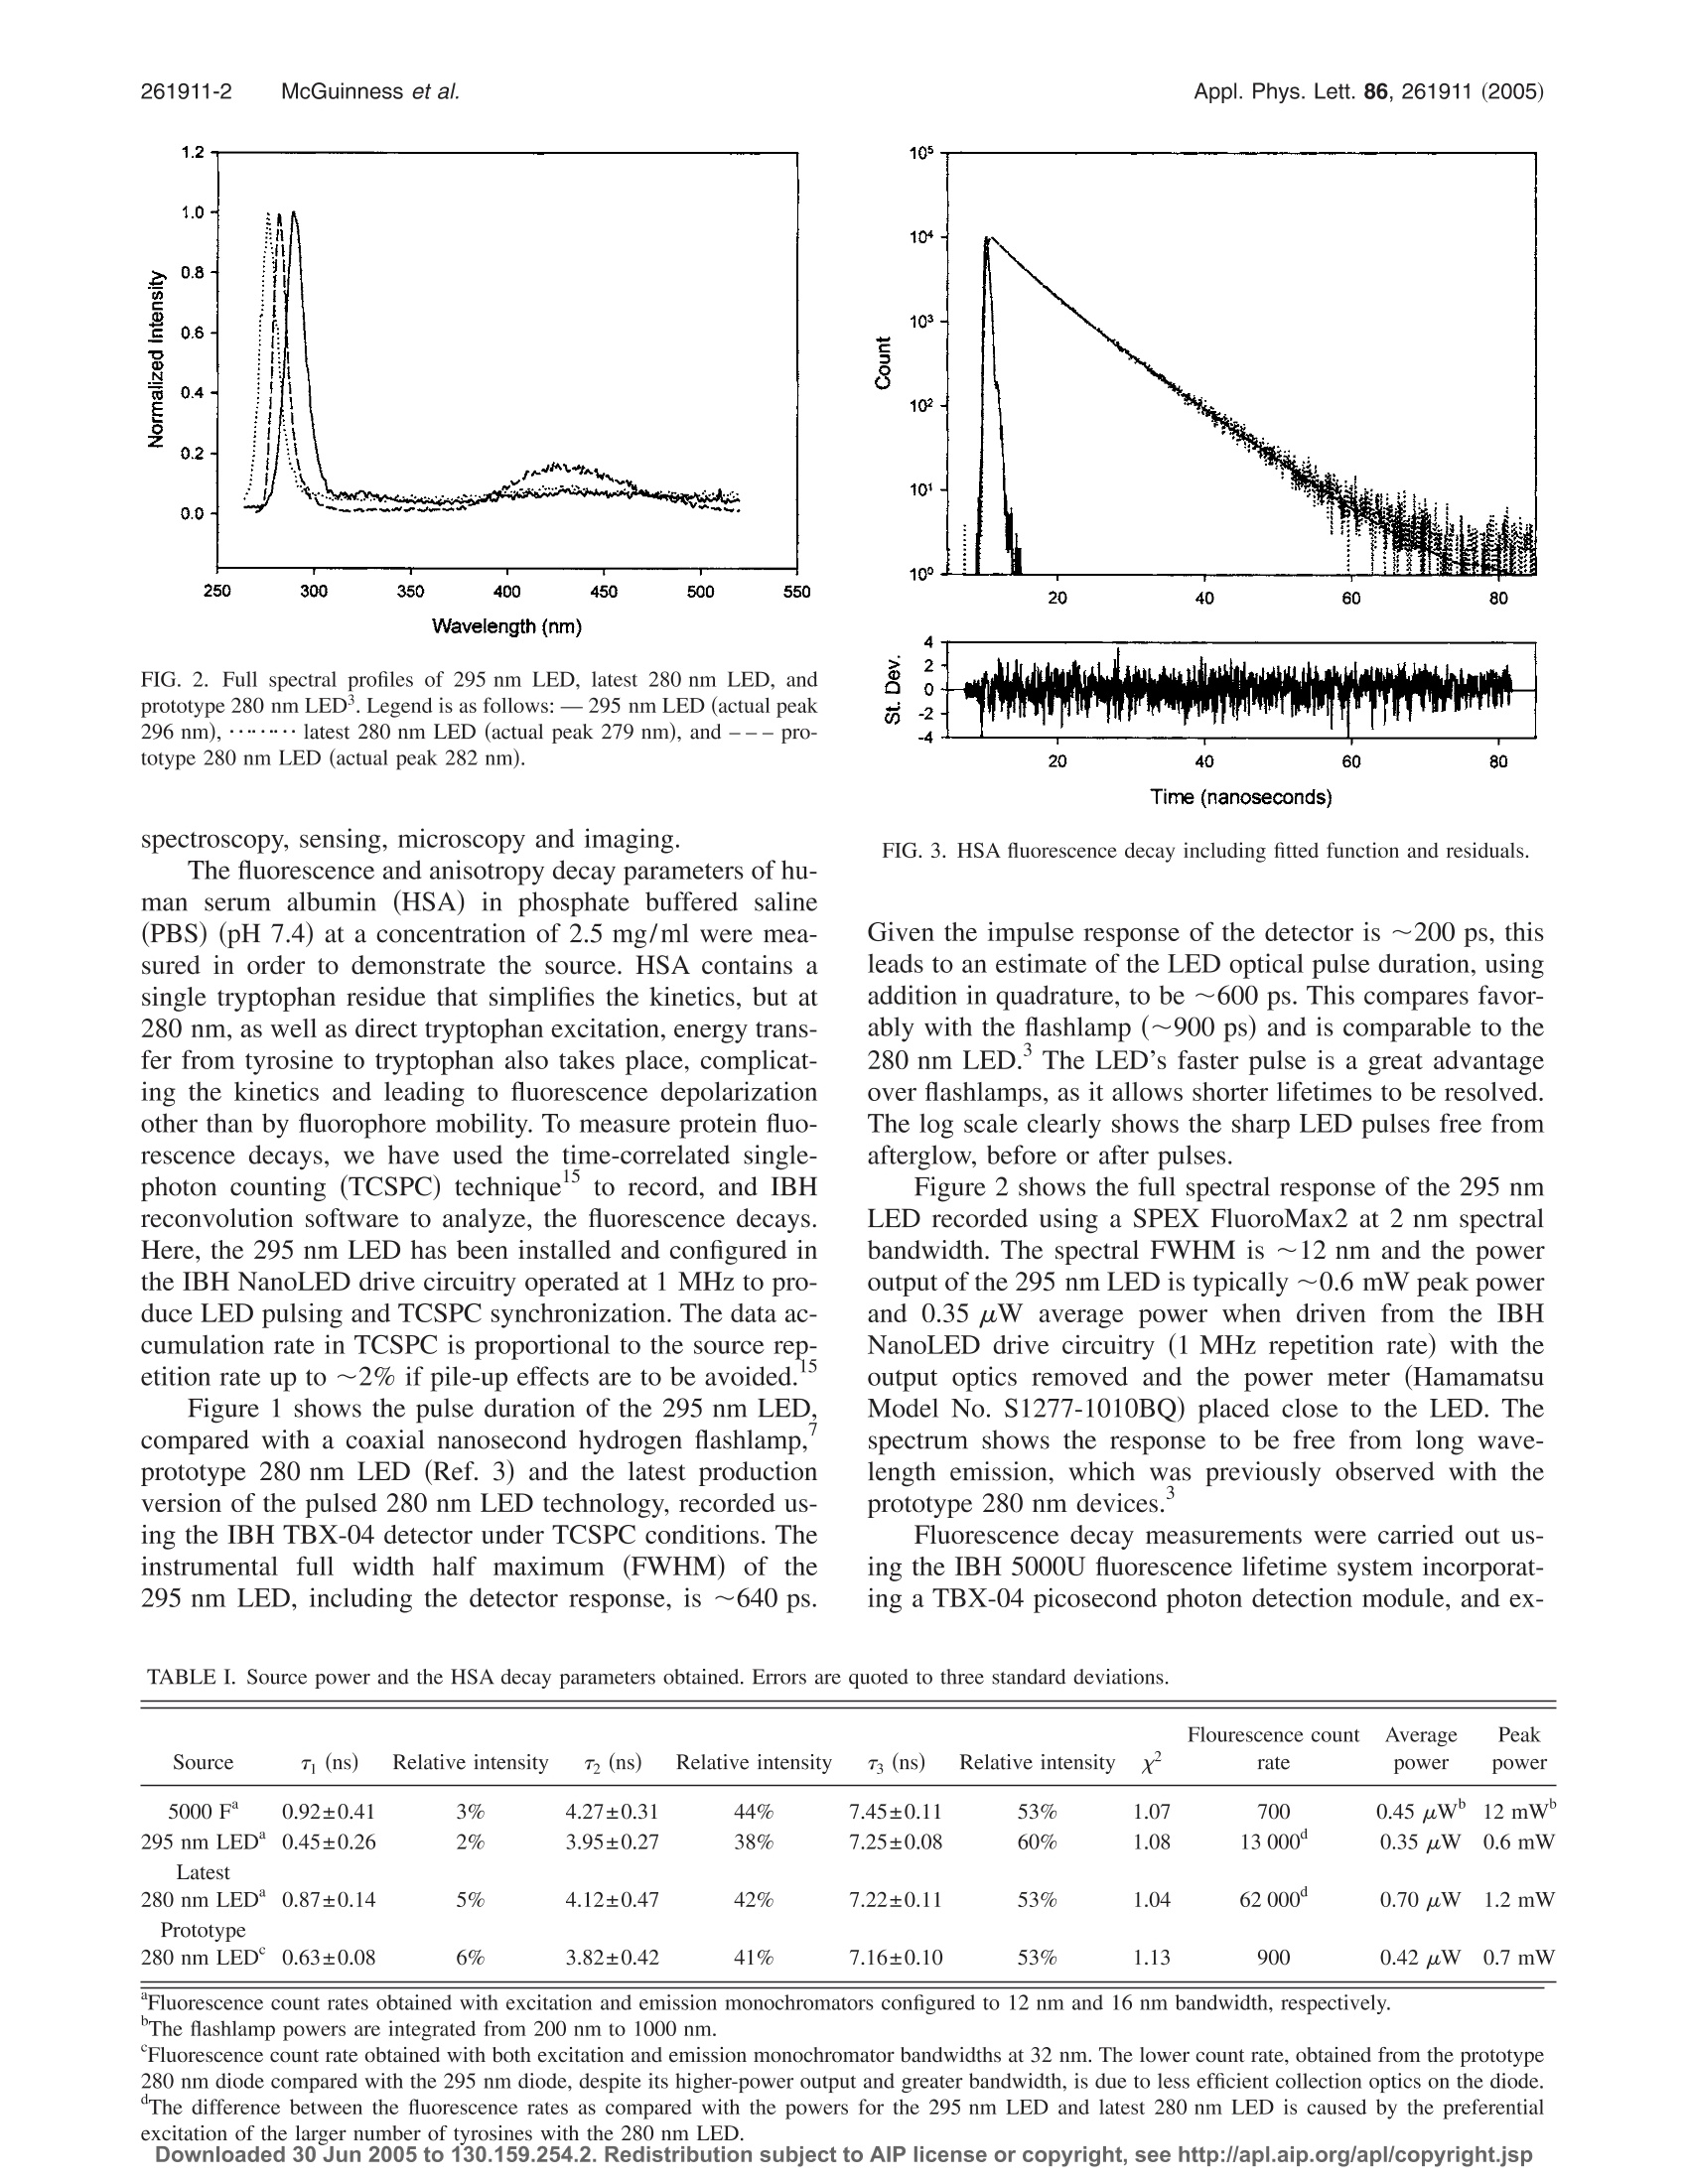
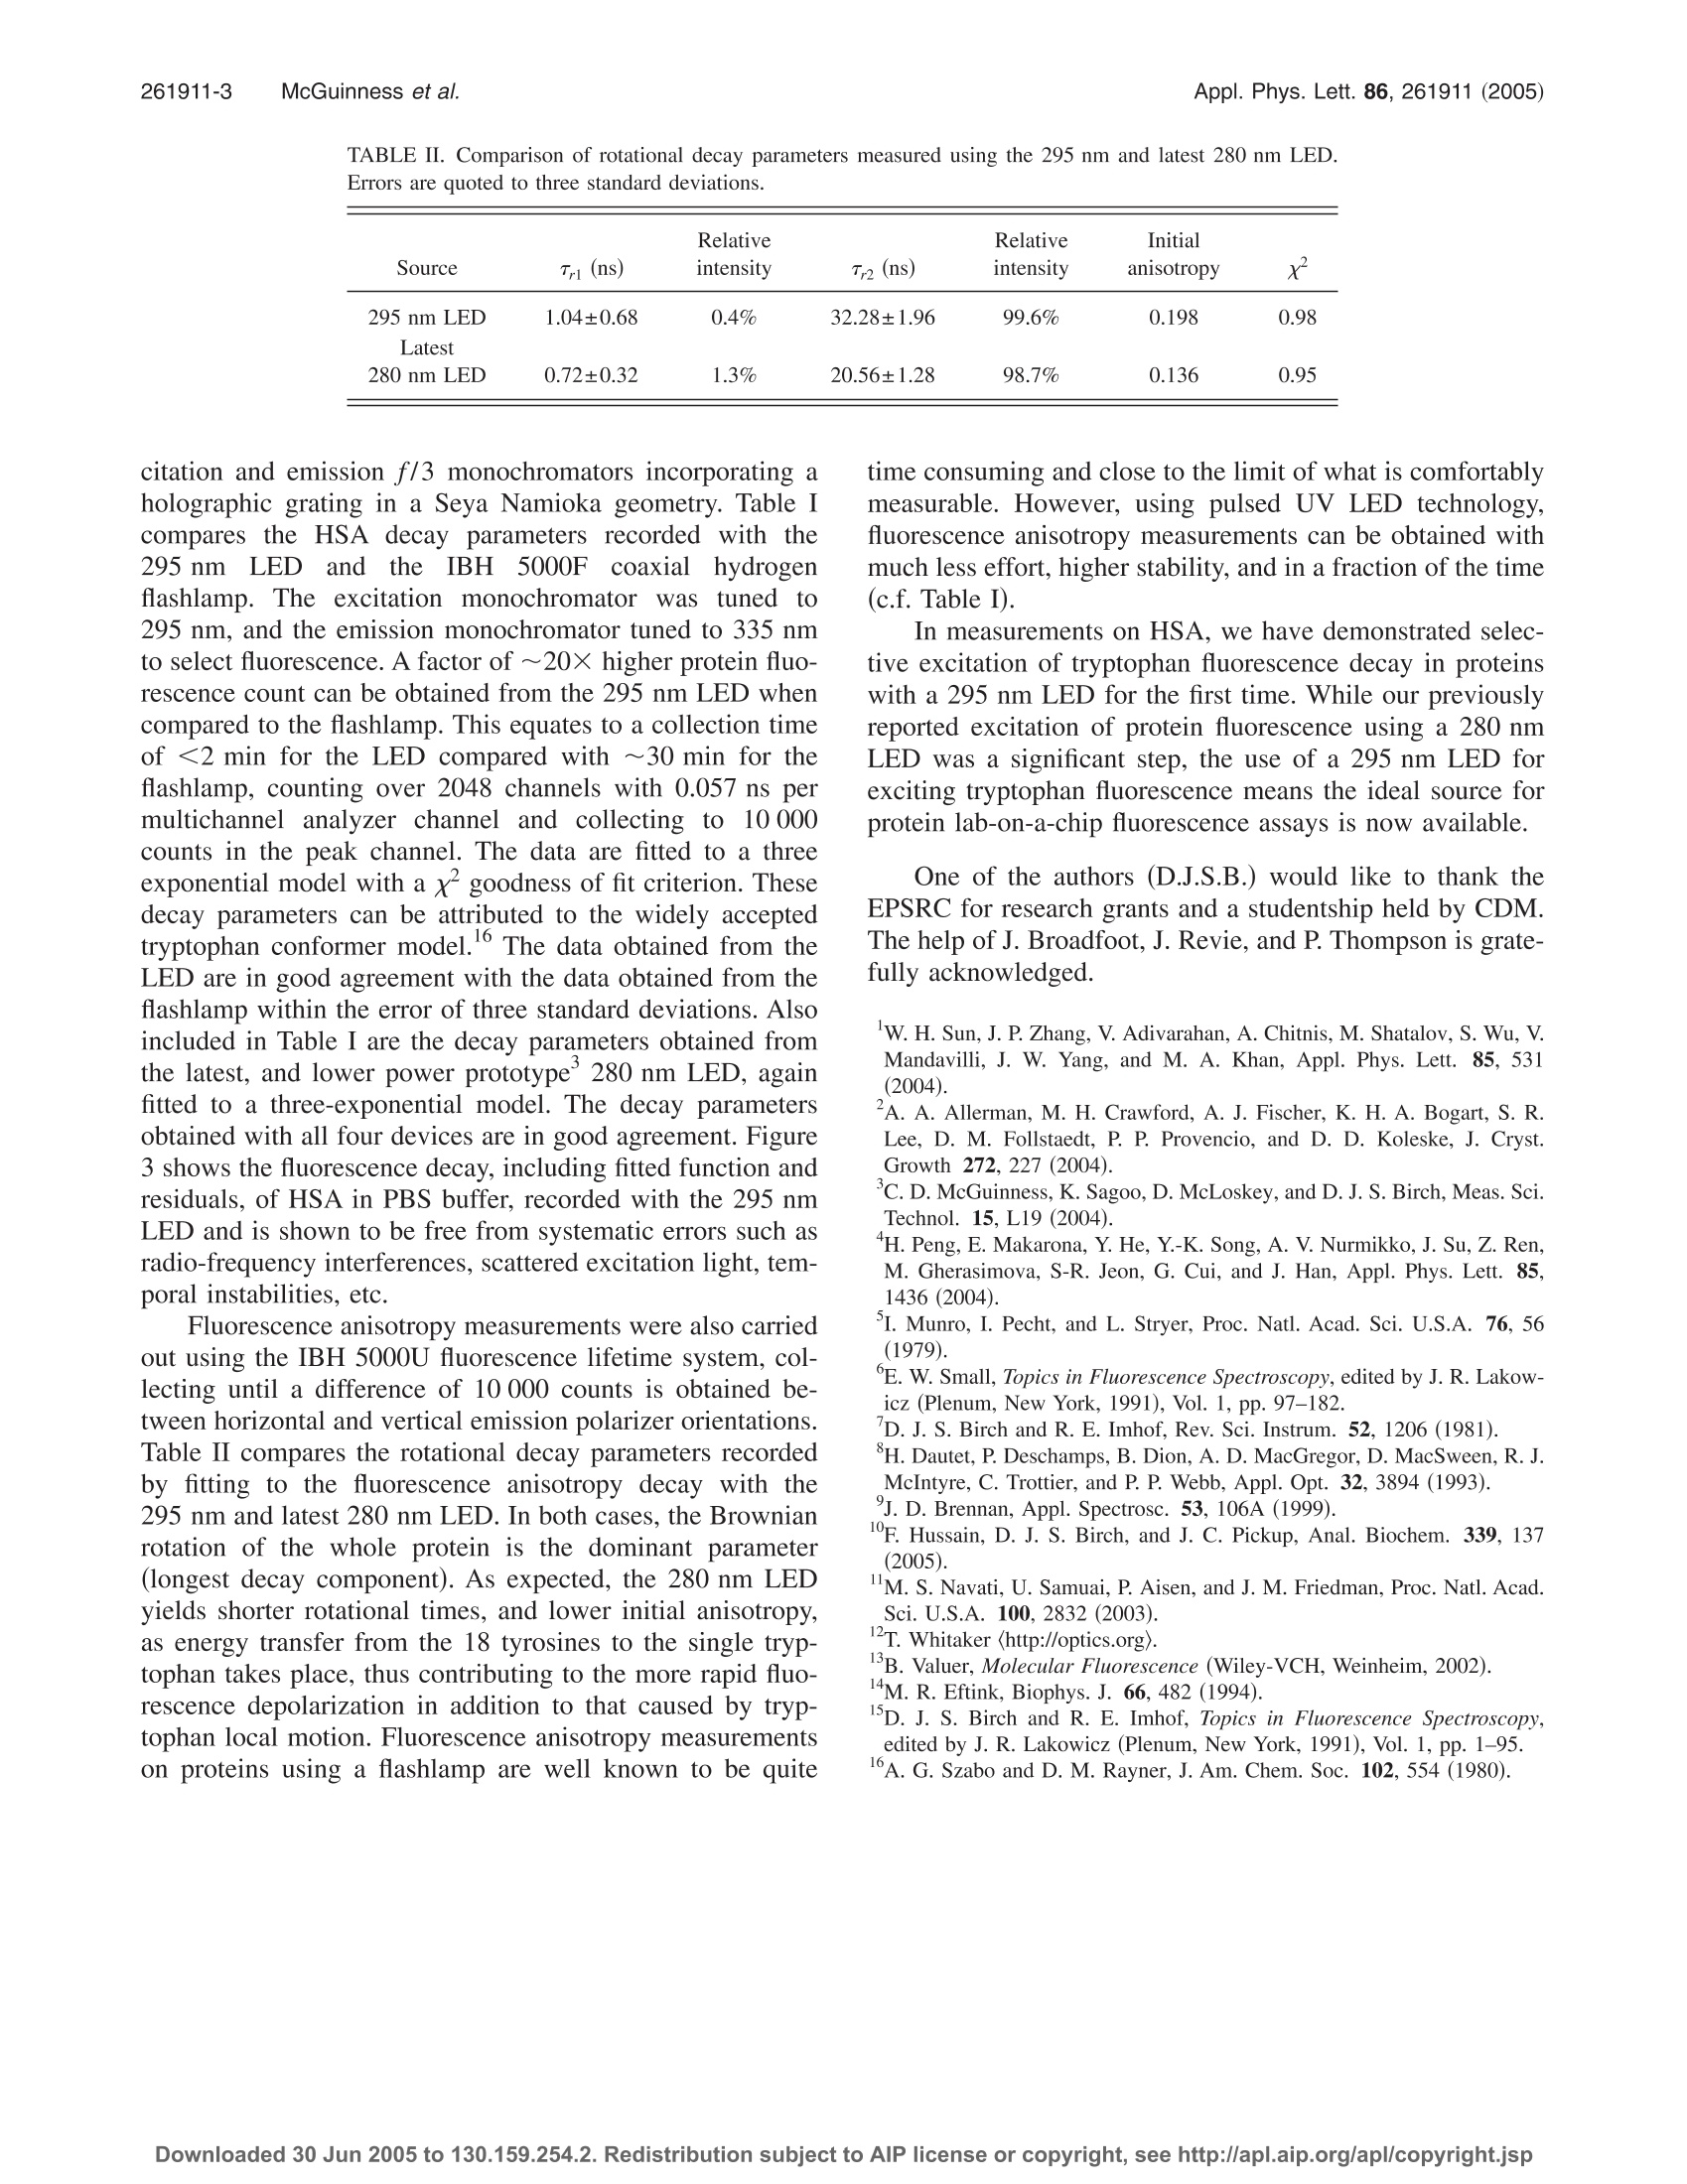
HTML RBSTRRCT+LInKSAPPLIED PHYSICS LETTERS 86, 261911 (2005) 261911-2 McGuinness et al.Appl. Phys. Lett. 86, 261911 (2005) Selective excitation of tryptophan fluorescence decay in proteinsusing a subnanosecond 295 nm light-emitting diodeand time-correlated single-photon counting Colin D. McGuinness Photophysics Research Group, Department of Physics, University of Strathclyde, 107 Rottenrow, GlasgowG4 0NG, United Kingdom Kulwinder Sagoo and David McLoskey Horiba Jobin Yvon IBH Limited, Skypark 5, 45 Finnieston Street, Glasgow G3 8JU, United Kingdom David J. S. Birchd Photophysics Research Group, Department of Physics, University of Strathclyde, 107 Rottenrow, GlasgowG4 ONG, United Kingdom (Received 15 March 2005; accepted 31 May 2005; published online 24 June 2005) We demonstrate an AlGaN light-emitting diode (LED) giving pulses of ~600 ps full width halfmaximum, 0.35 uW average power, 0.6 mW peak power, and ~12 nm bandwidth at 295 nm. Thissource is ideal for protein intrinsic tryptophan fluorescence decay research without the unwantedexcitation of tyrosine and paves the way to lab-on-a-chip protein assays using fluorescence decaytimes. Fluorescence decay and anisotropy decay measurements of human serum albumin arereported and the usefulness of the 295 nm LED demonstrated in comparisons with a nanosecondflashlamp and LEDs with nominal wavelength emission of 280 nm. @ 2005 American Institute ofPhysics. [DOI: 10.1063/1.1984088] Recently, there has been much focus on the area of deepultraviolet (UV) nitride light-emitting diodes (LEDs). AlGaN1ngLEDs have been fabricated with wavelength emission at280 nm (Ref. 1) and 237 nm. In previous work, we reporteda subnanosecond pulsed LED at 280 nm and its applicationto protein research, which is key to understanding much ofmolecular biology.Others have reported the application of apulsed UV LED operating in the 340 nm wavelength region,and its application to time-resolved fluorescence spectros-copy of nicotinamide adenine dinucleotide (NADH),an im-portant indicator of cell metabolism. These UV LED sourcesare of particular interest as they excite such important bio-molecules conveniently, reliably, and inexpensively. Previ-ously, the study of time-resolved fluorescence of amino acidsand NADH, required the use of optical sources, such assynchrotrons, mode-locked lasers, and flashlamps, all to-tally incompatible with miniaturized technologies. UV ni-tride semiconductor devices have the potential to replacesuch high cost or high maintenance sources in biomolecularfluorescence research and have been the missing element inthe search to achieve lab-on-a-chip assays based on fluores-cence lifetimes. Semiconductor devices for single-photoncounting and timing have been available for some time in theform of avalanche photodiodes.’ When combined with pro-teins entrapped in a biocompatible porous matrix, such as asilica sol gel, to exclude high molecular weight interferentsand transmit low molecular weight metabolites, the way isclear for the fabrication of lab-on-a-chip fluorescence decaytime-based biosensors. Fluorescence decay time assays arewell known to have advantages over conventional fluores-cence assays with respect to independence of fluorophoreconcentration, ease of calibration, discrimination against artl- ( Also a t : Horiba J o bin Yvon IB H Limited, Skypark 5, 45 Finnieston St. , Glasgow G 3 8J U , UK; e lectronic mai l : djs.birch@strath.ac.uk ) facts and photon counting sensitivity. Typical of the range offluorescence lifetime assays, which might now be incorpo-rated on a chip include glucose sensingfor diabetes man-agement using the glucose transport protein hexokinase andiron monitoring using transferrin.Here, we report the char-acteristics and application to fluorescence decay studies of asubnanosecond pulsed LED operating at 295 nm, againbased on AlGaN fabrication technology. O,ur1 2Qurrecently re-ported 280 nm LED is ideal for exciting tyrosine, however, itis well known that the kinetics are simplified by selectivelyexciting tryptophan, the most widely used amino acid probe,using an excitation wavelength of 295 nm. ,13,14 We believethis source will be of interest to researchers wishing to in-vestigate intrinsic protein tryptophan fluorescence decay in FIG. 1. 295 nm LED, 5000 F flashlamp, latest 280 nm LED and prototype280 nm’LED pulse widths shown on a semilogarithmic scale. Legend is asfollows:5000 F Flashlamp,.... .295 nm LED, --—latest 280 nm LED, and-..prototype 280 nm LED. Wavelength (nm) FIG. 2. Full spectral profiles of 295 nm LED, latest 280 nm LED, andprototype 280 nm LED. Legend is as follows:- 295 nm LED (actual peak296 nm),……. latest 280 nm LED (actual peak 279 nm), and--- pro-totype 280 nm LED (actual peak 282 nm). spectroscopy, sensing, microscopy and imaging. The fluorescence and anisotropy decay parameters of hu-man serum albumin (HSA) in phosphate buffered saline(PBS) (pH 7.4) at a concentration of 2.5 mg/ml were mea-sured in order to demonstrate the source. HSA contains asingle tryptophan residue that simplifies the kinetics, but at280 nm, as well as direct tryptophan excitation, energy trans-fer from tyrosine to tryptophan also takes place, complicat-ing the kinetics and leading to fluorescence depolarizationother than by fluorophore mobility. To measure protein fluo-rescence decays, we have used the time-correlated single-photon counting (TCSPC) techniqueto record, and IBHreconvolution software to analyze, the fluorescence decays.Here, the 295 nm LED has been installed and configured inthe IBH NanoLED drive circuitry operated at 1 MHz to pro-duce LED pulsing and TCSPC synchronization. The data ac-cumulation rate in TCSPC is proportional to the source rep-etition rate up to ~2% if pile-up effects are to be avoided.15 Figure 1 shows the pulse duration of the 295 nm LED,compared with a coaxial nanosecond hydrogen flashlamp,prototype 280 nm LED (Ref. 3) and the latest productionversion of the pulsed 280 nm LED technology, recorded us-ing the IBH TBX-04 detector under TCSPC conditions. Theinstrumental full width half maximum (FWHM) of the295 nm LED, including the detector response, is ~640 ps. Time (nanoseconds) FIG. 3. HSA fluorescence decay including fitted function and residuals. Given the impulse response of the detector is ~200 ps, thisleads to an estimate of the LED optical pulse duration, usingaddition in quadrature, to be ~600 ps. This compares favor-ably with the flashlamp (~900 ps) and is comparable to the280 nm LED.’ The LED’s faster pulse is a great advantageover flashlamps, as it allows shorter lifetimes to be resolved.The log scale clearly shows the sharp LED pulses free fromafterglow, before or after pulses. Figure 2 shows the full spectral response of the 295 nmLED recorded using a SPEX FluoroMax2 at 2 nm spectralbandwidth. The spectral FWHM is ~12 nm and the poweroutput of the 295 nm LED is typically ~0.6 mW peak powerand 0.35 uW average power when driven from the IBHNanoLED drive circuitry (1 MHz repetition rate) with theoutput optics removed and the power meter (HamamatsuModel No. S1277-1010BQ) placed close to the LED. Thespectrum shows the response to be free from long wave-length emission, which wasi Spreviously observed with theprototype 280 nm devices. Fluorescence decay measurements were carried out us-ing the IBH 5000U fluorescence lifetime system incorporat-ing a TBX-04 picosecond photon detection module, and ex- TABLE I. Source power and the HSA decay parameters obtained. Errors are quoted to three standard deviations. Flourescence count Average Peak Source T (ns) Relative intensity 72 (ns) Relative intensity r3 (ns) Relative intensity x2 rate power power 5000 F 0.92±0.41 3% 4.27±0.31 44% 7.45±0.11 53% 1.07 700 0.45 uw 12 mW 295 nm LED°0.45±0.26 2% 3.95±0.27 38% 7.25±0.08 60% 1.08 13000° 0.35 uW 0.6 mW Latest 280 nm LED 0.87±0.14 5% 4.12±0.47 42% 7.22±0.11 53% 1.04 62 000 0.70 uW 1.2mW Prototype 280 nm LED°0.63±0.08 6% 3.82±0.42 41% 7.16±0.10 53% 1.13 900 0.42 uW 0.7 mW ( “ Fluorescence count r a tes o btained with e x citation and emission monochromators conf i gured to 12 nm and 16 nm b an d wid t h, respecti v ely.T h e f l ashlamp p o wers are i n tegrated f rom 200 nm to 1 0 00 nm. ) ( Fluorescence c o unt rate o btained with b oth e xcitation and emission monochromator b a ndwidths at 32 nm. The lo w er co u nt ra t e, obtained from t h e prototype ) 280 nm diode compared with the 295 nm diode, despite its higher-power output and greater bandwidth, is due to less efficient collection optics on the diode.“The difference between the fluorescence rates as compared with the powers for the 295 nm LED and latest 280 nm LED is caused by the preferentialexcitation of the larger number of tyrosines with the 280 nm LED. ( D ow nl o ade d 3 0 Jun 2 0 05 t o 13 0 . 1 59 . 25 4 . 2 . R edis t rib ut io n su bj e ct t o A I P l ic e nse o r c op y r i gh t, see h t t p: // apl.aip. o r g/a pl / co py r ight.jsp ) TABLE Ⅱ. Comparison of rotational decay parameters measured using the 295 nm and latest 280 nm LED.Errors are quoted to three standard deviations. Relative Relative Initial Source T, (ns) intensity Tr2 (ns) intensity anisotropy 295 nm LED 1.04±0.68 0.4% 32.28±1.96 99.6% 0.198 0.98 Latest 280 nm LED 0.72±0.32 1.3% 20.56±1.28 98.7% 0.136 0.95 citation and emission f/3 monochromators incorporating aholographic grating in a Seya Namioka geometry. Table Icompares the HSA decay parameters recorded with the295 nm LED and the IBH 5000Fcoaxial hydrogenflashlamp. The excitation monochromator was tuned to295 nm, and the emission monochromator tuned to 335 nmto select fluorescence. A factor of~20× higher protein fluo-rescence count can be obtained from the 295 nm LED whencompared to the flashlamp. This equates to a collection timeof <2 min for the LED compared with ~30 min for theflashlamp, counting over 2048 channels with 0.057 ns permultichannel analyzer channel and collecting to 10 000counts in the peak channel. The data are fitted to a threeexponential model with a xgoodness of fit criterion. Thesedecay parameters can be attributed to the widely acceptedtryptophan conformer model. The data obtained from theLED are in good agreement with the data obtained from theflashlamp within the error of three standard deviations. Alsoincluded in Table I are the decay parameters obtained fromthe latest, and lower power prototype’280 nm LED, againfitted to a three-exponential model. The decay parametersobtained with all four devices are in good agreement. Figure3 shows the fluorescence decay, including fitted function andresiduals, of HSA in PBS buffer, recorded with the 295 nmLED and is shown to be free from systematic errors such asradio-frequency interferences, scattered excitation light, tem-poral instabilities, etc. Fluorescence anisotropy measurements were also carriedout using the IBH 5000U fluorescence lifetime system, col-lecting until a difference of 10 000 counts is obtained be-tween horizontal and vertical emission polarizer orientations.Table II compares the rotational decay parameters recordedby fitting to the fluorescence anisotropy decay with the295 nm and latest 280 nm LED. In both cases, the Brownianrotation of the whole protein is the dominant parameter(longest decay component). As expected, the 280 nm LEDyields shorter rotational times, and lower initial anisotropy,as energy transfer from the 18 tyrosines to the single tryp-tophan takes place, thus contributing to the more rapid fluo-rescence depolarization in addition to that caused by tryp-tophan local motion. Fluorescence anisotropy measurementson proteins using a flashlamp are well known to be quite time consuming and close to the limit of what is comfortablymeasurable. However, using pulsed UV LED technology,fluorescence anisotropy measurements can be obtained withmuch less effort, higher stability, and in a fraction of the time(c.f. Table Ⅰ). In measurements on HSA, we have demonstrated selec-tive excitation of tryptophan fluorescence decay in proteinswith a 295 nm LED for the first time. While our previouslyreported excitation of protein fluorescence using a 280 nmLED was a significant step, the use of a 295 nm LED forexciting tryptophan fluorescence means the ideal source forprotein lab-on-a-chip fluorescence assays is now available. One of the authors (D.J.S.B.) would like to thank theEPSRC for research grants and a studentship held by CDM.The help of J. Broadfoot, J. Revie, and P. Thompson is grate-fully acknowledged. W. H. Sun, J. P. Zhang, V. Adivarahan, A. Chitnis, M. Shatalov, S. Wu, V.Mandavilli, J. W. Yang, and M. A. Khan, Appl. Phys. Lett. 85, 531(2004). ( A. A. Allerman,M. H. Cr a wford, A. J. Fi s cher, K . H . A . B o gart, S. R. L e e, D . M . F o llstaedt, P. P. P rovencio, a n d D. D. Kol e ske, J. C ry s t. Growth 272, 227 (2004). ) ( C. D .McGuinness,K. Sagoo, D. McLoskey, and D. J. S. Birch, M eas. Sci. Technol. 1 5, L 19 (2004). ) ( "H. Peng, E . Makarona, Y. H e , Y . - K . Song, A. V. N u rmikko, J. S u , Z. Ren,M. Gherasimova, S-R. Je o n, G. Cu i , an d J. Ha n , Appl. Phys. Let t . 85, 1436 (2004). ) ( I . M unro, I . P echt, and L . S tryer,Proc. N atl. Acad. S ci. U .S.A. 7 6, 56 (1979) ) ( E. W. Small, Topics in Fluorescence S pectroscopy, edited by J. R. Lakow- i cz (Plenum, New York, 1991), V ol. 1, pp. 97-182. ) ( ' D. J. S. Birch and R . E. I mhof, Rev. Sci. Instrum. 5 2 , 1 2 06 (1 9 81). ) ( °H. Dautet, P. Deschamps, B. Dion, A. D. MacGregor, D. MacSween,R. J. M cIntyre, C . T rottier, and P . P. Webb, Appl. Opt. 32 , 3894 (1993). ) ( J . D. Brennan, Appl. S p ectrosc. 53, 1 0 6A (1999). ) ( F. Hussain, D. J . S . B irch, and J. C. Pickup, Anal. Biochem. 3 39, 1 37 (2005). ) ( "M. S . Navati, U. Samuai, P . Aisen, and J. M . Friedman, Proc. N a tl. Acad. Sci. U.S.A. 1 00, 2832 (2003). ) ( T . W h itaker (http://optics.org). ) ( B. V a luer, Molecular Fluorescence (Wiley-VCH, Weinheim, 2002). ) ( M . R. Ef t ink, Biophys. J. 66, 482 (1 9 94). ) ( D . J . S. Bi r ch and R. E. Im h of, To p ics in Fluorescence Spectroscopy, edited by J . R . Lakowicz (Plenum, Ne w York , 1991 ) , Vol. 1, p p . 1 -95. A . G . Szabo and D. M. Ra y ner, J. A m . Chem. Soc. 10 2 , 554 (1980). ) C American Institute of Physics/$ownloaded Jun to Redistribution subject to AlP license or copyright, see http://apl.aip.org/apl/copyright.jsp We demonstrate an AlGaN light-emitting diode LED giving pulses of ϳ600 ps full width half maximum, 0.35 W average power, 0.6 mW peak power, and ϳ12 nm bandwidth at 295 nm. This source is ideal for protein intrinsic tryptophan fluorescence decay research without the unwanted excitation of tyrosine and paves the way to lab-on-a-chip protein assays using fluorescence decay times. Fluorescence decay and anisotropy decay measurements of human serum albumin are reported and the usefulness of the 295 nm LED demonstrated in comparisons with a nanosecond flashlamp and LEDs with nominal wavelength emission of 280 nm. © 2005 American Institute of Physics.[ DOI: 10.1063/1.1984088͔]
确定
还剩1页未读,是否继续阅读?

产品配置单
HORIBA(中国)为您提供《蛋白质中色氨酸荧光衰减的选择性激发(LED)检测方案(分子荧光光谱)》,该方案主要用于其他中色氨酸荧光衰减的选择性激发(LED)检测,参考标准--,《蛋白质中色氨酸荧光衰减的选择性激发(LED)检测方案(分子荧光光谱)》用到的仪器有HORIBA DeltaPro超快时间分辨荧光光谱仪
相关方案
更多
该厂商其他方案
更多