


方案详情
文
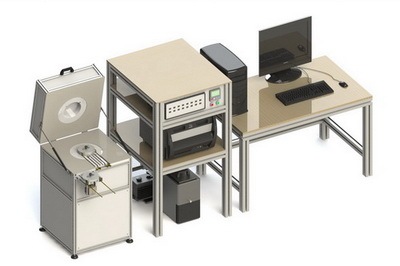
本文对瞬态平面热源法测试建筑材料变温条件下的导热系数进行了详尽的报道,分别介绍了多重不同建筑材料在常温和高温下的导热系数、热扩散率和体积比热容的测试过程,并且介绍了一部分建筑材料热性能受湿度的影响结果。
方案详情

Robert Jansson 2 Abstract An investigation of the TPS (Transient Plane Source) method to determine thethermal properties for building materials at high temperature has been performed.The thermal conductivity, diffusivity and the volumetric specific heat for differentbuilding materials at room temperature and at elevated temperatures has beendetermined. Also influence of moisture content on the thermal properties of anumber of materials was instigated. Key words: Thermal properties, elevated temperatures, transient plane source,TPS, building materials SP Swedish National Testing and Research Institute SP Report 2004:46 ISBN 91-85 303-22-4 ISSN 0284-5172 Boras 2004 Postal address: Box 857. SE-501 15 BORAS, Sweden Telephone: +46 33 16 50 00 Telex: 36252 Testing S Telefax: +46 33 13 55 02 E-mail: info@sp.se Contents Abstract2 Contents3 Preface 5 Summary 1 Introduction Background Previous studies 1.2.1 Concrete 8888 1.2.2 Wood and woodbased materials Limitations Objectives 2 Methodology 2.1 The Transient Plane Source (TPS) 2.2 Parameters to set on the instrument 2.3 Different sensor types 2.4 Additional modules 3 Materials Conditioning Tested materials 3.2.1 Conventional concrete 3.2.2 High performance concrete 3.2.3 Self-compacting concrete 3.2.4 Cement paste 3.3 Wood and wood based materials 3.3.1 Spruce 3.3.2 Particleboard and low density fibreboard 3.4 Insulation materials 22 3.5 Polymethylmetacrylate (PMMA) 4 Measurements 4.1 Methodology 4.2 Concrete 4.3 Wood 4.4 Insulation materials 5 Test procedure and results 5.1 Conventional concrete 5.1.1 Effect of temperature 5.1.2 Effect of moisture content 5.1.3 Residual values after drying 5.2 High performance concrete 5.2.1 Effect of temperature 5.2.2 Effect of moisture content 5.3 Self-compacting concrete 5.3.1 Effect of temperature 5.3.2 Effect of moisture content 5.4 Cement paste 2 33 3 5.5 Spruce 5.6 Particleboard 5.7 Fibreboard 5.8 Polymethylmetacrylate (PMMA) 5.9 Insulation and plastic materials 5.9.1 Polystyrene 5.9.2 Flexible Polyurethane foam 5.9.3 High-density glass wool 5.9.4 Low-density glass wool 5.9.5 Mineral Wool 6 Full scale test and calculation 6.1 Experimental measurements 6.2 TPS measurements 6.3 Calculation and comparison between experimental and theoreticalresults54 7 Discussion 7.1 Concrete materials 7.2 Wood and wood based products 8 Conclusions 57 9 Purposed areas for further investigation 58 References 59 Appendix A- Data from measurements Conventional concrete High performance concrete Self-compacting concrete Cement paste Spruce Particleboard Fibreboard Polymethylmetacrylate(PMMA) Polystyrene Polyurethane High-density glass wool Low-density glass wool Low-density mineral wool Preface This work was financially supported by the Swedish Board for Fire Research(Brandforsk) as project number 328-031. The work presented in this report hasbeen performed at SP Swedish National Testing and Research Institute who alsohas contributed financially to the project. Finally thanks to the following persons who have been in the reference group forthe project: Anders Wallin Brandforsk Bertil Fredlund LTH Byggnadskonstruktion Christer Ljungkrantz IB Cementa AB Thomas Jarphage NCC Ulf Jonsson Skanska Also a special thank to Bengt Bogren who have performed the major part of themeasurements. Summarv An investigation of the TPS (Transient Plane Source) method to determine thethermal properties for materials at high temperature has been performed. Thethermal conductivity, thermal diffusivity and the volumetric specific heat fordifferent building materials at room temperature and at elevated temperatureswere determined. Also the influence of moisture content on the thermal propertiesof some materials was investigated. With the TPS method the thermal conductivity, thermal diffusivity and thevolumetric specific heat for isotropic materials can be determined at the same timefrom a transient measurement, which is a big advantage in comparison with otherstationary methods. When measurements with the TPS method are done onanisotropic materials the volumetric specific heat must be known in advance. The measurements performed on concrete showed a fairly good agreement withpreviously known values. Also a temperature calculation of the heat transferinside a fire-exposed concrete slab based on the measured properties correspondedwell with the measured values from a real fire test. Measurements of the thermal properties of insulating materials, wood and woodbased products were also performed. The measurements on wood showed fairlycomparable results with the Eurocode for the thermal conductivity in the radialdirection but a quite big scatter in the measurements was present especially athigher temperatures. The result from the measurement on high density glass wool seems to be logicalbut measurements on low weight fibrous materials as low-density glass wool andlow-density mineral wool at high temperature were shown to be problematic withthe TPS equipment. The illogical jumps in the thermal properties when switchingfrom Kapton insulated sensors (low temperature measurements) to Mica insulatedsensors (high temperature measurements) are yet to be explained. Introduction 1.1 Background During the past decades the use of computer based calculation methods in thefield of fire technology has increased. As the accuracy of the models and the fieldof application for computer-based calculations are broadened it sets new demandsof the input parameters. A fundamental factor when dealing with fire related cal-culations are the thermal properties of the materials. It is often a big discrepancybetween these properties at room temperature and at elevated temperaturesaccomplished in the fire situation. Therefore it is an important task to refine themeasurement techniques for these parameters. The most common way to measure thermal conductivity is by steady statemethods. The fundamental of these methods is to achieve a stationary temperaturefield and to perform a heat flux measurement at the boundary. The steady statemethods are typically more time consuming and require bigger test samples thenthe transient methods. The sheer volume of current materials and their applica-tions combined with the fact that their availability in limited sizes and forms makesteady state methods unsuitable for measurement requirements (Tye et al. 2003). The transient plane source method (TPS) is one of a few methods enabling deter-mination of the thermal conductivity, thermal diffusivity and the specific heatsimultaneously. With stationary methods it is not possible to measure timedependent properties. 1.2 Previous studies 1.2.1 Concrete Determination of the thermal properties of concrete at high temperature is not anew issue. Odeen and Nordstrom (1972) performed measurements on concrete attemperatures from room temperature up to 1000 °C. The measurements at hightemperature were performed with the Stalhane-Pyk method (thermal conductivity)and a Dynatech calorimeter (specific heat). The thermal conductivity measure-ments show the typical decay at high temperatures. When the material is coolingafter an exposure at high temperature the thermal conductivity is approximatelyconstant,see figure 1. Figure 1. Temperature dependent thermal conductivity for concrete with w/c=0.7(Odeen and Nordstrom 1972). The cooling phase is included in the diagram. Concrete is a hygroscopic material, which means that it can contain differentamounts of moisture.Morabito (1989) has investigated the moisture dependenceof different type of concrete at room temperature, see figure 2. In that study thehot wire method was used, which like the TPS method is a transient methodallowing the measurement to be completed before the moisture has time tomigrate significantly. wwt percent Figure 2. Thermal conductivity versus moisture content of different kind for concrete(Morabito 1989). When a calculation is to be performed according to the Eurocode, the thermalproperties are prescribed. The temperature dependent thermal conductivity andspecific heat are stated in the Eurocode 2 part 1-2 (2003). The thermal conduc-tivity is shown as an upper and lower limit curve, see figure 3. According to thestandard the thermal conductivity for high performance concrete may be higherthan for ordinary concrete. There is a possibility to make national interpretationswithin the limits. The specific heat for siliceous concrete as a function oftemperature is shown in figure 4. Included in the figure is also the latent heat fordifferent moisture contents. a.[W/m K] Figure 3. Thermal conductivity of concrete according to Eurocode 2 part 1-2 (2003). Cp(0)[kJ/kgK] u=3% u=1,5% u=0% Figure4. Specific heat for siliceous concrete as a function of temperature at threedifferent moisture contents according to Eurocode 2 part 1-2 (2003). The variation of the thermal properties between different types of concrete cansometimes be of quite a big magnitude. In figures 5 and 6 measurements fromdifferent sources are shown together. One factor causing the variation may be thatdifferent methods have been used in the measurements. Figure 5. Thermal conductivity of siliceous-aggregate concrete. Compilation made bySchneider (1982). Figure 6. Effect of temperature on measured specific heat of various concretes.Compilation made by Bazant and Kaplan (1996). (1) granite aggregate concrete (Odeen,1968); (2) limestone aggregate concrete (Collet and Tavernier, 1976); (3) lime stoneaggregate concrete (Harmathy and Allen, 1973); (4) siliceous aggregate concrete(Harmathy and Allen, 1973); (5) limestone aggregate concrete (Hildebrand, et al., 1978);(6) siliceous aggregate concrete (Hildebrand, et al.,1978) 1.2.2 Wood and woodbased materials Wood and other cellulosic materials have a low thermal conductivity due to theporosity of the material and the absence of free electrons (in opposite to metals).The thermal conductivity varies in different directions of wood. The differentdirections are shown in figure 7. According to Kollman and Cote 109(1968) theconductivity in the radial direction is about 5 to 10 % greater then in the tangentialdirection and the conductivity in longitudinal direction is about 2.25-2.75 timesthe conductivity across the grain (radial direction). The thermal conductivity as afunction of density for wood and fibreboard is shown in figure 8. At NIST(National Institute of Standards and Technology,USA), the result from thermalconductivity measurements on the particleboard was 0.15 W/mK (NISTdatabase). The measurement at NIST was performed with a guarded hot plate atroom temperature on a particleboard with a density of 795 kg/m. Figure 7. Principle directions in wood: R=Radial, T=Tangential and L =Longitudinal Figure 8. Effect of density on thermal conductivity of wood and fibre-based board at12 % moisture content and temperature 300 K (Kollman and Cote 1968). The temperature dependent thermal properties for wood according to Eurocode 5:Part 1-2 (2003) are shown in figures 9 and 10. Figure 9. Thermal conductivity for wood and char layer according to Eurocode 5:Part 1-2 (2003). Figure 10. Specific heat for wood and charcoal according to Eurocode 5: Part 1-2 (2003).The peak in the diagram is the latent heat of evaporation. 1.3 Limitations Due to the nature of the TPS technique no estimation of the internal chemicalendothermic or exothermic processes can be done. The measurements performedin this project are in the temperature range 20-600C. With the TPS equipment,measurements can be done up to approximately 750°C and development isongoing to expand the range even higher but to save the used equipment thehigher limit of the temperatures was set to 600 C. The available sensor sizes for this project were Kapton and Mica sensors withradius from 6.403 mm to 9.719 mm. Although in the additional test to check theinfluence of sensor size, when measurements are performed on concrete, Kaptonsensors with the radius 14.61 and 29.52 mm were also used. Initially some measurements on sealed concrete specimens were to be included inthe test program but the high internal pressures associated with that type of testingand the difficult task to find a proper methodology forced us to exclude it from thetest program. In the originally plan only measurements with the basic TPS technique were to beperformed on different building materials. But it soon became obvious that insome of the materials the thermal conductivity and thermal diffusivity was direc-tion dependent. Therefore the project was expanded to include anisotropicmeasurements on wood. When anisotropic measurements are done the volumetricspecific heat must be known in advanced. The intention of this project was not to make a reference work on the thermalproperties at high temperature for all building materials. The purpose was toinvestigate the advantages and eventual disadvantages of using the TPS methodfor this type of work. 1.4 Objectives The objective with the study was to examine and develop the TPS technique formeasurement of the thermal properties at elevated temperatures for differentmaterials. Within the frame of the project several different building materials wereto be studied such as concrete, wood based materials and insulation materials. Inaddition to the measurements with the TPS method an evaluation of thedetermined data was to be performed with a comparison between a calculationbased on the measured data for concrete and a full-scale fire test. 2 Methodology 2.1 The Transient Plane Source (TPS) When a measurement according to the basic TPS method is performed a flatround hot disc sensor is placed between two pieces of material, see figure 11. Thesensor consists of a thin nickel foil spiral, 10 um, which is sandwiched betweentwo sheets of electrical insulation material. Figure 11. Test setup for a measurement according to the TPS method (Gustafsson andLong 1995). The hot disc sensor acts as a constant effect generator and a resistance thermo-meter at the same time. The measurement starts when a stepwise power pulse isapplied to the sensor. When a constant electrical effect is applied, the temperaturein the censor rises and heat starts to flow to the tested material. The timedependent resistance rise is then recorded and converted with the temperaturecoefficient of resistivity for Nickel to a temperature response curve, see figure 12. Time Figure 12. When the stepwise power pulse is applied the change in voltage is recordedand converted to resistance and thereafter temperature. The temperature rise in the sensor is a direct response of the thermal properties ofthe tested material. If the material has good insulation properties, which meanslow conductivity and diffusivity, the temperature of the sensor will rise rapidlywhen a certain amount of heating effect is applied. If the material on the otherhand has good conducting properties the applied heat will be transported fasterinside the material and the temperature will not rise as much as in the test of theinsulating material. When measurements are made with the TPS method the test specimen must havea uniform internal temperature distribution.A temperature drift recording, whichis the start-up for every measurement, is used to check this. If the temperaturerecording shows a systematic drift in any direction there is a possibility tocompensate for that in the software but the accuracy of the measurement can bereduced considerably and therefore it is not recommended. The measurements athigh temperatures in this project have been performed inside a muffle furnace. 2.2 Parameters to set on the instrument Depending on the thermal properties a proper electrical power, size of sensor andmeasurement time must be chosen, i.e. it is an iterative process if the properties ofthe tested material are totally unknown. The power effect selection is directdependent to the desired temperature rise in the test specimen. For metals asuitable temperature rise is <1°C and for insulation materials betweenapproximately 1 and5 ℃. There is a characteristic time for every measurementwhen the thermal conductivity, thermal diffusivity and the specific heat can bedetermined from one measurement. This is when the heat profile in the testspecimen can be approximated as a mix of the mathematical solutions from asemi-infinite slab and a point source. If the measurement time is to short only thethermal effusivity can be calculated because the mathematical solution approachesthe semi-infinite slab case. If the measurement time on the other hand is to longthe mathematic solution is more like an infinite solid heated by a constant pointsource and only the thermal conductivity can be calculated (Gustafson 1991,Gustafsson and Long 1995). A more detailed mathematical description of the usedsolution strategy in the software is given by Gustafsson (1991). 2.3 Different sensor types When the temperature is below 500 K, the insulation material of the sensor isKapton with a thickness of 25 um and in the 500 - 1000 Krange Mica with thethickness of 60 um is used. The reason for using Nickel as the conducting materialin the sensor is because of its large temperature coefficient of resistivity over a bigtemperature range. The only discontinuity in the temperature coefficient ofresistivity for Nickel is around the transition temperature, therefore measurementsin the temperature range between 350 and 400 °℃ are to be avoided (InstructionManual, 2001). Different sensors are shown in figure 13. Figure 13. The upper three sensors are insulated with Kapton and the lower three withMica. The choice of sensor is mainly dependent on the size of the test specimen. Asdescribed in the previous chapter the form of the temperature field inside thespecimen should be a mix of a point source and an infinite slab without escapingoutwards the specimen. The sensors used in this project can be seen in table 1. Table 1.Used sensors. Insulating material in the sensor Radiuss mm Kapton 6.403 Mica 6.631 Kapton 9.719 Mica 9.719 Kapton 14.61 Kapton 29.52 2.4 Additional modules In some materials the thermal conductivity and diffusivity are directiondependent. A variant of the solution algorithm in the TPS software can then beused. But to be able to do the calculation the specific heat of the sample must beknown in advance. The solution from the anisotropic module gives the thermalconductivity and diffusivity in the radial and axial directions, see figure 14. Figure 14. The radial and axial directions in the anisotropic solution in the material incomparison with the sensor position. A way to determine the specific heat is to use a specially designed specific heatsensor in the TPS package. The sensor is attached to a brass box were a smallsample of the material is placed, see figure 15. By a comparison between thethermal response from an empty insulated box and a box containing the testmaterial the actual absorbed energy per degree temperature rise can be recordedand the specific heat can be calculated. Figure 15. The upper left picture shows the test specimen and the sensor and the downright the whole insulated assembly. 3 Materials 3.1 Conditioning The thermal properties of porous materials at temperatures below 100℃ are oftendependent of the moisture content of the tested material. Therefore the moisturecontent is an important parameter when measurements are performed. A climate room (20°℃, RH 50 %) and buckets containing salt solutions were usedto achieve controlled conditioning environments for the test specimens. The saltsolutions were placed in the bottoms of airtight plastic buckets, see figures 16-17.To assure that no RH gradients existed in the conditioning buckets fans were usedto mix the air inside.The solutions were Magnesium Chloride MgCl2 (RH=33 %),Sodium Chloride NaCl (RH=75%)and Potassium Bisulphate (RH=97 %). Figur 16. Test specimens stored in a climate room. Figur 17. Buckets with salt solutions in which specimens were stored. The complete test program is shown in table 2. The relative humidity values for90 °C are equilibrium values at room temperature. Table 2 Test program with TPS. 20°C ~90°C Elevated temperatures(>90°C) Conventional concrete 0%RH33%RH50%RH75%RH97%RH 0%RH33%RH*75%RH*97% RH* 0%RH Conventional concrete dried at: 200°C400°C600°C High performance concrete 0%RH50%RH75%RH 0%RH 0%RH Self-compacting concrete 0%RH75%RH 0%RH 0%RH Cement paste 0%RH 0%RH 0%RH Spruce-low density 50%RH 0%RH 0%RH Spruce-high density 50%RH 0%RH 0%RH Particle board 0%RH 0%RH 0%RH Fibre board 0%RH 0%RH 0%RH PMMA (Polymethylmetacrylate) 0%RH 0%RH Glass wool-density 29 kg/m' 50%RH 0%RH 0%RH Glass wool- density 115kg/m 50% RH 0%RH 0%RH Rock wool - density 33 kg/m 50%RH 0%RH 0%RH Polystyrene 50%RH 0%RH Polyurethane 50%RH 0%RH * initial RH at room temperature 3.2 Tested materials 3.2.1 Conventional concrete A total of 38 specimens were manufactured for TPS measurements. The concreterecipe used is shown in table 3. The concrete was casted in cylindrical mouldswith a diameter of 70 mm and a length of 500 mm. In addition to the cylinderscubes were casted for measurement of compressive strength. The 28 days strengthmeasured in accordance with SS 13 72 10 as well as the raw density is given in)mmtable 4. The slump measurement of the concrete was 50 mm. The concrete was stored under water until the forms were removed. The cylinderswere cut into discs with the thickness 20 mm, two discs for each TPS specimen.Figure 18 show the cutting of a specimen. The specimens were thereafter stored ina climate room or in boxes with a controlled relative humidity until testing. Table 3. Recipe of conventional concrete. Amount(kg/m) Cement (CEM I) 275 Fine gravel 0-8 1015 Coarse gravel 8-16 864 Water 192 w/c-ratio 0.70 Table 4. Compressive strength and density Compressive strength (MPa) Density (kg/m) K30-1 38.6 2326 K30-2 38.7 2317 K30-3 38.2 2347 Mean 38.5 2330 Standard deviation 0.3 15 Figure 18. Manufacturing of specimens. 3.2.2 High performance concrete A total of 20 specimens were manufactured for TPS measurements. The concreterecipe used is shown in table 5. The concrete was casted in cylindrical mouldswith a diameter of 70 mm and a length of 500 mm. In addition to the cylinderscubes were casted for measurement of compressive strength. The 28 days strengthmeasured in accordance with SS 13 72 10 as well as the raw density is given intable 6. The slump measurement of the concrete was 210 mm. The concrete was stored under water until the forms were removed. The cylinderswere cut into discs with the thickness 20 mm, two discs for each TPS specimen.The specimens were thereafter stored in boxes with a controlled relative humidityuntil testing. Table 5. Recipe of high performance concrete. Amount(kg/m) Cement (CEM II) 465 Fine gravel 0-8 836 Coarse gravel 8-16 942 Silica 35 Plasiticizer SM56 1.5% Water 150 w/c-ratio 0.28 Table 6. Compressive strength and density Compressivestrength (MPa) Density (kg/m) K100-1 114.5 2444 K100-2 112.9 2431 K100-3 115.3 2431 Mean 114.2 2435 Standard deviation 1.2 8 3.2.3 Self-compacting concrete A total of 20 specimens for TPS measurements were manufactured. The concreterecipe used is shown in table 7. The concrete was casted in cylindrical mouldswith a diameter of 70 mm and a length of 500 mm. In addition to the cylinderscubes were casted for measurement of compressive strength. The 28 days strengthmeasured in accordance with SS 13 72 10 as well as the raw density is given intable 8. The flow slump measurement of the concrete was 670 mm. The concrete was stored under water until the forms were removed. The cylinderswere cut into discs with the thickness 20 mm, two discs for each TPS specimen.The specimens were thereafter stored in boxes with a controlled relative humidityuntil testing. Table 7. Recipe of self-compacting concrete. Amount(kg/m) Cement (CEM II) 430 Fine gravel 0-8 1052 Coarse gravel 8-16 635 Limestone filler 127 Plasiticizer SM56 1.0% Plasiticizer SM56 1.0% Water 164 w/c-ratio 0.38 Table 8. Compressive strength and density Compressivestrength (MPa) Density(kg/m') SCC-1 91.7 2421 SCC-2 91.8 2423 SCC-3 93.4 2422 Mean 92.3 2422 Standard deviation 1.0 1 3.2.4 Cement paste A total of 8 specimens for TPS measurements were manufactured. The recipeused is shown in table 9. The cement paste was casted in cylindrical moulds witha diameter of 70 mm and a length of 500 mm. The cement paste was stored under water until the forms were removed. Thecylinders were cut into discs with the thickness 20 mm, two matched discs foreach TPS specimen. The specimens were thereafter stored in a room with therelative humidity 50% and temperature 20 °C until testing. Table 9. Recipe of cement paste. Amount(kg/m) Cement (CEM I) 1374 Water 557 w/c-ratio 0.405 3.3 Wood and wood based materials 3.3.1 Spruce Spruce timber from south-western Sweden was selected. Two different densitiesof spruce were used for manufacturing of specimens, one with the densityapproximately 400 kg/m’and one with approximately 600 kg/m’. A total of 60specimens were manufactured for TPS measurements. The specimens haddimensions) of 60 x 60 x 30 mm’(width x length x height). Matched pairs wereused as TPS specimens. Due to the orthotropic behaviour of wood, specimens were manufactured in suchway that the thermal properties could be determined in the three main axis of thematerial, radial (R), tangential (T) and longitudinal (L). 3.3.2 Particleboard and low density fibreboard Particleboard and fibreboard are not like ordinary wood orthotropic or anisotropic(in normal scale) so the standard module for TPS measurement can be used todetermine the thermal properties. The densities of the particleboard and low-density fibreboard were 595 kg/m and 278 kg/m'respectively. The two materialswere tested at 0 and 7% moisture content. 3.4 Insulation materials The type of materials and the density of the different insulation materials areshown in table10. Table 10. Some different insulation materials were incorporated in the test series. Material Density (kg/m) Polystyrene 18 Flexible polyurethane foam 24 Glass wool (low dens) 29 Glass wool B (high dens) 115 Rock wool (low dens) 33 3.5 Polymethylmetacrylate (PMMA) Polymethylmetacrylate with a density of 1176 kg/m’ was tested. PMMA is notactually a building material but was incorporated in the test series anyway. 4 Measurements 4.1 Methodology The test program was designed to investigate the temperature dependent thermalproperties and also in some materials the influence of the moisture content on theproperties. When measurements at temperatures over the room temperature were performedthe specimen holder and the specimen were placed inside one of two availablemuffle furnaces, see figure 19. As seen in figure 20, two test specimens could beplaced in the oven at the same time. The temperature in the furnace was measuredwith an additional thermocouple. Figure 19. Ovens used for heating the specimens. Figure 20. Two test specimens placed inside a test furnace. The presented measurement values are mean values of at least three measurementswith the same test setup and boundary conditions. This is to ensure that no syste-matic drift is present. Between the measurements the test specimen must go backto thermal equilibrium with the surrounding i.e. no thermal gradients in thematerial shall be present. If, for example, a test on wood has been performed at the temperature 90 ℃ the temperature in the centre of the specimen may haverisen to 92 °C after the transient measurement and needs to decrease back to 90 °Cbefore next measurement. To ensure that the sensor is placed in a proper way the test specimen and thesensor are hold in place by a sample holder, see figure 21. Figure 21. The test setup with a wood test specimen and sample holder for ameasurement at room temperature. At the start of the project only the original TPS module for determination of thethermal properties in isotropic materials was available. But during the project itbecomes obvious that the thermal conductivity and diffusivity in wood was heavydirection dependent and therefore the anisotropic module was purchased. 4.2 Concrete Intentionally, measurements of the thermal properties at high temperatures withdifferent moisture contents were to be performed. But to investigate the partlysaturated state of the pores inside the concrete at high temperatures and pressurethat can occur during a fire the specimen must be kept inside some kind ofpressure chamber. This was shown to be a to challenging task for this project soonly measurements at room temperature and 90 °C were performed at differentmoisture levels. 4.3 Wood High and low density spruce were tested with the anisotropy TPS module. Whenthis kind of measurements is performed the specific heat must be known inadvance. The specific heat for room temperature was measured with the TPSspecific heat module and the values at higher temperatures was taken fromEurocode 5: Part 1-2(2003). 4.4 Insulation materials The measurements done on insulating materials were performed with the standardmodule of the TPS package. By using the standard module the thermal propertiesare assumed to be uniform in all directions. This is true for polystyrene andpolyurethane but the fibre insulation materials are more or less orthotropic, see thediscussion in chapter 5.9.3. 5 Test procedure and results 5.1 Conventional concrete Concrete is a non-homogenous material since it contains aggregate and cementpaste with different thermal properties. During the measurement series we becomesuspicious that the size of the available sensor was too small i.e. the volume that isheated during a test is not representative for the material. This suspicion wasbased on the jump in the results when the sensor was switched from a Kaptoninsulated sensor with the radius 9.719 mm at 90 °C to a Mica insulated sensorwith the radius 6.631 mm at 110 °C for high performance concrete and self-compacting concrete. This jump in results was not present when the same switchwas done to a 9.719 mm Kapton insulated sensor. Also when the measurementwas performed on a homogenous material (cement paste) the jump in results whenswitching between a 9.719 mm Kapton and a 6.631 mm Mica sensor was notpresent. To get an indication of the size of this variation for different sensor sizes a testwas performed in room temperature on a 150x 150 mm cube sliced in twohalves, see results in figure 22. Sensors with the diameter 6.631, 9.719, 14.61 and29.52 mm were tested. Each dot in the diagram is a mean value of at least threemeasurements in the same position. The sensor was then moved and by using thismethod the sensitivity of the sensor for non-homogeneities in the material waschecked. The measurements show that the 6.631 mm sensor was a not so goodchoice, which was suspected. To get a better mean value or more representativevalue of the thermal properties for concrete a sensor with the diameter of3 timesthe biggest aggregate size is recommended. In this case, with 16 mm aggregate, asensor with a radius of 24 mm would have been a good choice. This also meansthat the radius of the test specimens ought to be about 100 mm and the thicknessat least 48 mm to get a relevant size of the temperature field. Figure 22. The diagram shows measurements on the same test specimen with differentsensors and positions. 5.1.1 Effect of temperature The effect of temperature on the thermal properties was investigated by a stepwiserise of the temperature and measurements were done when the test specimen hadreached thermal equilibrium with the furnace at the desired temperatures. TheTPS measurements shown in figure 23 show the typical decay of the thermalconductivity at high temperatures. Specimen No 37 was dried prior the test andspecimen 23 was in equilibrium with 33% RH at room temperature. The resultsfrom the conductivity measurements done on specimen 23 are suspicious high.This can be due to the sensor problem described in the previous chapter. Thedecline of the thermal diffusivity with temperature is shown in figure 24 and theslightly rise of the specific heat with temperature is shown in figure 25. Temperature dependant conductivity Figure 23. The temperature dependent thermal conductivity for conventional concrete.The sensor radius was 9.719 mm for both the used Kapton and Mica sensors. SpecimenNo 23 were in equilibrium with 33%RH prior test and No 38 was dried before the test. Temperature dependant diffusivity Figure 24. The temperature dependant thermal diffusivity for conventional concrete. Temperature dependant specific heat Figure 25. The temperature dependent specific heat for conventional concrete. 5.1.2 Effect of moisture content The effect of the moisture content was investigated by tests on specimensconditioned in different climates prior the test. After the test the specimens weredried at 105°C. The relation between relative humidity and moisture content isshown in figure 26. Relativ humidity vs.Moisture content Figure 26. The relation between relative humidity and moisture content for theconventional concrete specimens. When the relative humidity in conventional concrete is increased also the thermalconductivity and specific heat is increasing. This relationship is shown in figures27-28 and 31-32. The effect is not so pronounced at 90 °C as in room temperature. The moisture effect on the thermal diffusivity, figures 29-30, is small. Moisture Dependant Thermal Conductivity at 20℃ Figure 27. The moisture dependent thermal conductivity for conventional concrete at20C. Test specimens conditioned at different relative humidity. Moisture Dependant Thermal Conductivity at 90 ℃ Figure 28. The moisture dependent thermal conductivity for conventional concrete at90 °C. The relative humidity on the x -axis is at room temperature prior the testing. Moisture Dependant Thermal Diffusivity at 20°℃ Figure 29. The moisture dependent thermal diffusivity for conventional concrete at20°C. Moisture Dependant Thermal Diffusivity at 90℃ Figure 30. The moisture dependent thermal diffusivity for conventional concrete at90C. The relative humidity on the x-axis is at room temperature prior the testing. Moisture Dependant Specific Heat at 20 c Figure 31. The moisture dependent specific heat for conventional concrete at 20℃. Moisture Dependant Specific Heat at 90℃ Figure 32. The moisture dependent specific heat for conventional concrete at 90°C. Therelative humidity on the x-axis is at room temperature prior the testing. 5.1.3 Residual values after drying The purpose of these tests was to investigate if the measurement of residual valuesafter drying could be a way to determine the thermal properties at high tempera-ture. The assumption is based on that the thermal properties are almost stableduring the cooling phase. The thermal properties of concrete specimens dried at 105 °C were tested at roomtemperature and then tested again at room temperature after drying at threedifferent temperatures namely 200, 400 and 600 C. Table 11-13 shows the residual values for ordinary concrete. Table 11 A concrete specimen tested at room temperature after drying at 105°℃ and thentested again after drying at 200 C/.。 Drying Conductivity Diffusivity Specific heat(MJ/mK) (mm/s) W/mK) temperature 105℃ 1.60 1.02 1.58 200°℃ 1.55 1.04 1.49 Diff in% -4 2 -5| Table 12 A concrete specimen tested at room temperature after drying at 105 ℃ and thentested again after drying at 400 ℃. Drying temperature Conductivity Diffusivity Specific heat(MJ/mK) (mm/s) W/mK) 105℃ 1.65 0.96 1.72 400°℃ 1.46 0.78 1.87 Diffin% -12 -19 9 Table 13 A concrete specimen tested at room temperature after drying at 105℃ and thentested again after drying at 600 ℃. Dryingtemperature Conductivity Diffusivity(mm/s) Specific heat(MJ/mK) (W/mK) 105°℃ 1.97 0.89 2.21 600℃ 1.18 0.57 2.08 Diff in% -40 -37 -6 The results from the measurements of the residual thermal proprieties on concretedried at 200, 400 and 600 ℃ may be an indirect way to determine the propertiesat high temperature. But this methodology must be further investigated withbigger sensors as discussed a previous chapter. 5.2 High performance concrete 5.2.1 Effect of temperature As shown in figure 33 there is a big discrepancy in the result of the measurementbetween 90 and 110 °C. The reason for that is supposed to be the switch from a radius 9.719 mm Kapton to a radius 6.631 mm Mica sensor. The samephenomenon was present on one of the test specimens when the same sensorswitch was performed in the measurement on self-compacting concrete but not forconventional concrete when the switch was from a radius 9.719 mm Kapton to aradius 9.719 mm Mica sensor. After these measurements the influence of sensorradius was investigated further, see chapter 5.1. Figures 34 and 35 shows the thermal diffusivity and specific heat respectively.The large jump due to the sensor switch is present in the specific heatmeasurement but not in the thermal diffusivity measurement. Temperature dependant conductivity Figure 33. The temperature dependent thermal conductivity for high performanceconcrete. The discrepancy in conductivity is when the sensor was switched from a radius9.719 mm Kapton to a radius 6.631 mm Mica. The test specimen was dried before thetest. Temperature dependant diffusivity Figure 34. The temperature dependent thermal diffusivity for high performanceconcrete. Temperature dependant specific heat c Figure 35. The temperature dependent specific heat for high performance concrete. Thediscrepancy in specific heat is when the sensor was switched from a radius 9.719 mmKapton to a radius 6.631 mm Mica. 5.2.2 Effect of moisture content The influence of the moisture on the thermal properties seems to be smaller forhigh performance concrete then for conventional concrete, see figures 36-38. Moisture Dependant Thermal Conductivity at 20℃ Figure 36. The moisture dependent thermal conductivity for high performance concreteat 20°C. The trend line in the diagram is a coarse assumption but it may give anindication of the difference. Moisture Dependant Thermal Diffusivity at 20 ℃ Figure 37. The moisture dependent thermal diffusivity for high performance concrete at20 °C. The trend line in the diagram is a coarse assumption but it may give an indicationof the difference. Moisture Dependant Specific Heat at 20℃ Figure 38. The moisture dependent specific heat for high performance concrete at 20°C.The trend line in the diagram is a coarse assumption but it may give an indication of thedifference. 5.3 Self-compacting concrete 5.3.1 Effect of temperature As shown in figure 39 there is a discrepancy in the result of the measurement fortest specimen No. 69 between 90 and 110°C. The reason for that is supposed tobe the switch from from a radius 9.719 mm Kapton to a radius 6.631 mm Micasensor, see discussion in chapter 5.1. Test specimen No. 69 was dried after the testat room temperature and specimen No. 75 was dried prior the testing. Figure 40 and 41 shows the thermal diffusivity and specific heat respectively. Thelarge jump due to the sensor switch is present in the specific heat measurementbut not in the thermal diffusivity measurement. Temperature dependant conductivity Figure 39. The temperature dependent thermal conductivity for self-compactingconcrete.The discrepancy in conductivity for test specimen no 69 is when the sensor was switchedfrom a radius 9.719 mm Kapton to a radius 6.631 mm Mica. Temperature dependant diffusivity Figure 40. The temperature dependent thermal diffusivity for self-compacting concrete. Temperature dependant specific heat Figure 41. The temperature dependent specific heat for self-compacting concrete. Thediscrepancy in specific heat for test specimen no 69 is when the sensor was switched froma radius 9.719 mm Kapton to a radius 6.631 mm Mica. 5.3.2 Effect of moisture content The self-compacting concrete specimens were tested at 75% and 0% RH. Thediagram in figure 42 shows a slightly rise in conductivity for the specimensconditioned at 75% RH. No significant moisture dependence of the thermaldiffusivity and specific heat is shown in the measurements, figure 43-44. Moisture Dependant Thermal Conductivity at 20℃ Figure 42. The moisture dependent thermal conductivity for self-compacting concrete at20°C. Moisture Dependant Thermal Diffusivity at 20 ℃ Figure 43. The moisture dependent thermal diffusivity for self-compacting concrete at20°C. Moisture Dependant Specific Heat at 20℃ Figure 44. The moisture dependent specific heat for self-compacting concrete at 20°C. 5.4 Cement paste Concrete contains of a mix of cement paste and aggregate. The thermalconductivity and thermal diffusivity of cement paste are usually lower than theproperties for the aggregate, which leads to lower values of for cement pastecompared with concrete. The measurements on cement paste were done both during the first heating upphase and the cooling down phase, see figures 45-47. The specimens were driedbefore testing. Temperature dependant conductivity Figure 45. The temperature dependent thermal conductivity for cement paste. Thediagram also includes measurements from the cooling down (the lower values). Switchedfrom a radius 9.719 mm Kapton to a radius 6.631 mm Mica at 90 °C. Temperature dependant diffusivity Figure 46. The temperature dependent thermal diffusivity for cement paste. The diagramalso includes measurements from the cooling down (the lower values). Temperature dependant specific heat Figure 47. The temperature dependent specific heat for cement paste. The diagram alsoincludes measurements from the cooling down (the lower values). 5.5 Spruce Wood is a orthotropic material, which means that the thermal properties(conductivity and diffusivity) are different in the three main directions. The maindirections in wood are radial, longitudinal and tangential. Therefore test sampleswith three main directions were prepared to be able to separate the properties.This was shown to be impossible with the available equipment. The developmentof the TPS system to be able to determine thermal properties in three directionswith a special measurement probe and calculation module came to our knowledgeduring the project but the purchase of this new equipment was not within thescope and time scale of the present project. The difference in the radial andtangential directions are relatively small, about 5-10% according to Kollman andCote (1968) so as an approximation, wood is treated as an anisotropic material.The thermal properties with two main directions were investigated with theanisotropic module on the specimens with the longitudinal direction placedperpendicular to the TPS sensor. When measurements on anisotropic materials are performed the specific heat mustbe known. The specific heat for wood at room temperature was investigated withthe special specific heat sensor in the TPS package. The specific heat sensor canonly be used at room temperature so specific heat values for higher temperatureswere taken from the Eurocode 5: Part 1-2(2003). The measurements shown infigure 48 and 49 were done on specimens conditioned in 50 % RH. All individual measurements, which are summarized in the diagrams, are shownin appendix A. As shown in appendix A, when measurements on spruce attemperatures above the room temperature were done, there was a big scatter in themeasured values. This fact is not satisfactory and must be dealt with to get reliablevalues in future measurements. High density spruce, conductivity and diffusivity Figure 48. The temperature dependent axial and radial thermal conductivity anddiffusivity for high-density spruce. Axial in the measurements is longitudinal in thematerial and radial is radial and tangential in the living tree. Low density spruce, conductivity and diffusivity Figure 49. The temperature dependent axial and radial thermal conductivity anddiffusivity for low-density spruce. Axial in the measurements is longitudinal in thematerial and radial is radial and tangential in the living tree. 5.6 Particleboard Density of the material was 595 kg/m’and the initial moisture content u=7%. The thermal conductivity for particleboard is according to Kollman and Cote(1968) just between fiber-based board and wood in transverse direction in figure 8in the literature survey chapter, i.e. approximately 0.1 W/mK which should beecompared with 0.18 for particleboard, see figure 50, from the TPS measurements,which is a big difference. The discrepancy may possibly depend on developmentof the materials, the diagrams in the publication by Kollman and Cote is based onmeasurements from 1956. As indicated in table 14 the thermal conductivity isslightly rising with increasing moisture content, which is logical. The conductivitymeasurements of particleboard shown in the NIST database (ID 1897) seem to bemore in the same range as the TPS measurements. They measured 0.15 W/mK fora particleboard with the density 795 kg/m'which should bee compared with0.18/0.16 W/mK for dry/wet 595 kg/m’material with the TPS method. The values at 192 °C in figures 50-52 are uncertain since pyrolysis occurred in thesamples. Temperature dependant conductivity Figure 50. The temperature dependent thermal conductivity for particleboard. Temperature dependant diffusivity Figure 51. The temperature dependent thermal diffusivity for particleboard. Temperature dependant specific heat Figure 52. The temperature dependent specific heat for particleboard. Table 14. At 20°C Moisturecontent Conductivity(W/mK) Diffusivity(mm/s) Specific heat(MJ/m’K) Number ofspecimens 0 0.164 0.179 0.92 6 7 0.176 0.172 1.027 4 5.7 Fibreboard Density of the material was 278 kg/m and the initial moisture content u=7 %. The conductivity values from the measurements on fibreboard do not correspondwell with the values reported by Kollman and Cote (1968). As seen in theliterature survey chapter, figure 8, they report approximately 0.05 W/mK forfibre-based board at room temperature with 12 % moisture in the material thatshould be compared with 0.10 for fibreboard with 7 % moisture content. Asindicated in table 15 the thermal conductivity is rising with increasing moisturecontent, which is logical. The discrepancy may possibly depend on developmentof the materials, the diagrams in the publication by Kollman and Cote is based onmeasurements from 1956. Table 15. At 23 °C Moisturecontent Conductivity Diffusivity(mm/s) Specific heat(MJ/mK) Number ofspecimens (W/mK) 0 0.088 0.323 0.273 4 7 0.101 0.294 0.343 6 The temperature dependant thermal conductivity, thermal diffusivity an specificheat are shown in figures 53-55 respectively. Temperature dependant conductivity Figure 53. The temperature dependent thermal conductivity for fibreboard. Temperature dependant diffusivity Figure 54. The temperature dependent thermal diffusivity for fibreboard. Temperature dependant specific heat Figure 55. The temperature dependent specific heat for fibreboard. 5.8 Polymethylmetacrylate (PMMA) Density of the material was 1176 kg/m’. The thermal properties, figures 56-58, ofPMMA seems to be quite stable in the tested temperature interval. Temperature dependant conductivity Figure 56. The temperature dependent thermal conductivity for polymethylmetacrylate. Temperature dependant diffusivity Figure 57. The temperature dependent thermal diffusivity for polymethylmetacrylate. Temperature dependant specific heat Figure 58. The temperature dependent specific heat for polymethylmetacrylate. 5.9 Insulation and plastic materials 5.9.1 Polystyrene The thermal conductivity, specific heat and diffusivity is rising with thetemperature, see table 16. Table 16. Temperature ConductivityW/mK) Diffusivity(mm/s) Specific heat(MJ/mK) 20°C 0.038 1.42 0.027 85°C 0.048 1.53 0.032 5.9.2 Flexible Polyurethane foam At temperatures near 100 °C the material was“melting”i.e. the material wasshrinking rapidly on the surface near the sensor when the temperature was raised3-5 degrees during measurements. That was the reason for the choice of 85 ℃ asthe highest temperature. As seen in table 17 there is some effect of thetemperature on the thermal properties. The thermal conductivity and the thermaldiffusivity become higher and the specific heat is lower when the temperature isincreased. Table 17.50% RF Temperature Conductivity Diffusivity(mm/s) Specific heat(MJ/m'K) (W/mK) 20°C 0.043 0.46 0.096 85°C 0.051 1.18 0.043 5.9.3 High-density glass wool The high-density glass wool tested in this investigation is treated as an isotropicmaterial i.e. no direction dependence in the thermal properties are supposed toexist. This is an assumption because the samples are more or less orthotropic dueto the orientation of the fibres in the material. This orthotropic behaviour directlyleads to an error in the measurement with the standard module. If the material isanisotropic i.e. the different directions in the material are in the plane andperpendicular to the plane the anisotropy module in the TPS package can be used,but then the temperature dependent volumetric specific heat must be used asinput. To determine the temperature dependent volumetric specific heat by someother method is outside the scope of this project so the standard module associatedwith the above-mentioned problem was used. The results from the measurements o high-density glass wool are shown in figures59-61. The thermal conductivity and thermal diffusivity rises with temperatureand the temperature dependence of the specific heat is more like a parabolafunction.1. Temperature dependant conductivity Figure 59. The temperature dependent thermal conductivity for high-density glass wool. Temperature dependant diffusivity Figure 60. The temperature dependent thermal diffusivity for glass wool. Temperature dependant specific heat Figure 61. The temperature dependent specific heat for glass wool. 5.9.4 Low-density glass wool During testing there was evident that the switch from Kapton insulated sensors toMica insulated ones for high temperatures showed a very unphysical discrepancyin the measured values especially for the low density materials, low density glasswool (29 kg/m’) and mineral wool (33 kg/m). This is a fundamental problem,which must be solved if reliable measurements are going to be performed at hightemperatures. The temperature dependant thermal properties are shown in figures62-64. Temperature dependant conductivity Figure 62. The temperature dependent thermal conductivity for low-density glass wool.There is an unphysical jump between the different sensors, see previous chapter. Temperature dependant diffusivity Figure 63. The temperature dependent thermal diffusivity for low-density glass wool.There is an unphysical jump between the different sensors, see previous chapter. Temperature dependant specific heat Figure 64. The temperature dependent specific heat for low-density glass wool. There isan unphysical jump between the different sensors, see previous chapter. 5.9.5 Mineral Wool As in the measurements on low-density glass wool an unphysical step is presentwhen the sensor is switched from Kapton to Mica. This reason for this must be.further investigated to be able to determine the thermal properties of this type ofmaterial. Figures 65-68 shows the thermal conductivity, thermal diffusivity andthe specific heat respectively. Temperature dependant conductivity Figure 65. The temperature dependent thermal conductivity for low-density mineralwool. There is an unphysica jump between the different sensors, see discussion in thebeginning of this chapter. Temperature dependant diffusivity Figure 66. The temperature dependent thermal diffusivity for low-density mineral woolThere is an unphysical jump between the different sensors, see discussion in thebeginning of this chapter. Temperature dependant specific heat Figure 67. The temperature dependent specific heat for low-density mineral wool. Thereis an unphysical jump between the different sensors, see discussion in the beginning ofthis chapter. 6 Full scale test and calculation 6.1 Experimentalmeasurements A full-scale test (Bostrom 2004) was carried out with a self-compacting concretecontaining polypropylene fibres. The test was a part of a research project aimed todevelop a suitable test methodology for determination of fire spalling. The concrete recipe is shown in table 18. A slab with the dimensions 1800 x 1200x 200 mm’was manufactured. In addition to the full scale specimen cubes withthe dimensions 150 x 150 x 150 mm'were manufactured for measurement of thethermal properties by TPS see chapter 6.2. Table 18. Concrete mixture (Bostrom 2004). Dry materials (kg/m ) Cement Slite (CEM I) 380.76 Limestone filler Limus 25 119.24 Fine gravel 0-8 Satertorp 899.96 Coarse gravel 8-16 Satertorp 721.90 Plasticizer* CemFlux Prefab 5.73 Plasticizer (% of C+F) 1.15% Fibres Fibrin 18um 1.0 Water/moisture (kg/m) Water 149.69 Dilution water 10.02 Moisture in 37.54 material w/c-ratio 0.518 * Plasticizers are given as weight in diluted form, as delivered. The moisture isincluded in ”Moisture in material” in the table. The cube strength of the concrete was measured after 7 days, 28 days and at thetime of the fire test, i.e. at an age of 3 months. In table 19 are the strength valuesgiven. Table 19. Concrete strength w/p=0.40 with fibres (Bostrom 2004). 7 days 28 days Day offire test Mean (MPa) 38.1 53.6 58.6 The moisture content of the specimens was measured on the same cubes as usedfor measurement of compressive strength after 3 months. The cubes wereweighted after the compressive tests and then placed in an oven. They were driedin 105 °℃ for 30 days and thereafter weighted again. The determined moisturecontent was 4.8 %. The fire test was performed according to the fire curve described in EN 1363-1and the tested slab was loaded in compression with 30% off. EN 1363-1 is thenew European varian of the standard tile temperature curve andf is thecompressible strength at room temperature.Temperature measurements withthermocouples, which were attached to the specimen during the casting, wereperformed on 5 different depths, see figure 68. Mean temperature in specimen LS 40 11 Figure 68.Measured temperatures at different depths of the test specimen (Bostrom2004). 6.2 TPS measurements Temperature calculations based on measured thermal properties were performedto investigate the possibility to predict the temperature increase in a fire exposedconcrete slab. Measurements of the thermal properties were performed on concrete from the full-scale test described in chapter 6.1. The cubes with the dimensions 150 x 150 x150 mmwere sliced in pieces with the dimensions 70 x 70x 25 mm'suitable forTPS measurements. The temperature sequence for the test on concrete was chosento be 20,90,110,200,500,600,500,200 and 20 °C. The decrease of thetemperature from 600 to 20 ℃ was performed to see if the thermal conductivitywas to remain constant during cooling as reported in the literature, see chapter1.2.1. At every temperature level the measurement was performed when the testsample had a uniform temperature distribution. In figure 69, the thermalconductivity from the measurements is presented and in figure 70 the thermaldiffusivity is shown. As explained earlier the thermal conductivity, thermaldiffusivity and the specific heat are determined simultaneously i.e. in the samemeasurement. The TPS measurements were preformed on dried material. Two complementary tests of the specific heat were done with a MDSC(Modulated Differential Scanning Calorimeter) to ensure that the TPS sensor had“seen”a representative mix of the material. This extra comparison may not havebeen necessary if a bigger sensor had been used, see discussion in chapter 6.1. Temperature dependant conductivity Figure 69. The thermal conductivity for the tested concrete at different temperatures andplace in the heating cycle. The heating cycle starts at the highest conductivity value at20°C. Temperature dependant diffusivity Figure 70. The thermal diffusivity for the tested concrete at different temperatures andplace in the heating cycle. The heating cycle starts at the highest diffusivity value at20°C. Temperature dependant specific heat Figure 71. Specific heat measured with the TPS method and a Modulated DifferentialScanning Calorimeter. 6.3 Calculation and comparison betweenexperimental and theoretical results The calculation was performed with the finite difference code TASEF (Wickstrom1989) based on thermal properties from TPS measurements and the boundaryconditions from the real fire test described in chapter 6.1. The chosen boundarycondition was the measured temperature 10 millimetres from the fire-exposed sideof the slab and the comparison between calculated and measured temperatureswas done on 25 and 50 millimetres from the fire exposed side. The reason forusing the temperature measured at 10 mm as input and not the furnacetemperature was to eliminate the uncertainty at the radiation/convection boundaryand the fact that the thermal properties were only investigated up to 600C. Additional input in the calculation was the influence of moisture in the material.The TPS measurements were preformed on dried material and the latent heat is not possible to determine with the TPS method. The latent heat of water isaccounted for in the 100-150 degrees region as well as the energy needed forheating up the water to 100 degrees (about 10% ofthe latent heat energy). 700 Figure 72. Temperature curves from the measurement, Tm= temperature measurement,Tc=temperature calculation. The calculated temperature response, Tc, shown in figure 72 shows a goodagreement with temperature measurements Tm. The only significant difference isin the 100°C region which is probably caused by moisture movements or/andpressure dependent boiling points, which are not taken into account in the model. The numerical simulation on the temperature rise of a fire-tested concrete slabbased on measured thermal properties shows a good correspondence with the realfire test. Also the comparison between the specific heat measurements with TPSand MDSC looks promising. Discussion This chapter deals only with an additional discussion about concrete and woodmaterials. Other discussions are present in chapter 5, “Test procedure and results”. 6.4 Concrete materials The measurements on concrete at high temperatures were done with Mica sensorswith diameters 6.631 and 9.719 mm. As discussed in chapter 5.1 the small size ofthe sensors introduced a scatter in the results by the difference in thermalproperties between the aggregate and the cement paste in concrete. The sensorwill determine a more representative mix of the components if the diameter of thesensor is larger. A sensor radius of approximately 24 mm is recommended forfuture measurements. As a consequence the size of the test specimens also oughtto be increased to approximately a thickness of 48 mm and radius of 100 mm. As seen in chapter 1.2.1 the reported values of the thermal properties for differentconcretes may vary relatively much. In the Eurocode 2 part 1-2 (2003) this is dealtwith by giving an upper and a lower curve of the temperature dependentconductivity. The trend from the measurements performed in this project is thatthe conductivity for the tested concretes is slightly higher than the stated values inthe upper curve in the Eurocode. On the other hand the specific heat also seems tobe slightly higher then the Eurocode so the ratio between the properties, thediffusivity, does not diverge. The diffusivity of conventional concrete is slightlylower than for high performance and self-compacting concrete. The results of the numerical calculation based on measured properties shows agood agreement with measured temperature values from a real fire test. This is apromising result. 6.5 Wood and wood based products The first intension with the tests on spruce was to be able to determine the thermalproperties in three different directions. This was shown to be impossible with thestandard equipment. A special sensor and calculation module must be used butthat was outside the scope of this project. But with the anisotropy module of theTPS package at least the properties in two directions could be determined. This ispossible if the volumetric specific heat is known in advance.The volumetricspecific heat at room temperature was determined with the special designedspecific heat sensor in the TPS package and at higher temperatures the value wastaken from the Eurocode, which introduce an unknown amount of uncertainty.Another problem is that when using the anisotropy module it is assumed that thethermal properties are constant in the plane and perpendicular to the plane. This isnot exactly truth for wood so the measurements done in this project on spruceshall be seen as indicative results. Although the measured values on the radial thermal conductivity do in fact correspond well with the values from theEurocode, which is shown when comparing the measured values in figures 48-49with the values from the Eurocode in figure 9. 7 Conclusions Measurements of the thermal properties with the TPS (Transient Plane Source)method have been performed on different kind of building materials. Themeasurements were performed at different temperatures and moisture conditions.The following conclusions for different materials were drawn from the tests. Concrete: A proper diameter of the sensor is important. Three times the size of thebiggest aggregate in the concrete is a role of thumb. ● Good agreement between measurements of the specific heat with TPS andMDSC (Modulated Differential Scanning Calorimeter) were observerd. ●There is already a good agreement between temperature simulation basedon TPS data and a real fire test, despite of the fact that some physicalphenomena are not included in the model. The thermal conductivity and specific heat for high performance and self-compacting concrete is slightly higher than the values in the Eurocode 2part 1-2 (2003) but the diffuPalt 1sivity is approximately the same. The valuesfor conductivity are near the upper curve in the Eurocode. The diffusivityfor conventional concrete is slightly lower than for high performance andself-compacting concrete. ●Because of the small change of thermal conductivity during cooling theresidual value of the thermal conductivity might be a way of looking at thevalue at high temperature. But it ought to be further investigated. Wood and wood based products: Measurement on wood corresponded well with the Eurocode in the radialdirection. ●Repeated measurements on the same temperature level showed big scatter.The reason for this must be further investigated. The measurements at room temperature on particleboard correspondedfairly well with the values from measurements performed at NIST (ID1897). Measurements of the thermal conductivity and diffusivity in threedirections for wood were not included in this project but need to beinvestigated further. Insulating and plastic materials: ●Temperature dependent volumetric specific heat needs to be known if thematerials are anisotropic There are still problems with big differences in measured values betweenKapton insulated sensors and Mica insulated sensors when measurementsare performed on low-density materials like mineral wool and glass wool. If the material has more than two main directions on the thermal propertie:the measurement must be performed with specially designed equipment,which was outside of the scope of this project. The present study shows some pros and cons with the TPS technique. Because ofthe shape of the sensor and the fact that the temperature field not is one-dimensional it is possible to determine the thermal conductivity, diffusivity andvolumetric specific heat simultaneously for isotropic materials. But withanisotropic material the same fact, that the temperature field is not onedimensional, requires knowledge the volumetric specific heat in advance to beable to perform any kind of measurement. 8 Purposed areas for further investigation The TPS approach to measure the thermal properties is very interesting but insome areas the method ought to be investigated further: ●The use of the residual value for concrete after drying at high temperaturefor assessment of the thermal conductivity at high temperature. The goalof this work should be to verify if the thermal conductivity always is stableduring cooling. ●The possibility of measurement of the thermal properties in threedirections in wood and fibre insulation with the transient hot strip. ●The reason for the big scatter in the wood measurements. Is it due tointernal reactions? ● The reason for the big difference between Kapton and Mica sensors whenmeasurements are performed on low-density mineral- and glass wool. References Bazant Z. P., Kaplan M. F. (1996)“Concrete at High Temperatures: MaterialProperties and Mathematical Models”(Longman (Addison-Wesley), London.1996) Bostrom L (2004), “Innovative self-compacting concrete-Development of testmethodology for determination of fore spalling”, SP report 2004:06, Sweden 2004 Collet Y., Tavernier E. (1976) Etude des properties du beton soumis a destemperatures elevees. Comportement du Materiaux Beton en Fonction de laTemperature, Groupe de Travail, Brussels, November Eurocode 2 part 1-2 (2003) Eurocode 2: Design of concrete structures - Part 1-2:General rules - Structural fire design, prEN 1992-1-2, final draft, December 2003 Eurocode 5: Part 1-2(2003). Eurocode 5: Design of timber structures -Part 1-2:General- Structural fire design Gustafsson, S.E. (1991),“Transient Plane Source (TPS) Technique for ThermalConductivity and Thermal Diffusivity Measurements of Solid Materials,”Rev.Sci. Instrum, 62(3),1991, pp 797-804. Gustafsson, S.E. & Long, T.(1995),“Transient Plane Source (TPS) Technique forMeasuring Thermal Properties of Building Materials,” Fire and Material, Vol. 19,1995,pp. 43-49. Harmathy T. Z., Allen L. W., (1973)“Thermal properties of selected masonry unitconcretes”Journ. Amer. Concr. Inst., 70(2), pp. 132-42 Hildebrand G., Peeks M., Skokan A., Reimann M. (1978)“Untersuchung derWechselwirkung von Kernshmelze und Reaktorbeton”Research Paper BMFT RS154,May, KWU, Erlangen Instruction Manual (2001), Hot Disk Constants Analyser,Version 5 Kollamn F. F. P., Cote W. A. (1968)“Principles of Wood Science andTechnology, vol 1, Solid Wood”Springer, Berlin Morabito P., (1989)“Measurment of the thermal properties of different concrete”High Temperatures -High Pressure 21,51-59(1989) NIST Heat Transmission Properties of Insulating and Building Materials DatabaseID1897 Schneider U. (1982)“Behaviour of concrete at high temperatures”DutcherAusschuss fur Stahlbetong, Heft 377 (Werlag W. Ernst und sohn, Berlin 1982) Tye R. P.,Kubicar L. & Lockmuller N. (2003),”The Development of a Standardfor Contact Transient Methods of Measurement of Thermophysical Properties”,FIFTEENTH SYMPOSIUM ON THERMOPHYSICAL PROPERTIES, Boulder,CO, USA June 22-27,2003 Wickstrom U (1989), TASEF User’s Manual, Swedish National Testing andResearch Institute, Sweden 1989 Odeen K., (1968)“Fire Resistance of Prestressed Concrete Double T Units”National Swedish Institute of Material Testing Odeen K., Nordstrom A. (1972),“Termiska egenskaper hos betong vid hogatemperaturer” Statens Provningsanstalt Brandtekniska laboratoriet 1972:1 Appendix A -Data from measurements Conventional concrete No 38 RH0% No 23 RH 33% Th.Conductivity Th.Diffusivity Spec.Heat No 1, RH 97% Th.Conductivity Th.Diffusivity Spec.Heat 20℃, Kapton 9,719 mm Measure 1 2.34 0,98 2,40 Measure 2 2,33 0,97 2,41 Measure 3 2.34 0,98 2.39 Mean value 2,34 0,97 2.40 C.O.V(%) 0,2 0,5 0,3 No 2, RH 97% 20℃, Kapton 9,719 mm Measure 1 2.24 1,09 2,06 Measure 2 2,22 1,06 2,09 Measure 3 2,23 1,08 2.07 Measure 4 2,23 1,05 2.12 Mean value 2.23 1.07 2.08 C.O.V (%) 0,4 1,4 1,2 No 3, RH 97% 20℃, Kapton 9,719 mm Measure 1 2,37 0,82 2,88 Measure 2 2.36 0.81 2.93 Measure 3 2,36 0.81 2,91 Measure 4 2,37 0.81 2.91 Mean value 2,36 0.81 2.91 C.O.V(%) 0,2 0,9 0,7 No 17, RH 75% 20C, Kapton 9,719 mm Measure1 1,89 0,87 2,18 Measure 2 1,90 0.88 2,18 Measure 3 1,90 0.84 2.27 Measure 4 1,90 0.87 2,18 Mean value 1,90 0,86 2,20 C.O.V (%) 0,2 2,1 2,1 No 18, RH 75% 20°C, Kapton 9,719 mm Measure 1 1,97 0,94 2,08 Measure 2 1,97 0,95 2,07 Measure 3 1,98 0,98 2,03 Mean value 1,97 0,96 2,06 C.O.V(%) 0,4 1,9 1,5 No 19, RH 75% 20°℃, Kapton 9,719 mm Measure 1 2,05 0.87 2,36 Measure 2 2,06 0.88 2.35 Measure 3 2,07 0,90 2.30 Measure 4 2,07 0.89 2.33 Measure 5 2.07 0.88 2,35 Mean value 2.06 0,88 2.34 C.O.V(%) 0,5 1,4 1,0 No 21, RH 33% 20C, Kapton 9,719 mm Measure 1 1,81 0.99 1,82 Measure 2 1,81 1,02 1,78 Measure 3 1,82 1.04 1.75 Measure 4 1,81 1.02 1.78 Mean value 1,81 1,02 1,78 C.O.V(%) 0,3 2,0 1,8 No 26, RH 33% 20℃, Kapton 9,719 mm Measure 1 2.01 1,21 1,65 Measure 2 2.01 1,23 1.63 Measure 3 2,00 1,20 1,67 Mean value 2.00 1.21 1,65 C.O.V(%) 0,4 1,3 1,0 No 27, RH 33% 20°℃, Kapton 9,719 mm Measure 1 1.81 1,03 1.75 Measure 2 1,84 1,06 1,75 Measure 3 1,85 1,10 1,68 Measure 4 1,86 1,11 1,67 Measure 5 1,85 1,06 1,74 Measure 6 1,87 1,13 1,66 Mean value 1.84 1,08 1,71 C.O.V(%) 1,1 3,4 2,5 No 32, RH 50% 20℃, Kapton 9,719 mm Measure 1 1,81 1,10 1,64 Measure 2 1,80 1.09 1,65 Measure 3 1,80 1,09 1,65 Measure 4 1,80 1,08 1.66 Mean value 1.80 1.09 1,65 C.O.V (%) 0,4 0,8 0,4 No 33, RH 50% 20°℃, Kapton 9,719 mm Measure 1 1,92 0.94 2,05 Measure 2 1,91 0,92 2,08 Measure 3 1,92 0,93 2,06 Measure 4 1,91 0.92 2,08 Mean value 1,92 0.93 2,07 C.O.V(%) 0,4 1,2 0,8 No 34, RH 50% 20°C, Kapton 9,719 mm Measure 1 2.22 1,03 2.16 Measure 2 2,21 1,01 2,19 Measure 3 2.22 1,03 2,15 Measure 4 2,21 1,01 2,19 Measure 5 2,21 1,01 2.18 Mean value 2,21 1,02 2,18 C.O.V (%) 0,3 1,0 0,8 No 35, RH 50% Measure 1 1,80 0,91 1,97 Measure 2 1,79 0,90 1,99 Measure 3 1,78 0.90 1,98 Measure 4 1,78 0.90 1,97 Mean value 1,79 0,90 1,98 C.O.V(%) 0,4 0,8 0,5 No 36, RH 0% 20°C, Kapton 9,719 mm Measure 1 1,73 0.97 1.78 Measure 2 1,75 1,01 1,73 Measure 3 1,75 1,03 1,70 Measure 4 1,75 1.05 1.67 Mean value 1,75 1.02 1,72 C.O.V(%) 0,6 3,4 2,9 No 37, RH0% 20℃,Kapton 9,719 mm Measure 1 1,55 0.90 1,73 Measure 2 1,55 0,91 1,70 Measure 3 1,55 0,90 1,72 Mean value 1,55 0.90 1,72 C.O.V (%) 0,2 0,5 0,7 No 38, RH 0% 20℃, Kapton 9,719 mm Measure 1 1,53 0.85 1,80 Measure 2 1,54 0.84 1.82 Measure 3 1,54 0.84 1,84 Measure 4 1.54 0.86 1,80 Measure 5 1,55 0.87 1,78 Mean value 1.54 0,85 1,81 C.O.V(%) 0,5 1,5 1,2 No 4, RH 97% Th.Conductivity Th.Diffusivity Spec.Heat 90°C, Kapton 9,719 mm Measure 1 2,21 0.91 2.45 Measure 2 2.18 0,88 2.48 Measure 3 2,16 0,84 2.56 Measure 4 1,83 0,79 2.33 Measure 5 1,82 0,73 2.48 Mean value 2,04 0,83 2.46 C.O.V(%) 9,8 8,6 3,3 No 5, RH 97% 90°℃, Kapton 9,719 mm Measure 1 2,18 0,79 2.76 Measure 2 2,22 0.82 2,70 Measure 3 2,22 0,88 2.53 Measure 4 2,22 0,84 2,63 Mean value 2,21 0,83 2,66 C.O.V(%) 0,8 4,4 3,8 No 6, RH 97% 90°C, Kapton 9,719 mm Measure 1 2,20 0,78 2,82 Measure 2 2,21 0,80 2,76 Measure 3 2,20 0.81 2,73 Mean value 2,20 0,79 2,77 C.O.V (%) 0,2 1,8 1,7 No 9, RH 75% 90C, Kapton 9,719 mm Measure 1 2.04 0,97 2,11 Measure 2 1.98 0.92 2,15 Measure 3 1,94 0,91 2,14 Measure 4 1,76 0,88 1,99 Measure 5 1,75 0.85 2,06 Mean value 1,89 0,91 2,09 C.O.V(%) 7,1 5,0 3,1 No 22, RH 33% 90℃, Kapton 9,719 mm Measure 1 1,78 0,77 2,31 Measure 2 1,79 0,78 2,29 Measure 3 1,79 0,78 2,31 Measure 4 1,80 0,86 2,10 Measure 5 1,78 0,80 2.22 Measure 6 1,76 0,79 2,24 Measure 7 1,72 0,77 2.24 Mean value 1,77 0,79 2.24 C.O.V(%) 1,4 3,9 3,2 No 38, RH 0% Measure 1 1,62 0,70 2,29 Measure 2 1,61 0.73 2.20 Measure 3 1,61 0,73 2,20 Measure 4 1,61 0,69 2,35 Measure 5 1,62 0,71 2,27 Mean value 1,61 0,71 2,26 C.O.V (%) 0,3 2.8 2,9 No 32 Th.Conductivity Th.Diffusivity Spec.Heat 20℃ after drying at 105℃, Kapton 9,719 mm Measure 1 1,60 0,99 1,62 Measure 2 1,61 1,03 1,56 Measure 3 1,61 1.02 1,57 Measure 4 1,59 1.02 1,55 Measure 5 1,61 0,99 1,63 Measure 6 1.60 1,07 1,50 Measure 7 1.61 1,00 1,61 Mean value 1,60 1,02 1,58 C.O.V(%) 0,4 2,8 2.8 20℃ after drying at 200 °C, Kapton 9,719 mm Measure 1 1,53 1.02 1,50 Measure 2 1,54 1,03 1,50 Measure 3 1,56 1,04 1,49 Measure 4 1,55 1,05 1,47 Measure 5 1,55 1,04 1,49 Mean value 1,55 1,04 1,49 C.O.V(%) 0,5 1,2 0,8 No 33 20C after drying at 105℃, Kapton 9,719 mm Measure 1 1,66 0,98 1,69 Measure 2 1,65 0,89 1,85 Measure 3 1,65 0,94 1,75 Measure 4 1,66 0.94 1,76 Measure 5 1,64 0,99 1.65 Measure 6 1,66 0,99 1,67 Measure 7 1,64 0.99 1,66 Mean value 1,65 0,96 1,72 C.O.V(%) 0,5 3,9 4,2 20°℃ after drying at 200 °C, Kapton 9,719 mm Measure 1 1,45 0,75 1,95 Measure 2 1,44 0,80 1,79 Measure 3 1,47 0.84 1,76 Measure 4 1,47 0,76 1,93 Measure 5 1,46 0,76 1,93 Measure 6 1,45 0,74 1,96 Measure 7 1,47 0,85 1,74 Mean value 1,46 0,78 1.87 C.O.V(%) 0,8 5,7 5,3 20°C after drying at 105℃, Kapton 9,719 mm Measure 1 2,02 0,91 2,21 Measure 2 1,97 0,87 2,26 Measure 3 1,97 0,91 2,17 Measure 4 1.94 0,87 2,22 Measure 5 1,96 0,85 2,31 Measure 6 1,97 0,93 2,12 Measure 7 1,97 0,91 2.16 Mean value 1,97 0.89 2,21 C.O.V(%) 1,2 3,3 3,0 20℃ after drying at 200°C, Kapton 9,719 mm Measure 1 1,18 0,57 2,07 Measure 2 1,18 0,58 2.05 Measure 3 1,18 0,56 2,10 Measure 4 1,17 0,56 2,09 Measure 5 1,17 0,57 2,07 Mean value 1,18 0,57 2,08 C.O.V (%) 0.4 1,3 1.0 High performance concrete No 54 dried after room temperature test Th.Conductivity Th.Diffusivity Spec.Heat 600C, Mica 6,631 mm Measure 1 1,59 0,38 4,15 Measure 2 1,57 0,37 4,26 Measure 3 1,57 0,37 4.22 Measure 4 1,57 0,37 4.25 Mean value 1,58 0.37 4.22 C.O.V(%) 0,6 1,8 1,2 No 46, RH 75% Th.Conductivity Th.Diffusivity Spec.Heat 20C, Kapton 9,719 mm Measure 1 2,20 0,95 2,31 Measure 2 2,21 0,95 2,31 Measure 3 2,20 0,96 2.30 Measure 4 2,20 0.97 2.26 Measure 5 2,20 0,98 2,25 Mean value 2,20 0,96 2.29 C.O.V(%) 0,1 1,3 1,4 No 47, RH 75% 20°℃, Kapton 9,719 mm Measure 1 2.14 0,87 2.46 Measure 2 2,15 0.90 2.40 Measure 3 2,15 0,90 2.37 Measure 4 2,16 0,91 2,36 Mean value 2,16 0,91 2.36 C.O.V(%) 0,3 1,9 1,7 No 54, RH 75% 20°C, Kapton 9,719 mm Measure 1 2.21 1.00 2,20 Measure 2 2,21 1,02 2.16 Measure 3 2.21 1,02 2,16 Measure 4 2,2 1,04 2,13 Measure 5 2,21 1.01 2,19 Mean value 2,21 1,02 2,17 C.O.V (%) 0,1 1,2 1,1 No 56, RH0% 20℃, Kapton 9,719mm Measure 1 1.84 1,03 1,79 Measure 2 1.84 1,07 1,73 Measure 3 1.84 1,10 1,67 Measure 4 1,84 1,04 1,78 Mean value 1,84 1,06 1,74 C.O.V(%) 0,1 3,0 13,0 No 57, RH 0% 20°℃, Kapton 9,719 mm Measure 1 1,96 1,03 1,91 Measure 2 1,97 1.05 1,87 Measure 3 1,97 1,03 1,90 Measure 4 1,96 1.03 1.91 Mean value 1,96 1,04 1,90 C.O.V (%) 0,1 1,2 1,1 No 58, RH 0% 20°℃, Kapton 9,719 mm Measure 1 1.92 0,90 2,14 Measure 2 1,94 0.94 2.07 Measure 3 1,94 0,92 2,12 Measure 4 1,96 0.98 1.99 Measure 5 1,94 0,95 2.04 Mean value 1,94 0,94 2,07 C.O.V(%) 0,6 3,6 3,1 No 61, RH 50%20℃, Kapton 9,719 mm Measure 1 2,16 0,98 2,20 Measure 2 2,17 0,99 2,20 Measure 3 2.17 0,99 2,20 Measure 4 2,15 0,96 2,25 Measure 5 2,16 0,97 2,22 Measure 6 2,16 0,97 2,23 Mean value 2,16 0,98 2.22 C.O.V (%) 0.4 1,2 0,9 No 62, RH 50% 20°C, Kapton 9,719 mm Measure 1 2,25 1,21 1,86 Measure 2 2,26 1,22 1,85 Measure 3 2.25 1,25 1,79 Measure 4 2,25 1,21 1,86 Measure 5 2,25 1,21 1.86 Mean value 2,25 1,22 1,85 C.O.V(%) 0,2 1,5 1,6 Self-compacting concrete No 75, RH 0% Th.Conductivity Th.Diffusivity Spec.Heat 600°C, Mica 9,719 mm Measure 1 1,33 0,34 3,94 Measure 2 1,33 0.33 4.04 Measure 3 1,34 0,30 4.47 Measure 4 1,30 0.27 4.79 Mean value 1,32 0,31 4,31 C.O.V(%) 1,3 9,7 9,1 No 69 dried after room temperature testTh.Conductivity Th.Diffusivity Spec.Heat 500°C, Mica 6.631 mm Measure 1 1,62 0.46 3.52 Measure 2 1,62 0.45 3,57 Measure 3 1,60 0,44 3,66 Measure 4 1,61 0,46 3.49 Mean value 1,61 0.45 3.56 C.O.V(%) 0,5 2.4 2,2 600°C, Mica 6.631 mm Measure 1 1,52 0.39 3.90 Measure 2 1,53 0.38 4.01 Measure 3 1,54 0,37 4,15 Measure 4 1,53 0,39 3.92 Mean value 1,53 0,38 3.99 C.O.V (%) 0,7 2,3 2,8 No 69, RH 75%Th.Conductivity Th.Diffusivity Spec.Heat 20℃, Kapton 9,719 mm Measure 1 2,24 1,00 2.25 Measure 2 2,29 1,00 2.30 Measure 3 2,25 1,02 2,21 Measure 4 2,25 1,02 2,21 Measure 5 2,26 0.97 2,33 Mean value 2,26 1.00 2.26 C.O.V(%) 0,9 2,0 2,3 No 72, RH 75% 20°℃, Kapton 9,719 mm Measure 1 2.44 0,85 2.88 Measure 2 2,44 0.85 2.86 Measure 3 2.45 0.88 2.77 Measure 4 2.44 0.87 2.82 Measure 5 2.44 0.88 2.76 Mean value 2.44 0,87 2.82 C.O.V(%) 0,1 1,9 1,9 No 75,RH 0% 20°C, Kapton 9,719 mm Measure 1 1,95 0,97 2.01 Measure 2 1,97 0,96 2.05 Measure 3 1,96 0,95 2.05 Measure 4 1,97 1,00 1,98 Measure 5 1.96 0.93 2,11 Mean value 1,96 0.96 2.04 C.O.V(%) 0,4 2,7 2,5 No 75,RH 75% 20°℃, Kapton 9,719 mm Measure 1 2,20 0,91 2.41 Measure 2 2,21 0,95 2.33 Measure 3 2,21 0,95 2.32 Measure 4 2,21 0,95 2.33 Measure 5 2.22 0,97 2.29 Measure 6 2.22 0,96 2.30 Mean value 2,21 0,95 2,33 C.O.V(%) 0,3 1,9 1,7 No 79, RH 0%20°℃, Kapton 9,719 mm Measure 1 1.97 0,87 2,26 Measure 2 1,97 0,88 2,25 Measure 3 1,96 0,85 2,30 Measure 4 1.98 0.91 2.17 Measure 5 2.00 0,87 2.30 Mean value 1,98 0,88 2.25 C.O.V (%) 0,8 2,6 2,3 No 80, RH 0% 20°℃, Kapton 9,719 mm Measure 1 1,88 0,94 2,00 Measure 2 1.89 0.96 1,96 Measure 3 1,88 0,98 1,93 Measure 4 1,89 0,96 1,96 Mean value 1,89 0,96 1,96 C.O.V(%) 0,2 1,6 1,5 No 81, RH 0%20°℃, Kapton 9,719 mm Measure 1 2,12 0,87 2.43 Measure 2 2,13 0.91 2.34 Measure 3 2,13 0,91 2.33 Measure 4 2,14 0.93 2,28 Measure 5 2,13 0,93 2.29 Mean value 2,13 0,91 2,34 C.O.V(%) 0,2 2,7 2,5 Cement paste No 100,RH 0% Measure 2 0,50 0,19 2,58 Measure 3 0,50 0,19 2.66 Measure 4 0,49 0,19 2.62 Mean value 0.49 0,19 2,61 C.O.V (%) 0.4 1,6 1,4 200°C, Mica 6,631 mm Measure 1 0,47 0.20 2,37 Measure 2 0.47 0,19 2,41 Measure 3 0,47 0,19 2.46 Measure 4 0.47 0,20 2.32 Mean value 0.47 0,20 2,39 C.O.V (%) 0,2 2,6 2,5 20°℃, Mica 6,631 mm Measure 1 0.37 0.28 1,34 Measure 2 0.38 0.29 1,30 Measure 3 0,38 0,30 1,28 Measure 4 0,38 0,30 1,29 Mean value 0,38 0,29 1,30 C.O.V (%) 1,3 3,2 2,1 Hig density spruce Ax.Th.Conductivity Ax.Th.Diffusivity Rad.Th.Conductivity Rad.Th.Diffusivity Measure 1 0,55 0,74 0,11 0,14 Measure 2 0,56 0,75 0,11 0,14 Measure 3 0,56 0,75 0,11 0,14 Measure 4 0.56 0,76 0,11 0,15 Measure 5 0,57 0,77 0,11 0,15 Mean value 0,56 0,76 0,11 0,15 C.O.V (%) 1,2 1,2 1,4 1.4 110°℃, Kapton 9,719 mm, Specific heat 1.14 Measure 1 0.42 0,37 0,15 0,13 Measure 2 0.41 0,36 0,15 0,13 Measure 3 0.44 0,39 0,13 0,11 Mean value 0.43 0,37 0,14 0,12 C.O.V(%) 3,8 3,8 8.2 8,2 150C, Kapton 9,719 mm, Specific heat 1.21 Measure 1 0.52 0,43 0,12 0,10 Measure 2 0,54 0,45 0,10 0.08 Measure 3 0,51 0,42 0,13 0,10 Mean value 0,53 0,43 0,12 0,10 C.O.V(%) 2,8 2,8 13,4 13,4 Low density spruce Ax.Th.Conductivity Ax.Th.Diffusivity Rad.Th.Conductivity Rad.Th.Diffusivity 20℃, Kapton 9,719 mm, Specific heat 0.612 Measure 1 0,24 0.39 0,12 0.20 Measure 2 0,25 0.40 0,11 0,18 Measure 3 0.26 0.42 0,10 0,16 Measure 4 0.24 0.40 0,11 0,18 Mean value 0,246 0.40 0,111 0,182 C.O.V(%) 3,6 3,6 9,5 9,5 90°C, Kapton 9,719 mm, Specific heat 0.7 Measure 1 0.35 0,50 0,10 0,15 Measure 2 0,41 0,59 0.08 0,11 Measure 3 0,42 0,60 0,09 0,13 Measure 4 0,23 0,33 0,15 0,22 Mean value 0,354 0,51 0,107 0,153 C.O.V(%) 24,7 24,7 31,8 31.8 110℃, Kapton 9,719 mm, Specific heat 0.78 Measure 1 0.27 0,34 0,16 0,21 Measure 2 0,37 0,48 0,09 0,12 Measure 3 0.28 0,36 0,12 0,16 Measure 4 0,32 0,41 0,10 0,13 Measure 5 0,35 0.45 0,07 0,09 Measure 6 0,29 0,37 0,15 0,19 Measure 7 0,28 0,36 0.14 0,18 Mean value 0,308 0.39 0,120 0,154 C.O.V (%) 13,7 13,7 27,5 27,5 0,33 0.40 0,11 0,13 0,38 0.46 0.06 0,07 0.44 0,53 0.08 0,10 0.43 0.52 0,07 0,08 0.28 0,34 0,14 0,17 0,373 0,45 0,091 0,110 18,4 18,4 35,2 35,2 Particleboard Dry Th.Conductivity Th.Diffusivity Spec.Heat 190C, Kapton 6.403 mm Moist (7%) 23℃, Kapton 6.403 mm Fibreboard Dry Th.Conductivity Th.Diffusivity Spec.Heat 23C, Kapton 6.403 mm Measure 1 0,09 0,33 0,26 Measure 2 0,09 0,33 0,27 Measure 3 0,09 0,32 0,28 Measure 4 0,09 0.32 0,28 Mean value 0,09 0,32 0.27 C.O.V. (%) 1.99 1.94 3.92 75°C, Kapton 6.403 mm Measure 1 0,10 0,22 0.47 Measure 2 0,10 0,23 0.45 Measure 3 0,11 0,25 0.43 Mean value 0,10 0,23 0.45 C.O.V. (%) 2,73 6.66 3,85 105°C, Kapton 6.403 mm Measure 1 0,11 0,24 0.44 Measure 2 0,11 0,25 0.42 Measure 3 0.10 0,25 0,41 Measure 4 0,11 0,25 0,43 Measure 5 0,10 0,21 0,47 Measure 6 0.10 0,22 0.47 Measure 7 0,11 0.24 0.45 Mean value 0,10 0,24 0,44 C.O.V. (%) 1,80 6,70 5,64 150°C, Kapton 6.403 mm Measure 1 0,10 0,22 0,48 Measure 2 0,10 0.20 0,49 Measure 3 0,11 0.23 0,46 Mean value 0,10 0,22 0.48 C.O.V. (%) 4,15 7,02 2.99 190°℃, Kapton 6.403 mm Measure 1 0,10 0,18 0,57 Measure 2 0,11 0,21 0,51 Measure 3 0,10 0,16 0,59 Mean value 0,10 0,18 0,56 Moist (7%) Th.Conductivity Th.Diffusivity Spec.Heat 23C, Kapton 6.403 mm Measure 1 0,10 0,29 0.36 Measure 2 0,10 0,29 0,36 Measure 3 0.10 0,28 0.37 Measure 4 0,10 0,31 0.32 Measure 5 0,10 0,30 0.32 Measure 6 0,10 0,30 0,33 Mean value 0,10 0.29 0,34 C.O.V. (%) 2,80 3,69 6,33 Polymethylmetacrylate(PMMA) Th.Conductivity Th.Diffusivity Spec.Heat Measure 1 0,2101 0,1152 1,8235 Measure 2 0,2090 0,1133 1.8450 Measure 3 0,2086 0,1146 1,8207 Measure 4 0.2061 0,1084 1.9016 Measure 5 0,216 0,121 1,792 Measure 6 0,216 0,118 1,825 Measure 7 0,220 0,116 1,907 Mean value 0,212 0,115 1,845 C.O.V.(%) 2,4 3,3 2,3 53℃, Kapton 6.403 mm Measure 1 0,201 0,098 2,055 Measure 2 0.203 0.104 1,958 Mean value 0,202 0,101 2.006 C.O.V. (%) 0,5 3,9 3,4 77℃, Kapton 6.403 mm Measure 1 0,199 0.093 2,149 Measure 2 0,202 0.097 2,088 Measure 3 0.203 0,098 2,080 Mean value 0,202 0,096 2,106 C.O.V. (%) 1.0 2,8 1,8 Polystyrene Th.Conductivity Th.Diffusivity Spec.Heat Measure 1 0,038 1,29 0,030 Measure 2 0,038 1,29 0,030 Measure 3 0,039 1,38 0,028 Measure 4 0,038 1,42 0,027 Measure 5 0,039 1,52 0.025 Measure 6 0,039 1,54 0.025 Measure 7 0,039 1,46 0,027 Measure 8 0,039 1,46 0,026 Mean value 0,038 1,42 0,027 C.O.V.(%) 0,5 6,7 6,6 85°C, Kapton 9,719 mm Measure 1 0,049 1.64 0,030 Measure 2 0,048 1,62 0,030 Measure 3 0.048 1,52 0.032 Measure 4 0,048 1,45 0.033 Measure 5 0,048 1,58 0,031 Measure 6 0,048 1,43 0.034 Measure 7 0.048 1,44 0,034 Mean value 0,048 1,53 0,032 C.O.V.(%) 0,3 5,9 5,6 Polyurethane Th.Conductivity Th.Diffusivity Spec.Heat Measure 1 0,043 0,42 0,10 Measure 2 0.043 0,34 0,13 Measure 3 0,042 0,39 0,11 Measure 4 0,042 0,38 0,11 Measure 5 0,042 0,37 0,11 Measure 6 0,042 0.34 0,12 Mean value 0.042 0,37 0,114 C.O.V(%) 1,5 8,0 7,4 85°C, Kapton 9,719 mm Measure 1 0,051 1,11 0,046 Measure 2 0,051 1,23 0,042 Measure 3 0,052 1,20 0,043 Measure 4 0.051 1,18 0,043 Measure 5 0.051 1,20 0,043 Measure 6 0.051 1,23 0.041 Measure 7 0.051 1,14 0,045 Mean value 0,051 1,18 0,043 C.O.V(%) 0,5 3,7 4,0 High-density glass wool Th.Conductivity Th.Diffusivity Spec.Heat 20°C, Kapton 9,719 mm Measure 1 0,047 0.40 0,12 Measure 2 0,044 0.32 0,14 Measure 3 0,045 0,35 0,13 Measure4 0,047 0,50 0.09 Mean value 0,046 0,39 0,119 C.O.V.(%) 3,5 20,1 15,8 150℃, Mica 9,719 mm Measure 1 0,085 0,68 0,12 Measure 2 0,077 0,36 0.21 Measure 3 0,076 0.36 0.21 Mean value 0,079 0,47 0,184 C.O.V.(%) 5,9 40,0 28,1 200°C, Mica 9,719 mm Measure 1 0,082 0,34 0.24 Measure 2 0,082 0,36 0,23 Measure 3 0,083 0,36 0,23 Mean value 0,082 0,36 0,232 C.O.V. (%) 0,4 2,8 2,5 300°℃, Mica 9,719mm Measure 1 0,10 0,50 0,20 Measure 2 0,10 0.55 0,18 Measure 3 0,10 0,70 0,15 Mean value 0,100 0,58 0,175 C.O.V.(%) 1,9 17,4 14,8 500°C, Mica 9,719 mm Measure 1 0,15 1,45 0,11 Measure 2 0,18 1,47 0,12 Measure 3 0,16 2,01 0,08 Mean value 0,163 1.65 0,102 C.O.V. (%) 9,0 19,4 21,9 Low-density glass wool Th.Conductivity Th.Diffusivity Spec.Heat Low-density mineral wool Th.ConductivityTTh.Diffusivity Spec.Heat Measure 1 0,042 1,37 0,031 Measure 2 0,042 1,29 0,032 Measure 3 0,042 1,43 0,029 Measure 4 0,042 1,45 0,029 Mean value 0,042 1,39 0,030 C.O.V.(%) 0,4 5,0 5,0 90°C, Kapton 6,631 mm Measure 1 0.053 1,69 0,032 Measure 2 0,053 1,66 0.032 Measure 3 0,053 1,70 0,031 Mean value 0,053 1,69 0,031 C.O.V.(%) 0,5 1,2 1,0 110°℃, Kapton 6,631 mm Measure 1 0,057 1,79 0,032 Measure 2 0,057 1,80 0,032 Measure 3 0,057 1,82 0.031 Mean value 0,057 1,80 0,032 C.O.V.(%) 0,5 0,7 0,8 Th.ConductivityTTh.Diffusivityy5Spec.Heat 20°C, Mica 6,631 mm Measure 1 0,064 0,53 0,12 Measure 2 0,063 0,53 0,12 Measure 3 0,063 0,53 0,12 Mean value 0,063 0,53 0,120 C.O.V. (%) 0,4 0,4 0,6 90C, Mica 6,631 mm Measure 1 0,075 0,68 0,11 Measure 2 0,075 0,70 0,11 Measure 3 0,076 0,69 0,11 Mean value 0,075 0,69 0,109 C.O.V.(%) 0,5 1,0 1,2 110°C, Mica 6,631 mm Measure 1 0,080 0,75 0,11 Measure 2 0,080 0.76 0,10 Measure 3 0,079 0.75 0,11 Mean value 0,080 0,76 0,105 C.O.V. (%) 0,2 0,9 1,0 200°C, Mica 6,631 mm Measure 1 0,10 0.97 0,11 Measure 2 0,10 0.96 0,11 Measure 3 0,10 0,99 0,11 Mean value 0,104 0,97 0,107 C.O.V.(%) 0,7 1,8 1,5 Measure 1 0.14 1,60 0,086 Measure 2 0,14 1,63 0,084 Measure 3 0,14 2.00 0,072 Mean value 0,140 1,74 0.081 C.O.V. (%) 2,5 12,6 9,4 500°C, Mica 6,631 mm Measure 1 0,27 2,59 0.10 Measure 2 0,27 2,65 0,10 Measure 3 0,27 2.68 0.10 Mean value 0,269 2,64 0,102 C.O.V.(%) 0,9 1,7 2,6 600C, Mica 6,631 mm Measure 1 0,35 3,48 0,10 Measure 2 0,36 3.49 0,10 Measure 3 0,37 2.95 0,12 Mean value 0,36 3,31 0,11 C.O.V.(%) 2,5 9,5 12.4 SP Swedish National Testing and Research Institute develops and transfers technologyfor improving competitiveness and quality in industry, and for safety, conservation ofresources and good environment in society as a whole. With Swedens widest andmost sophisticated range of equipment and expertise for technical investigation,measurement, testing and certfication, we perform research and development in closeliaison with universities, institutes of technologyand international partners. SP is a EU-notified body and accredited test laboratory. Our headquarters are inBoras, in the west part of Sweden. SP Fire TechnologySP REPORT 2004:46ISBN 91-85 303-22-4 ISSN 0284-5172 SP Swedish National Testing and Research Institute SP Fire TechnologySP REPORT Box E-BORAS, SWEDENTelephone:+ Telefax: +-mail: info@sp.se, Internet: www.sp.se 本文对瞬态平面热源法测试建筑材料变温条件下的导热系数进行了详尽的报道,分别介绍了多重不同建筑材料在常温和高温下的导热系数、热扩散率和体积比热容的测试过程,并且介绍了一部分建筑材料热性能受湿度的影响结果。
确定


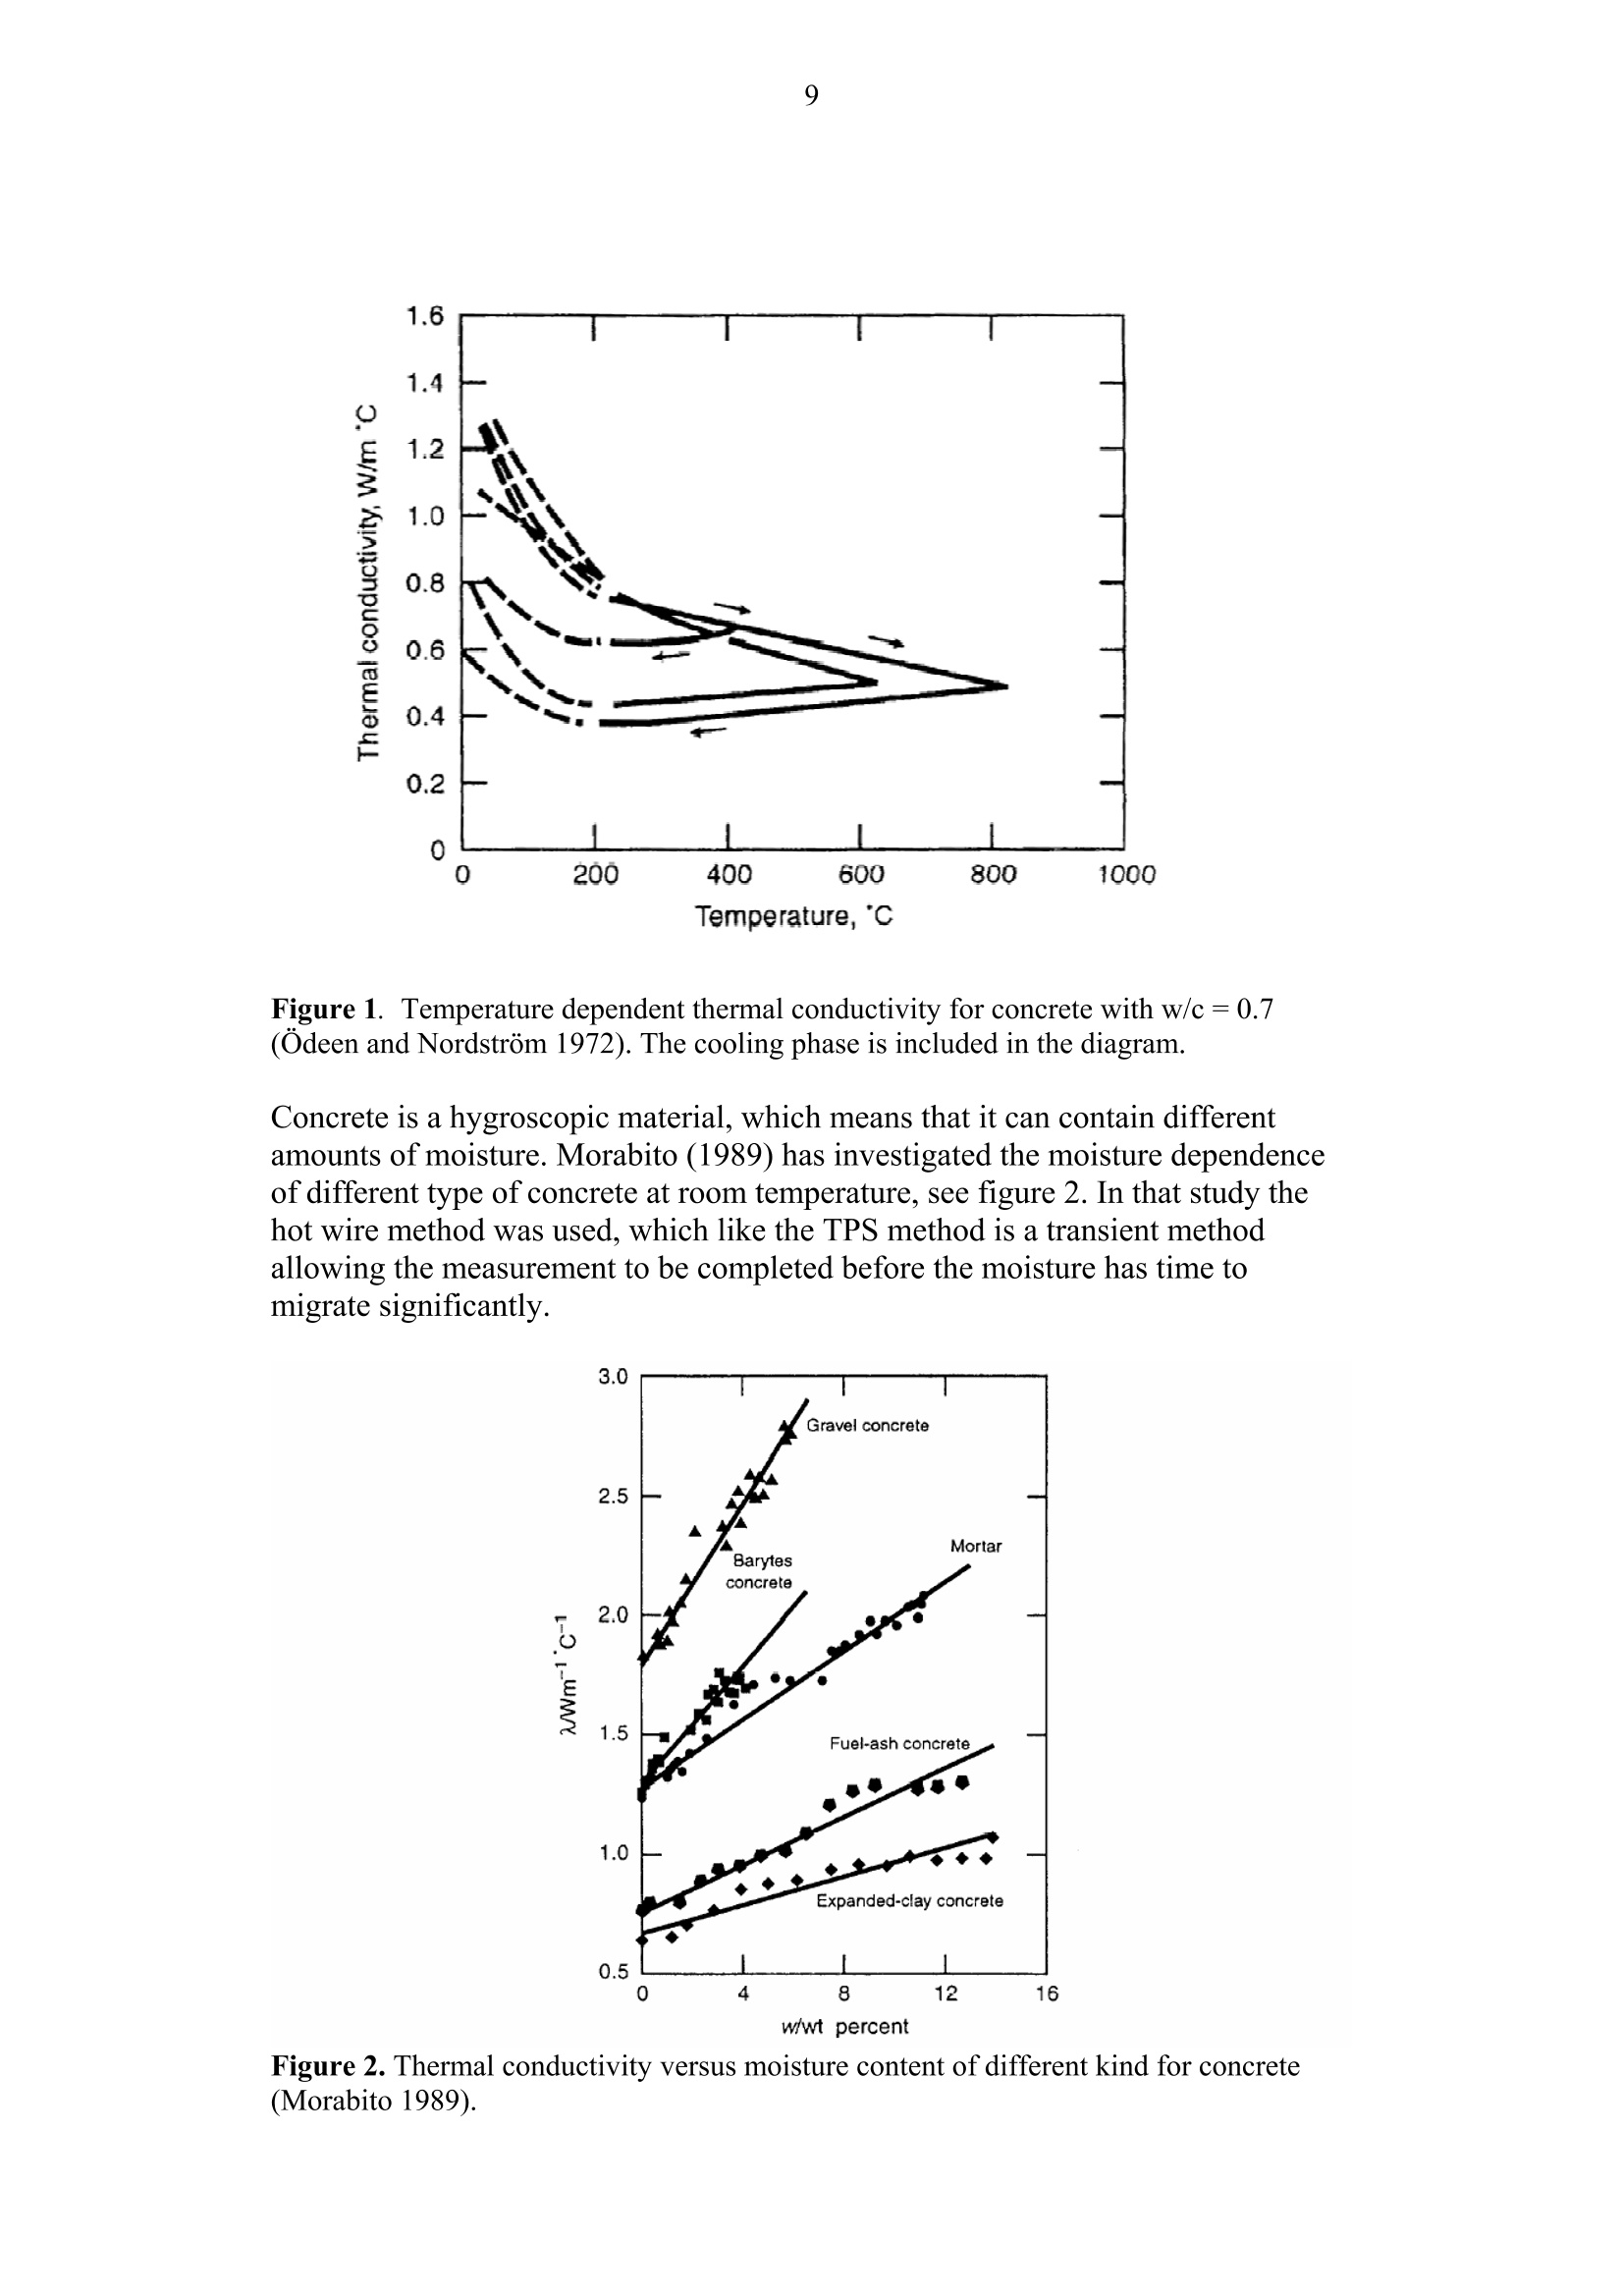
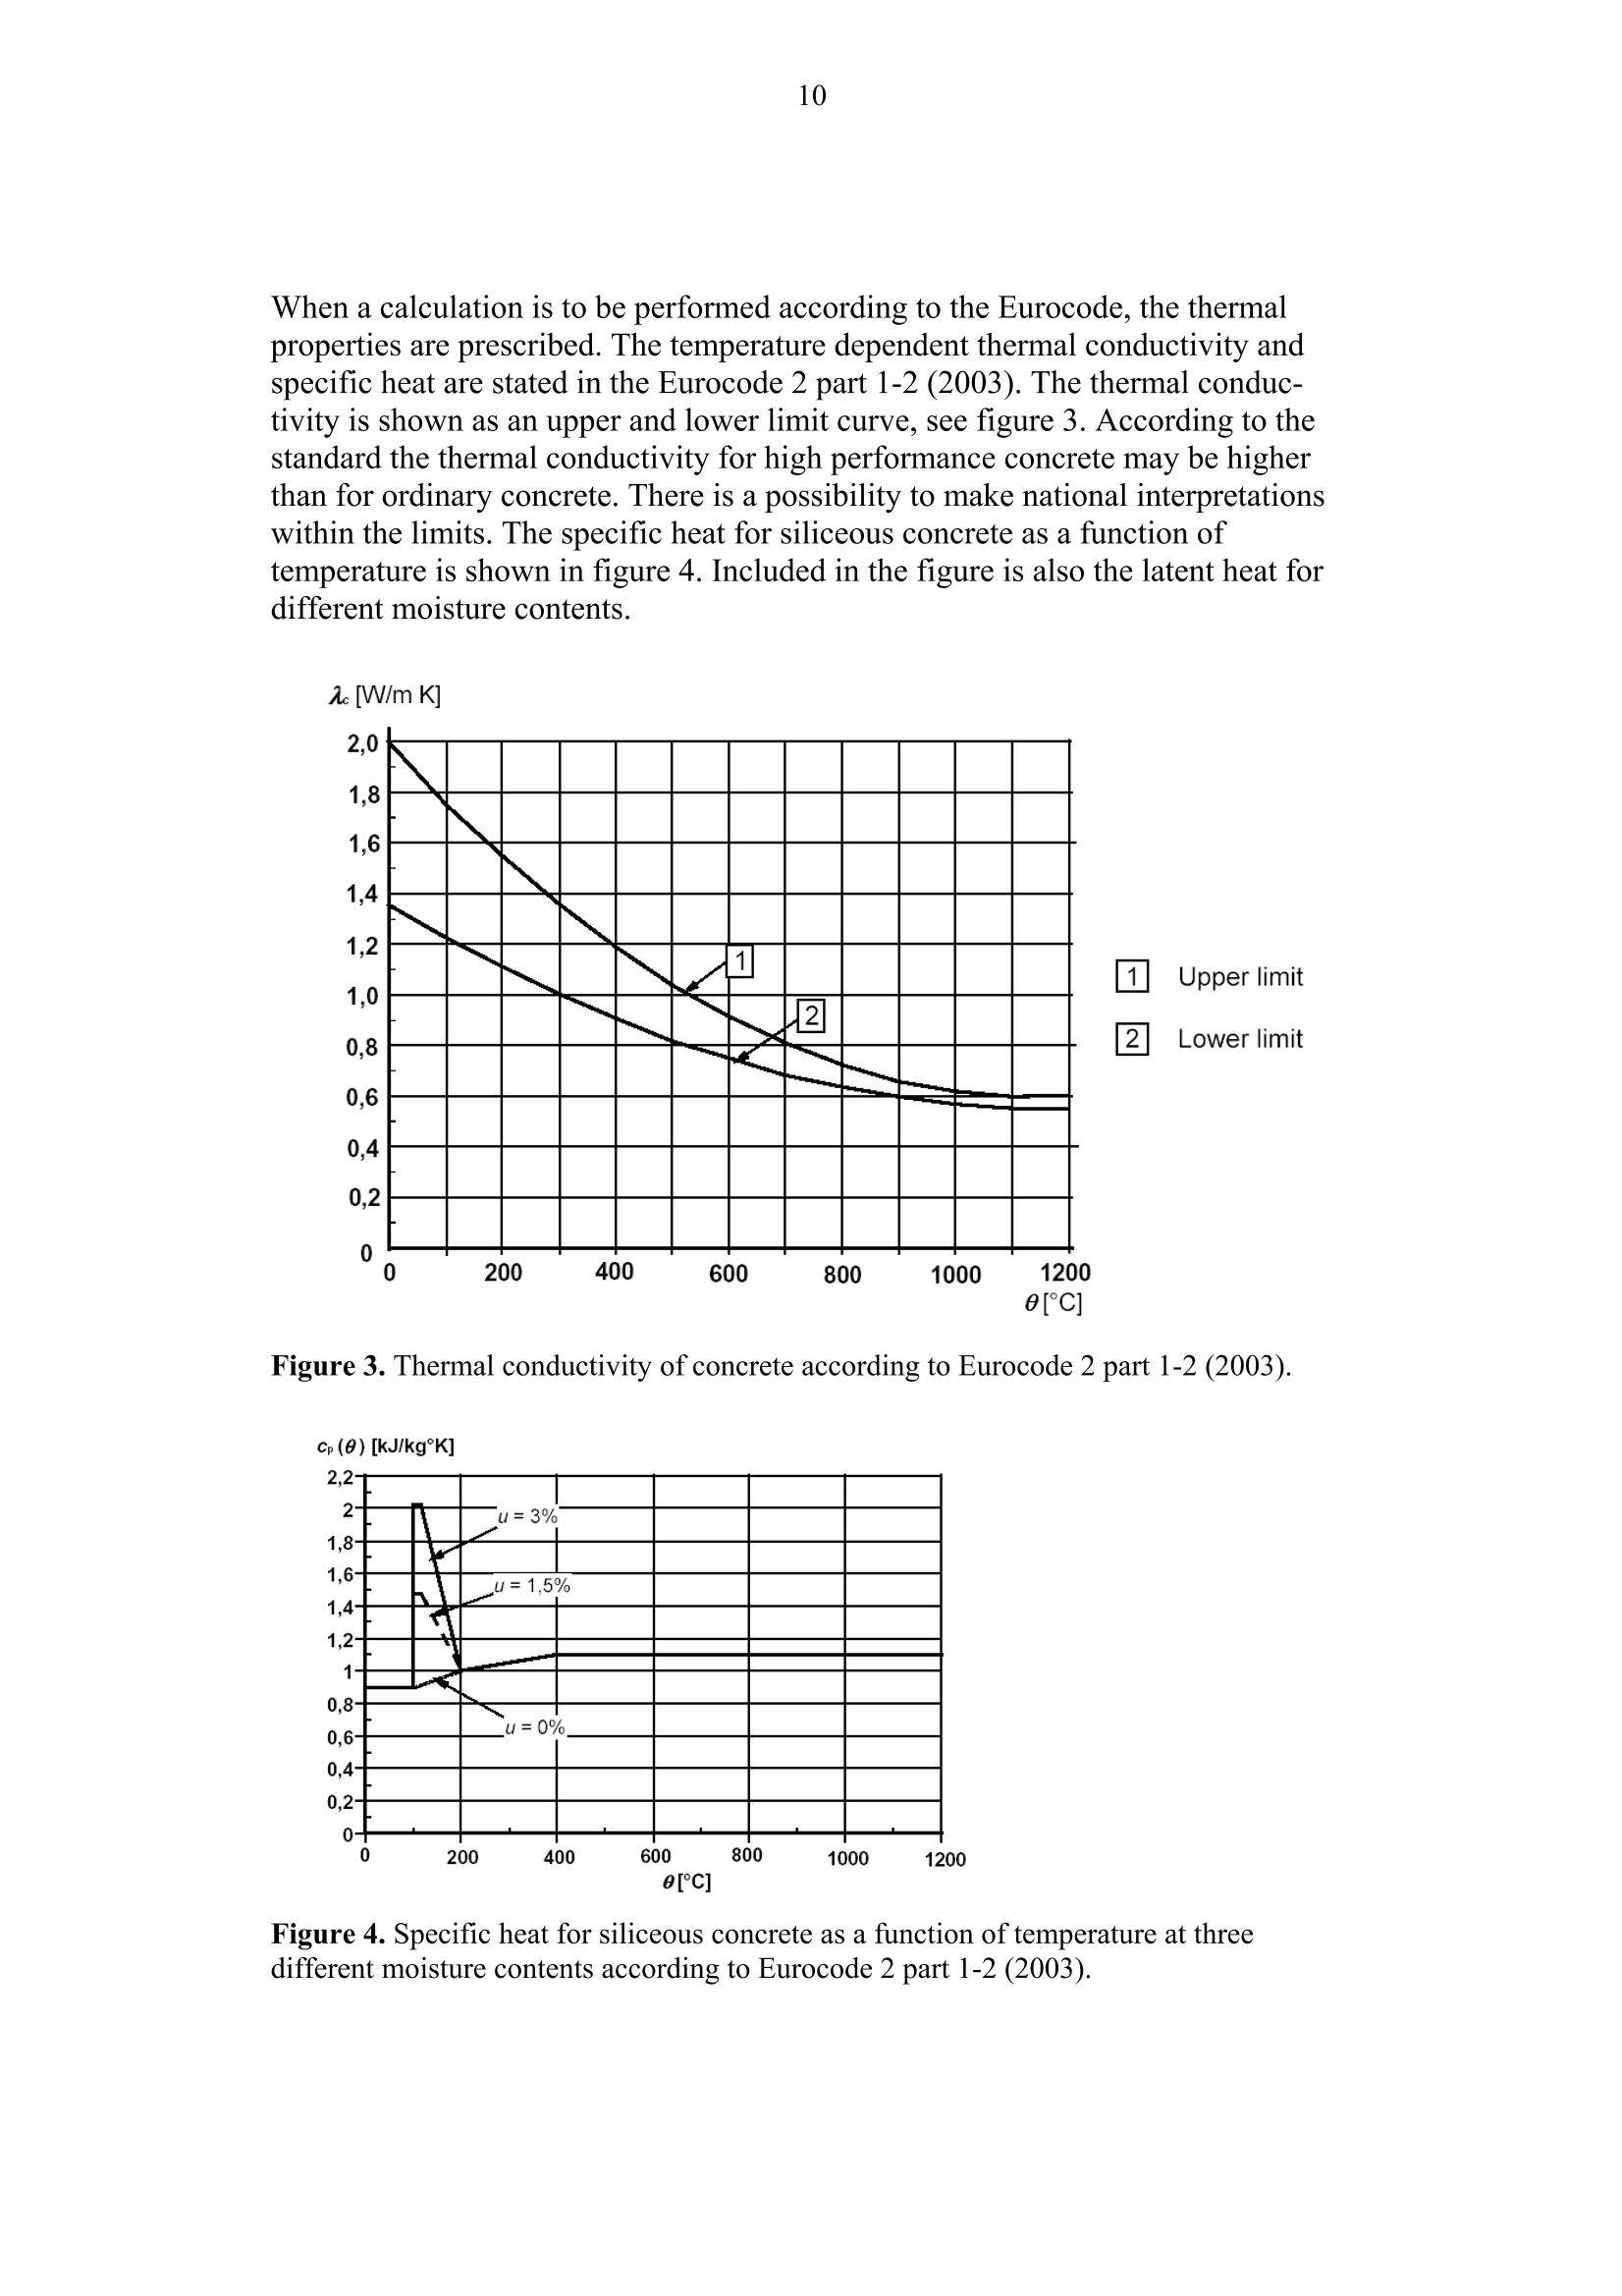


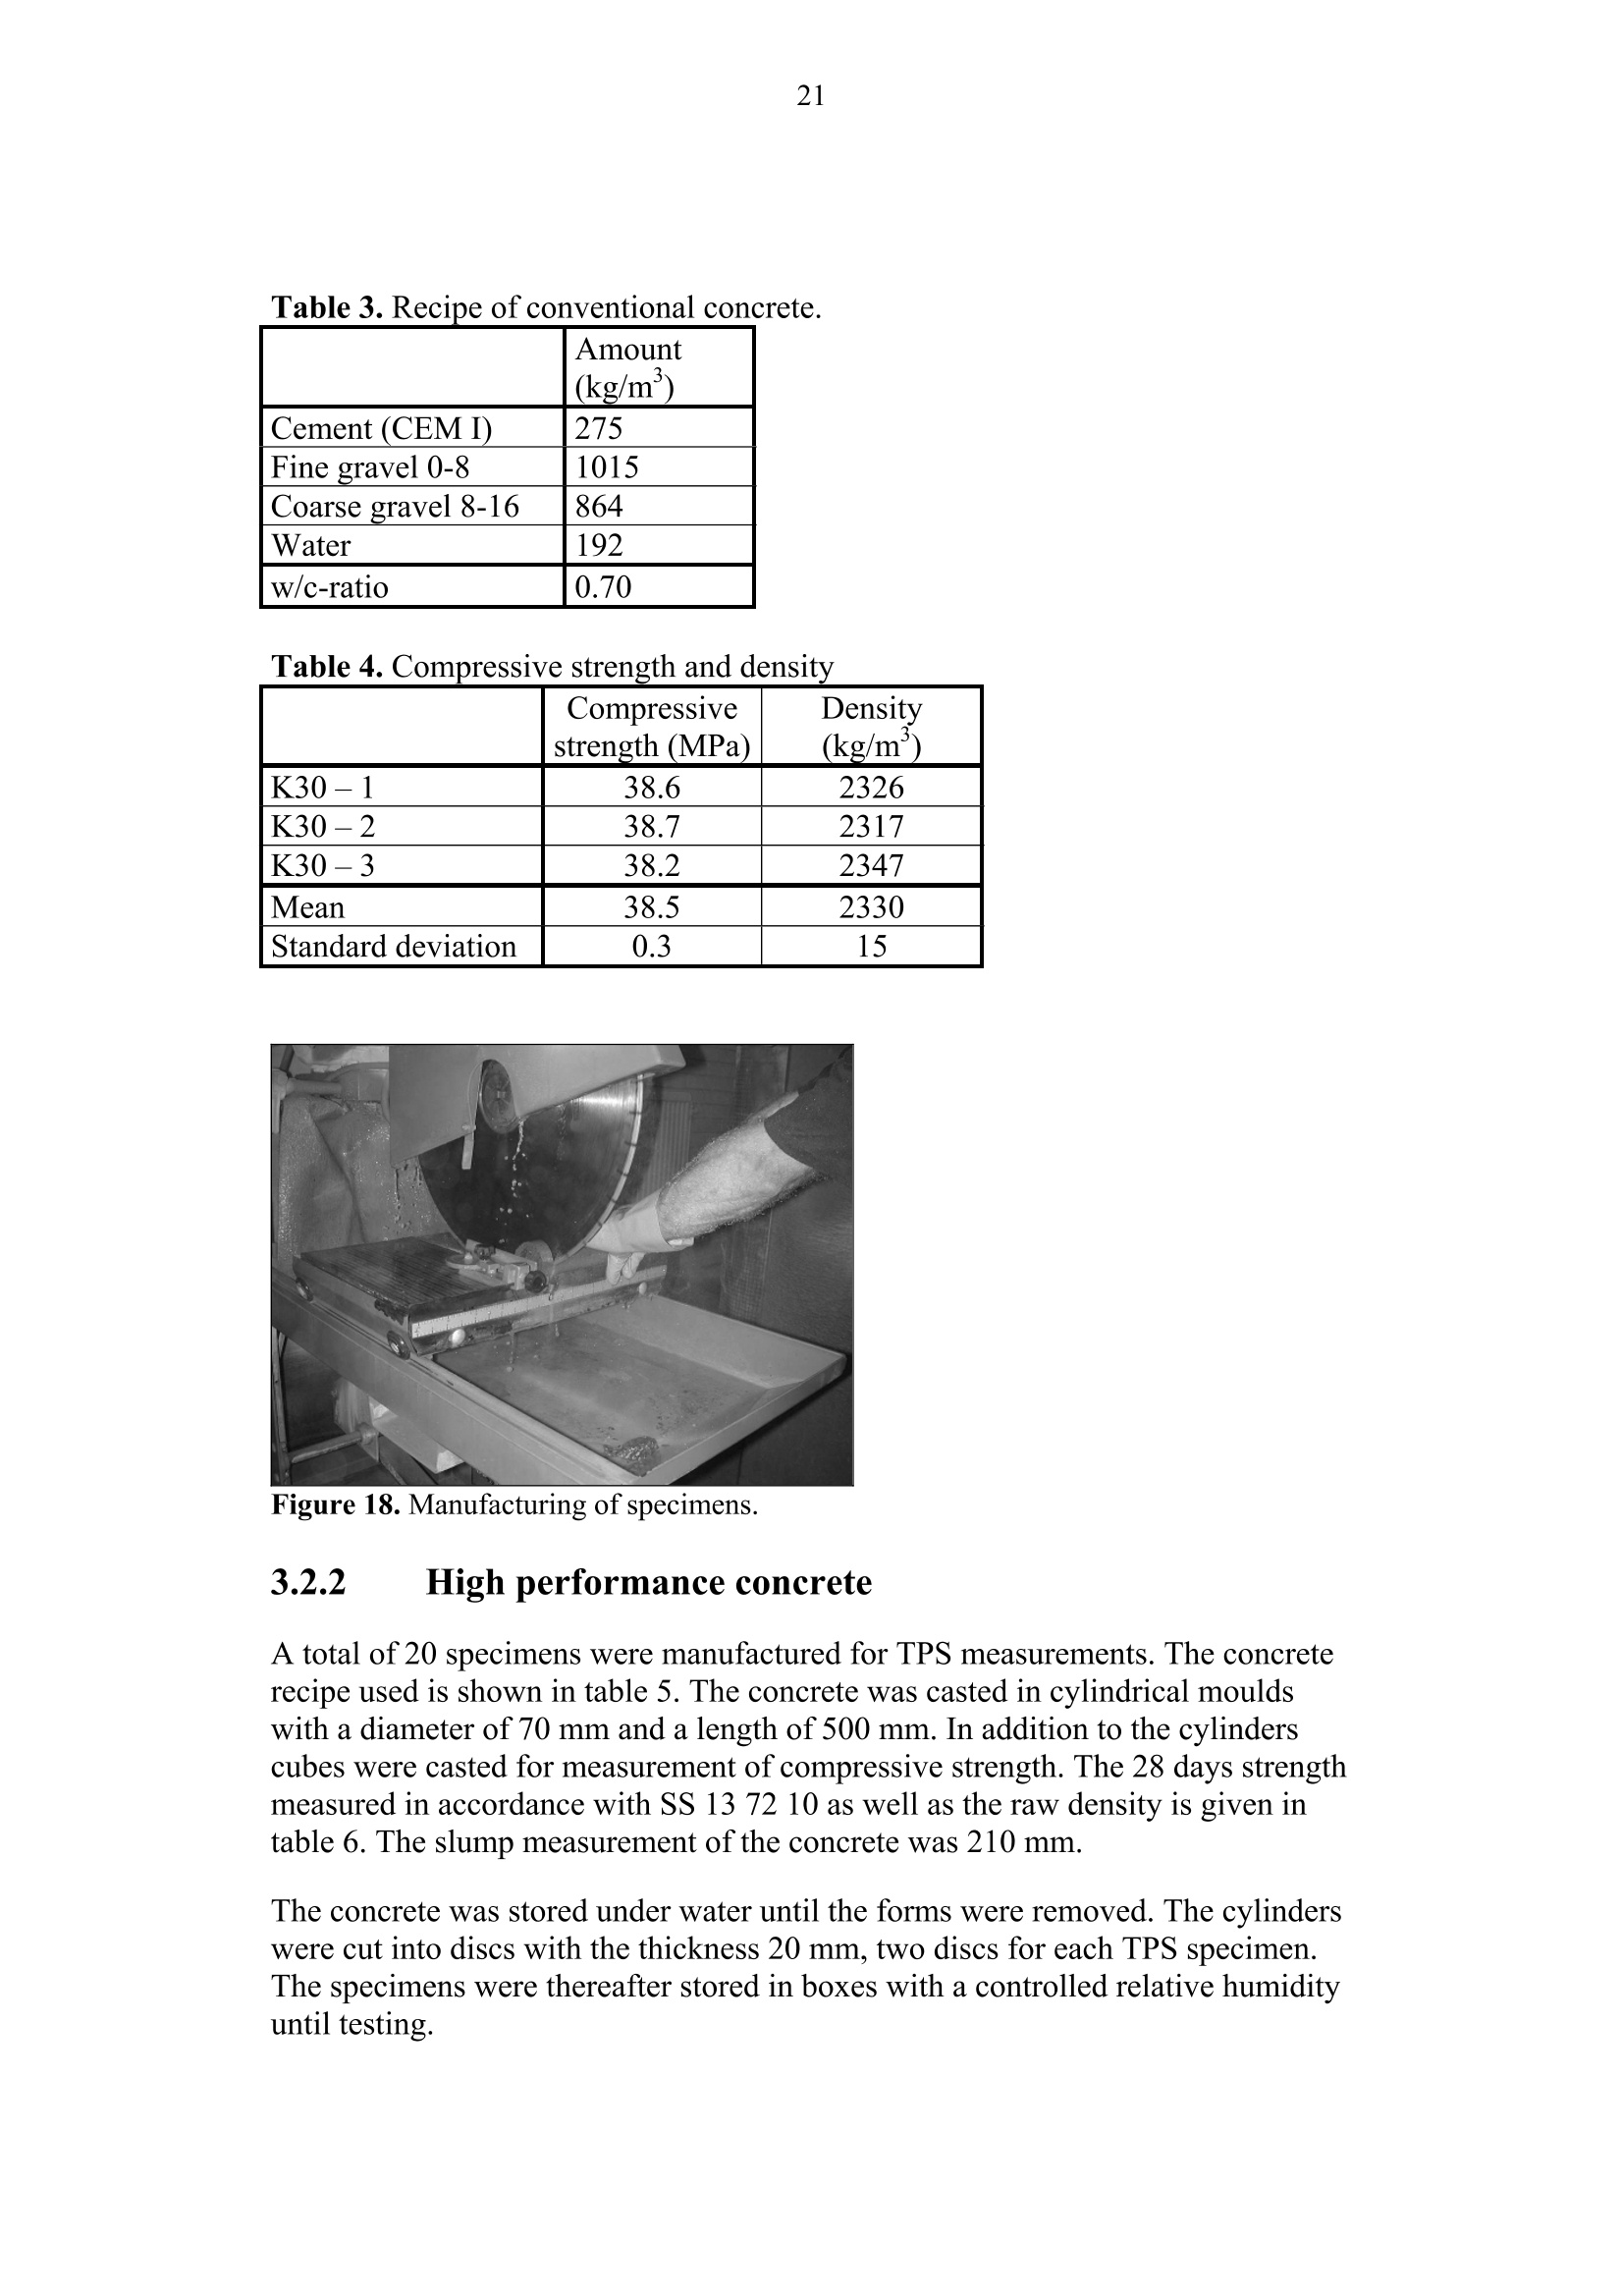

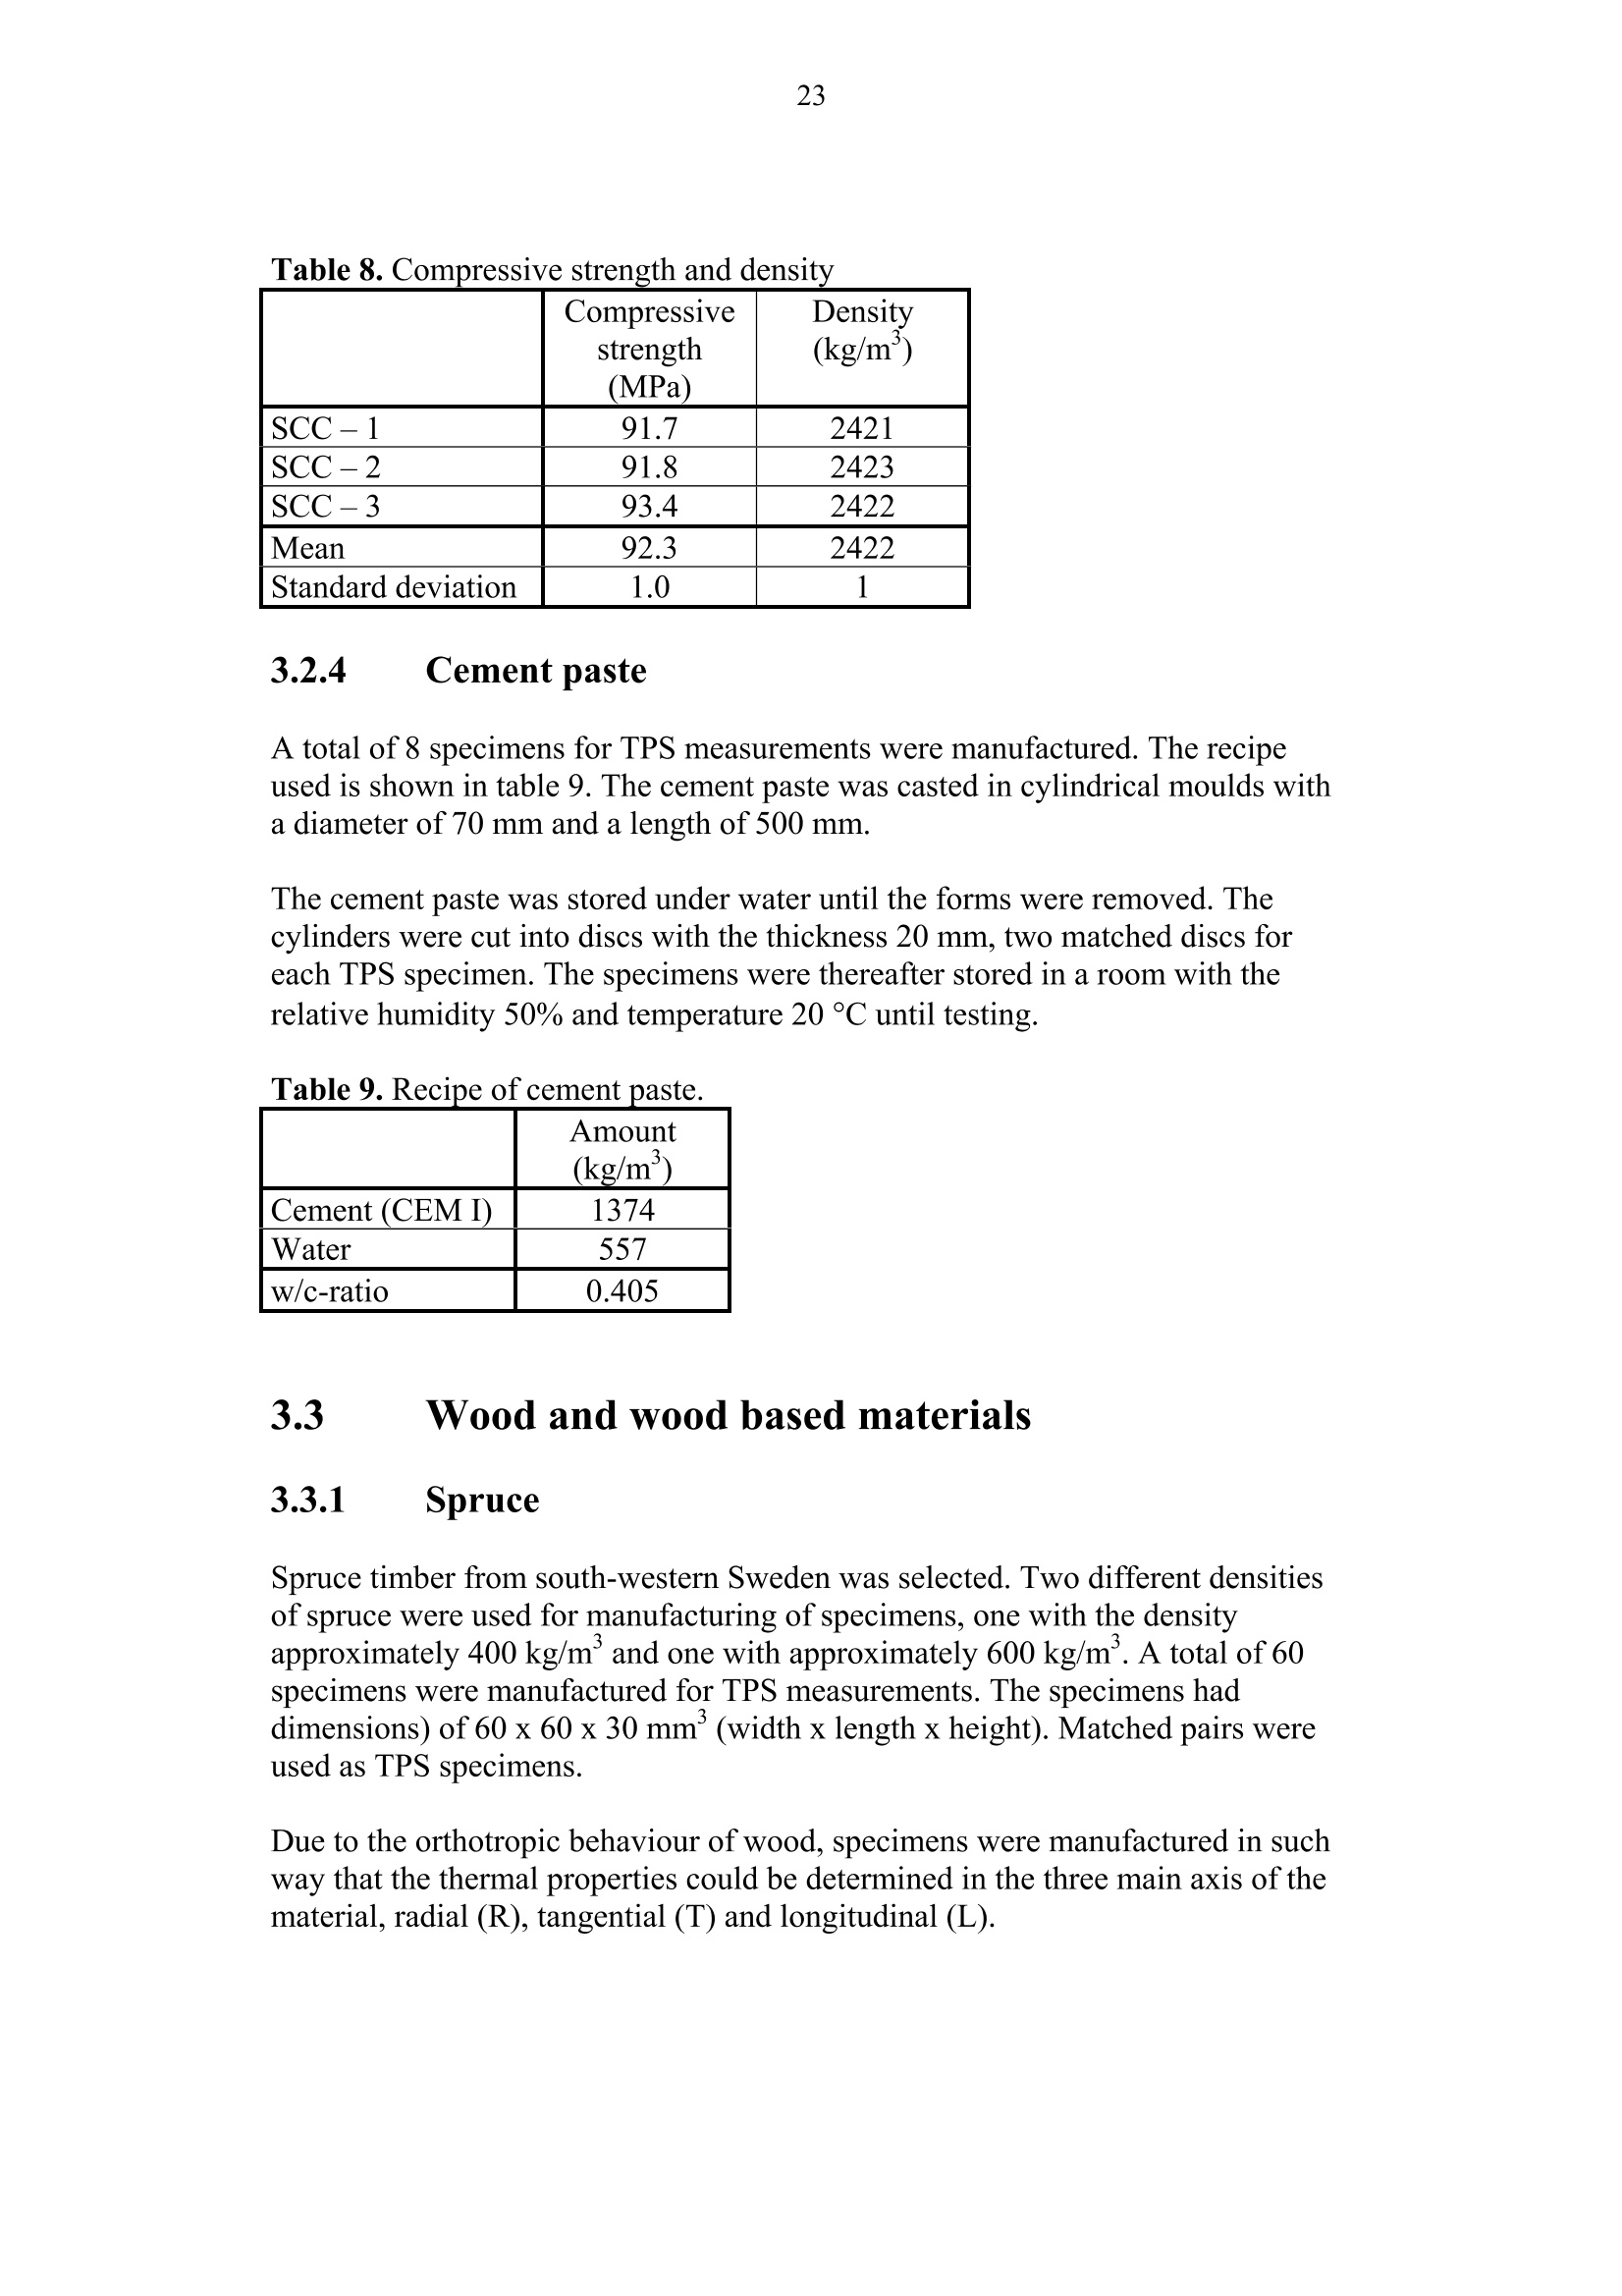


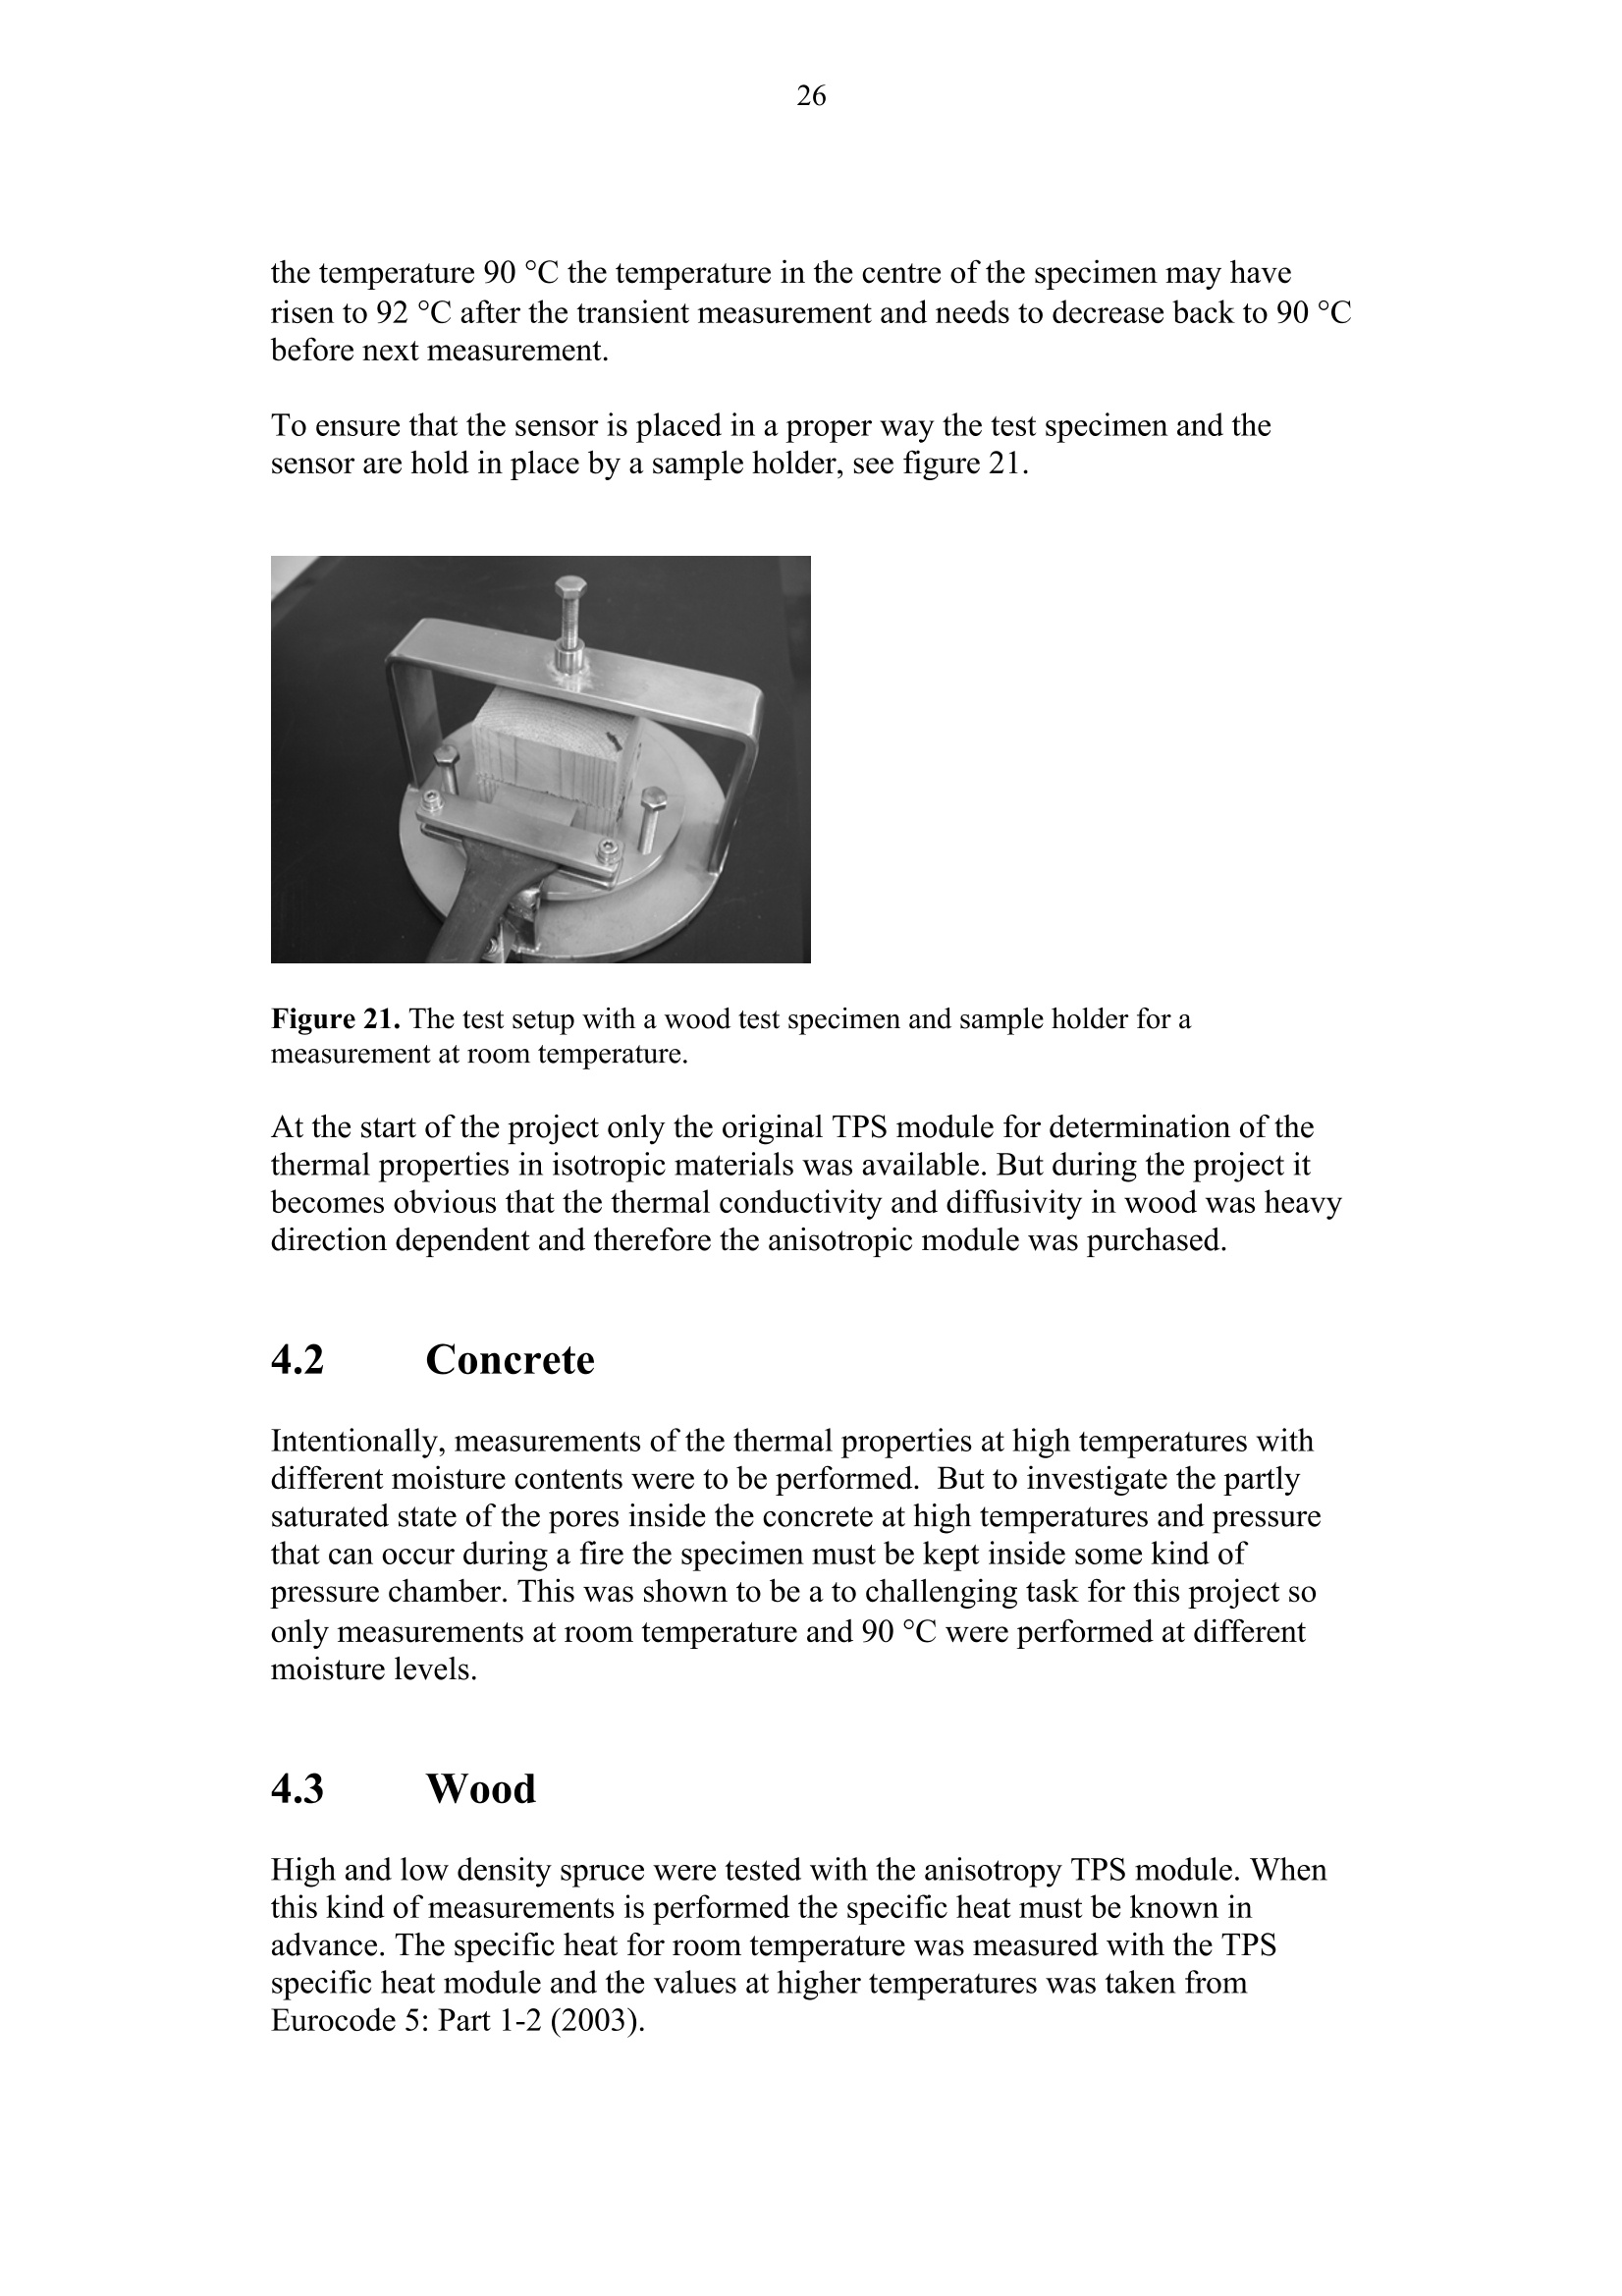

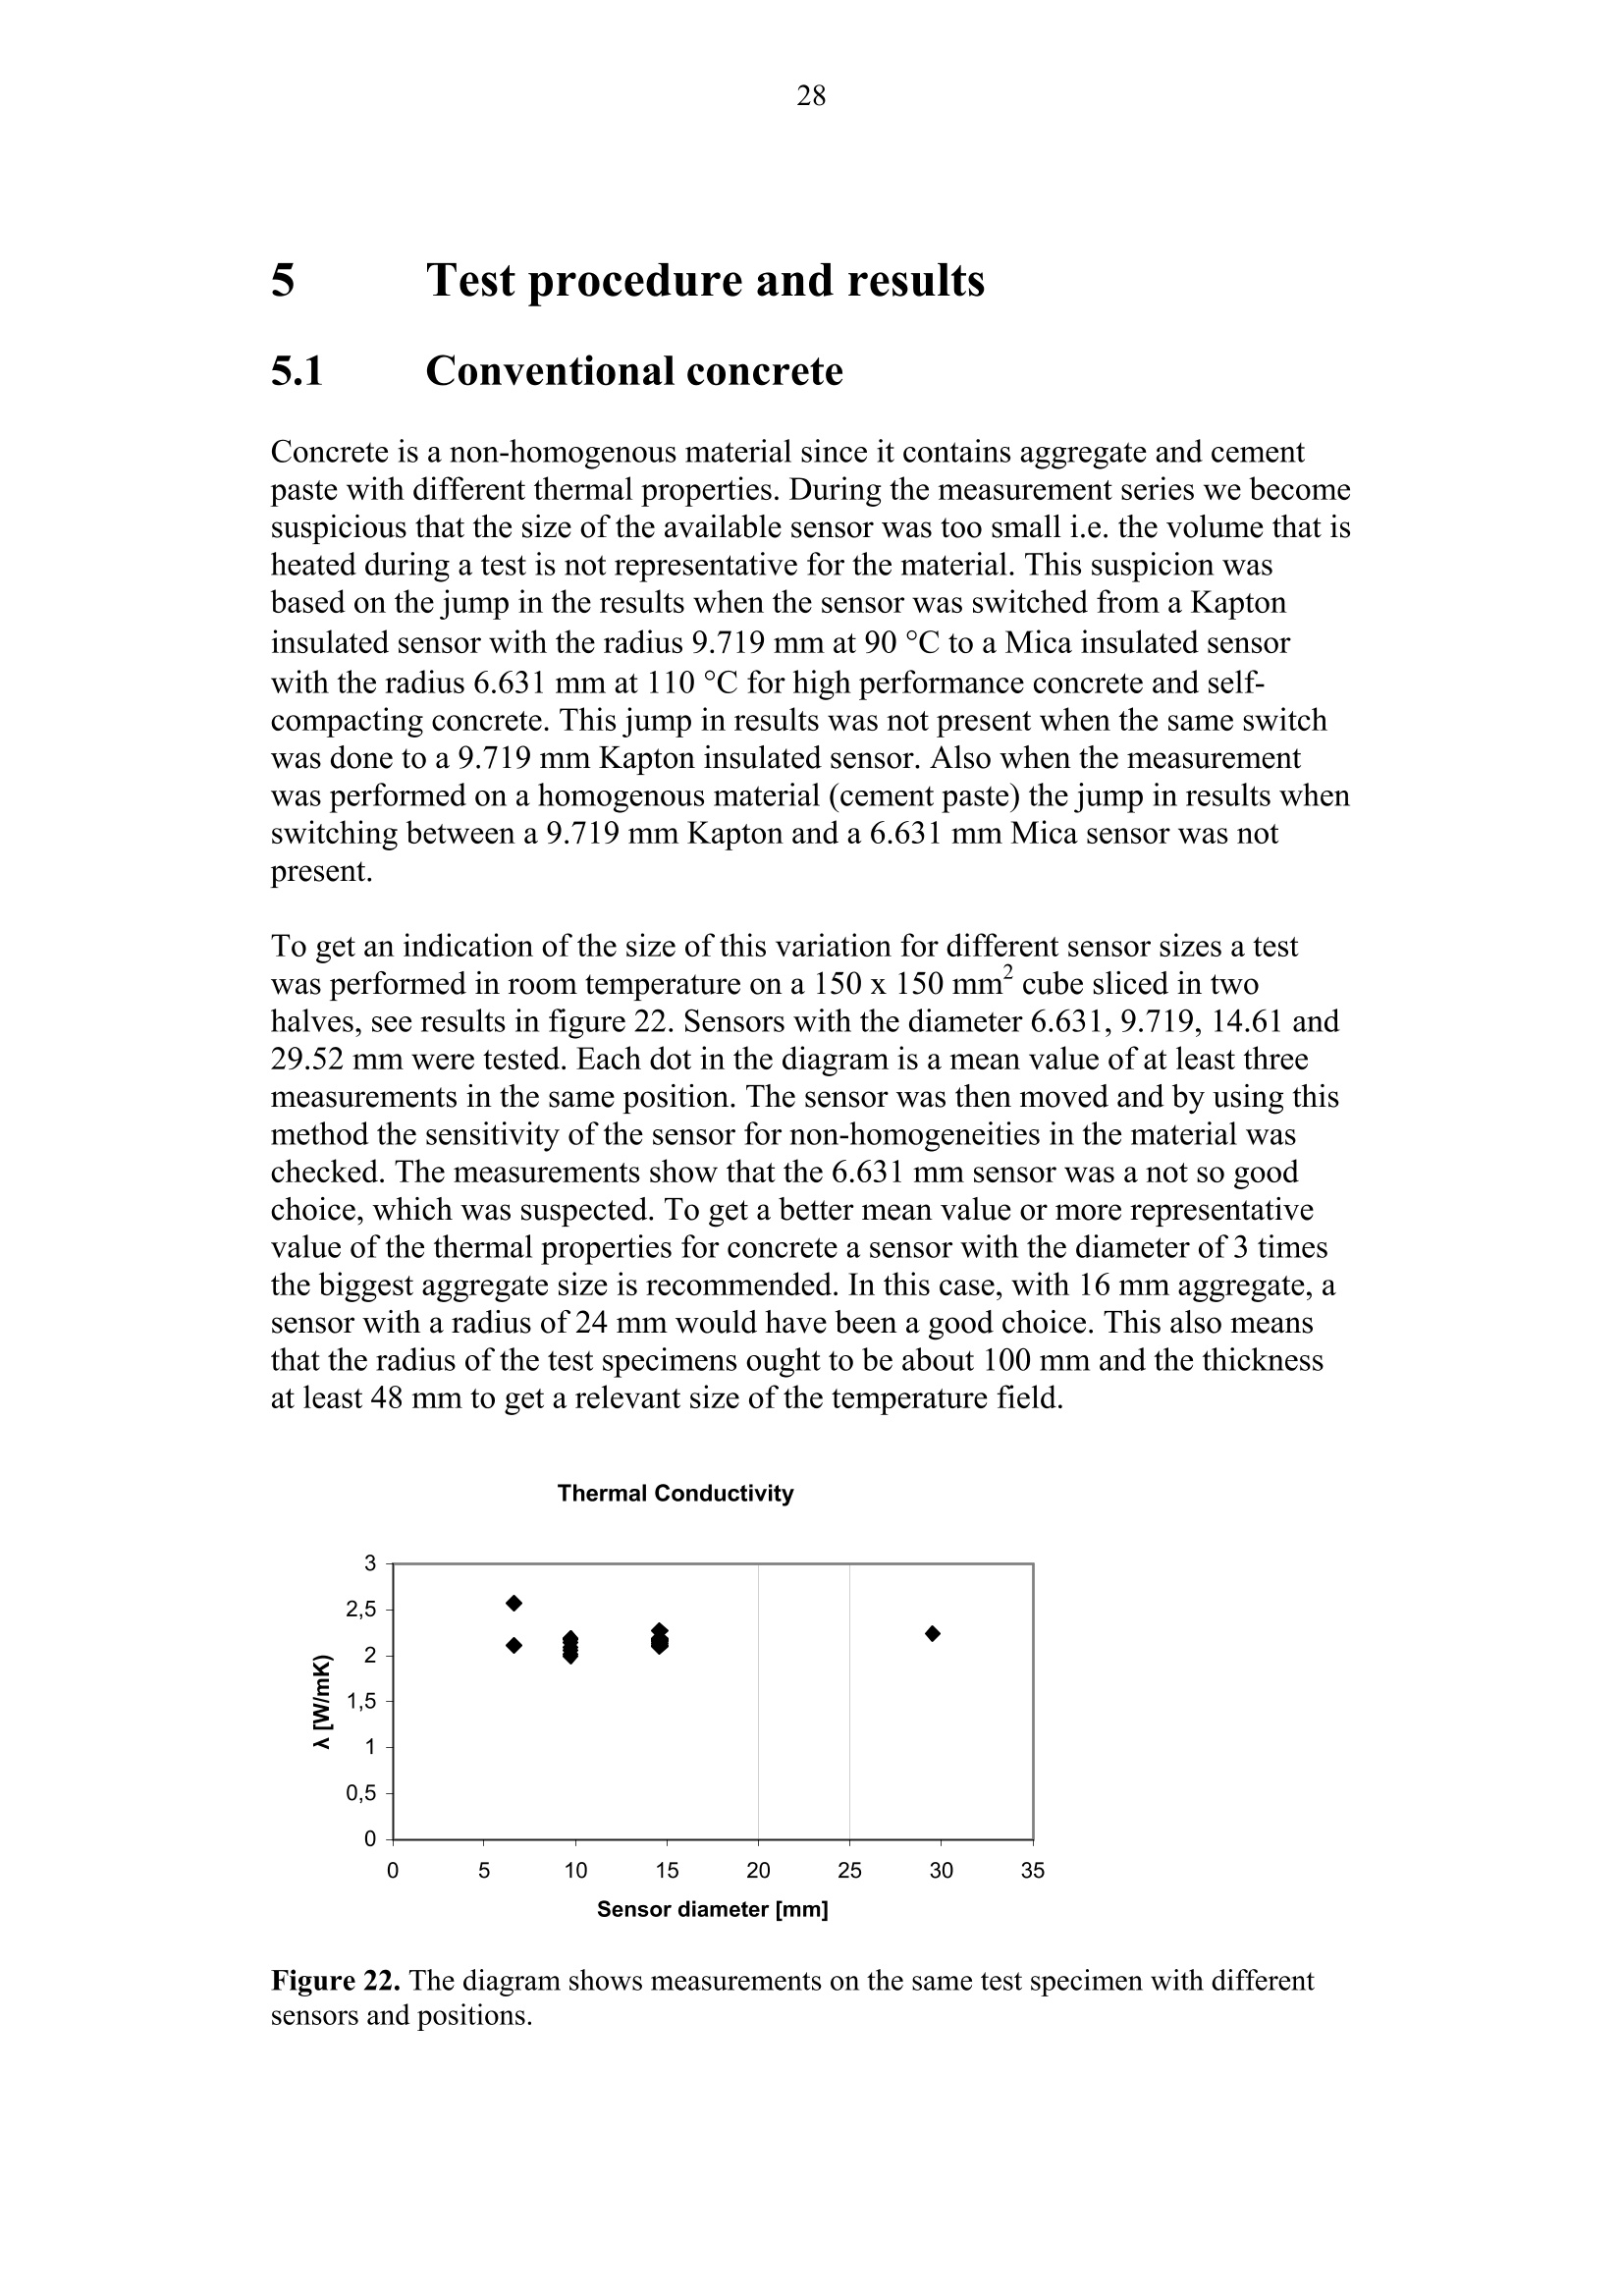


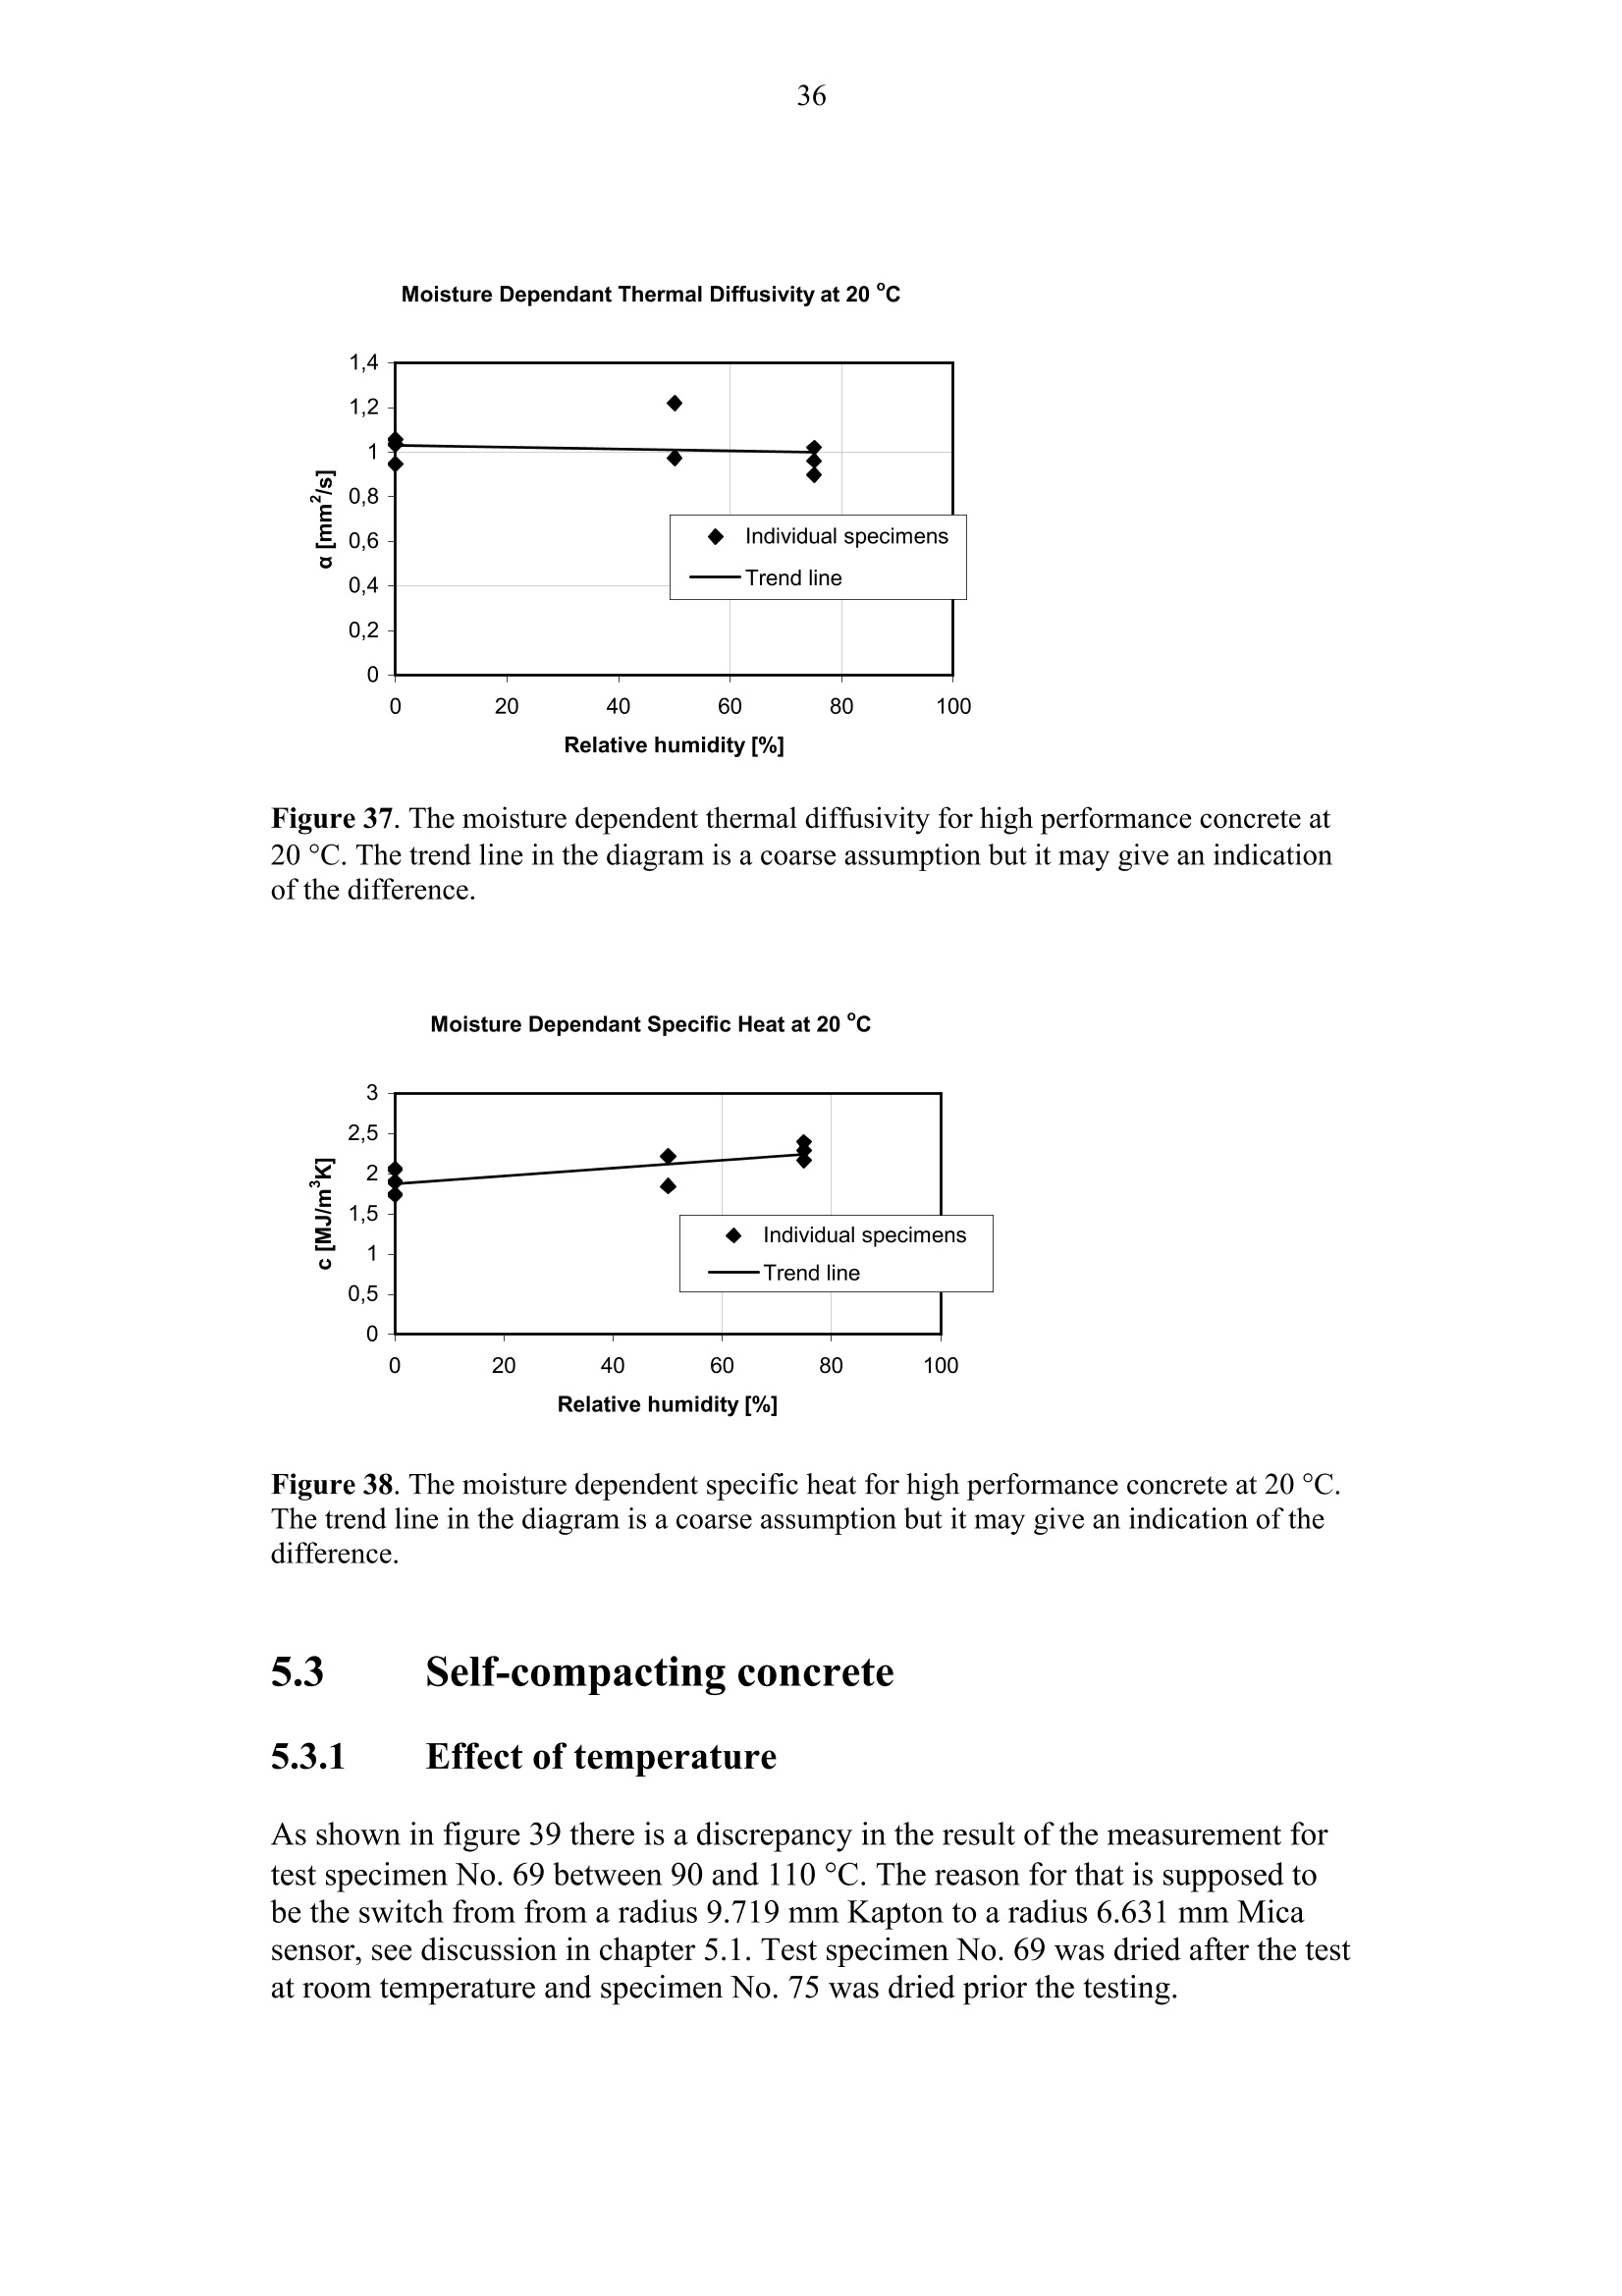
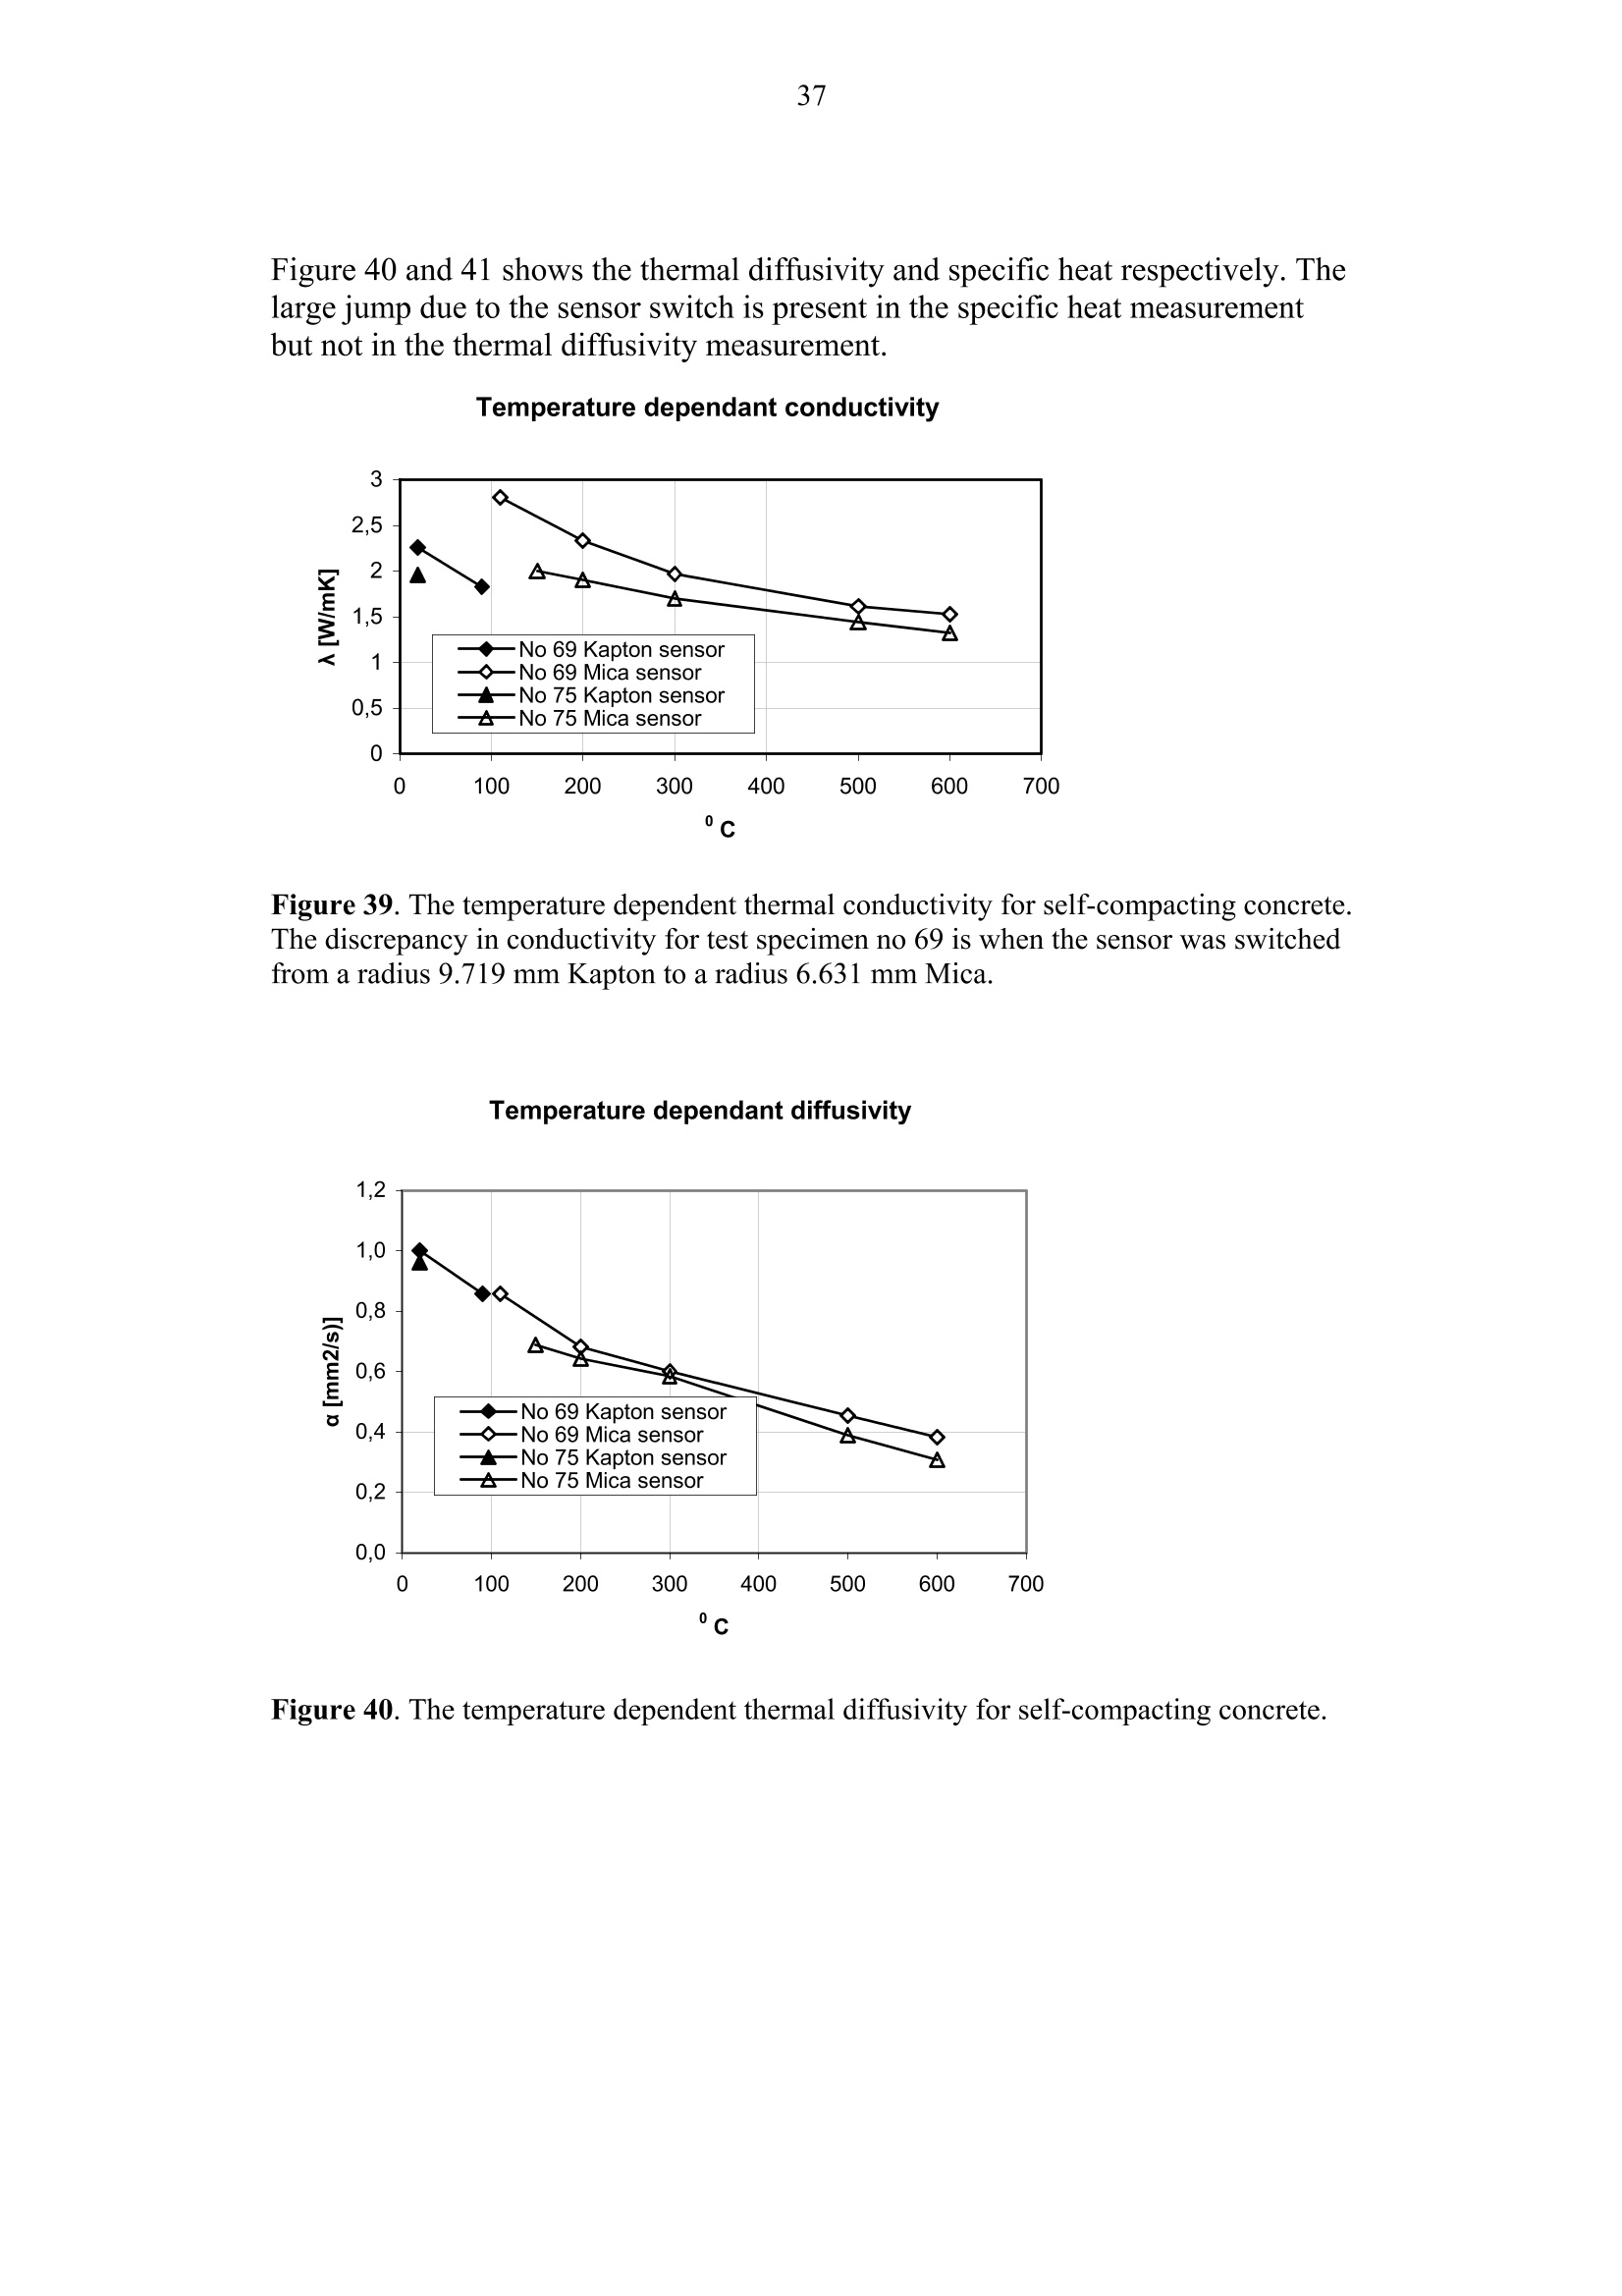
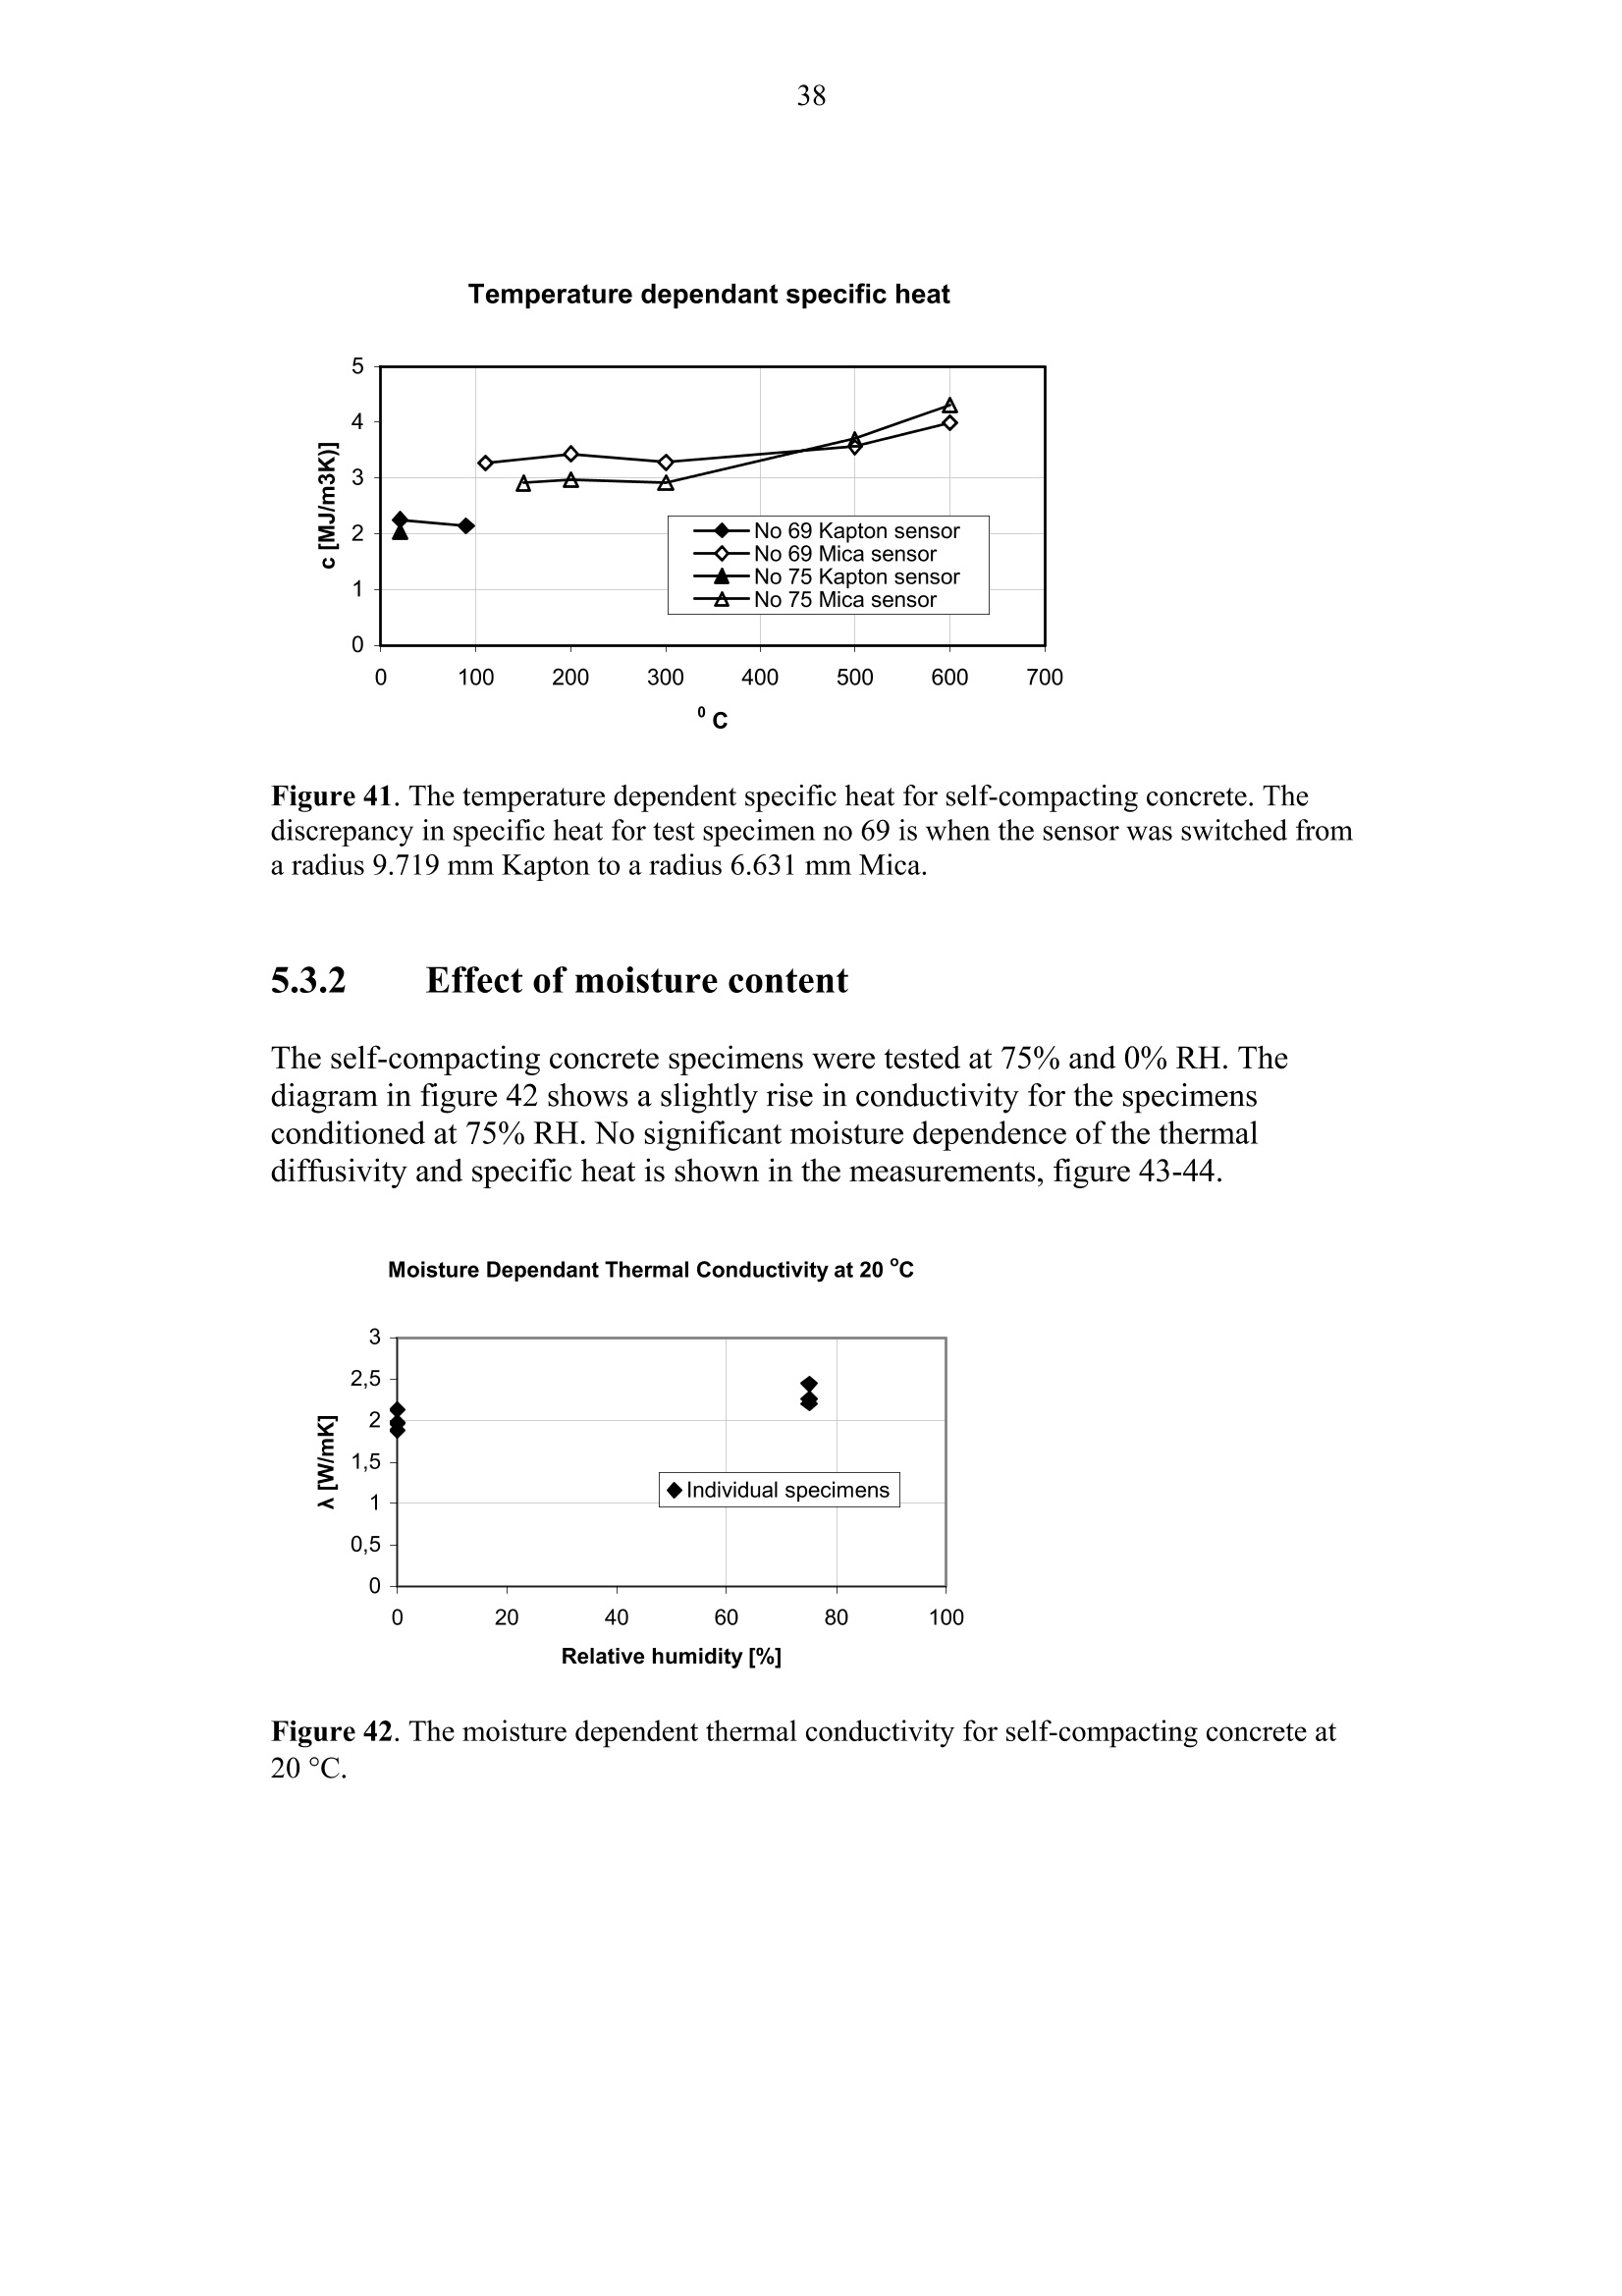

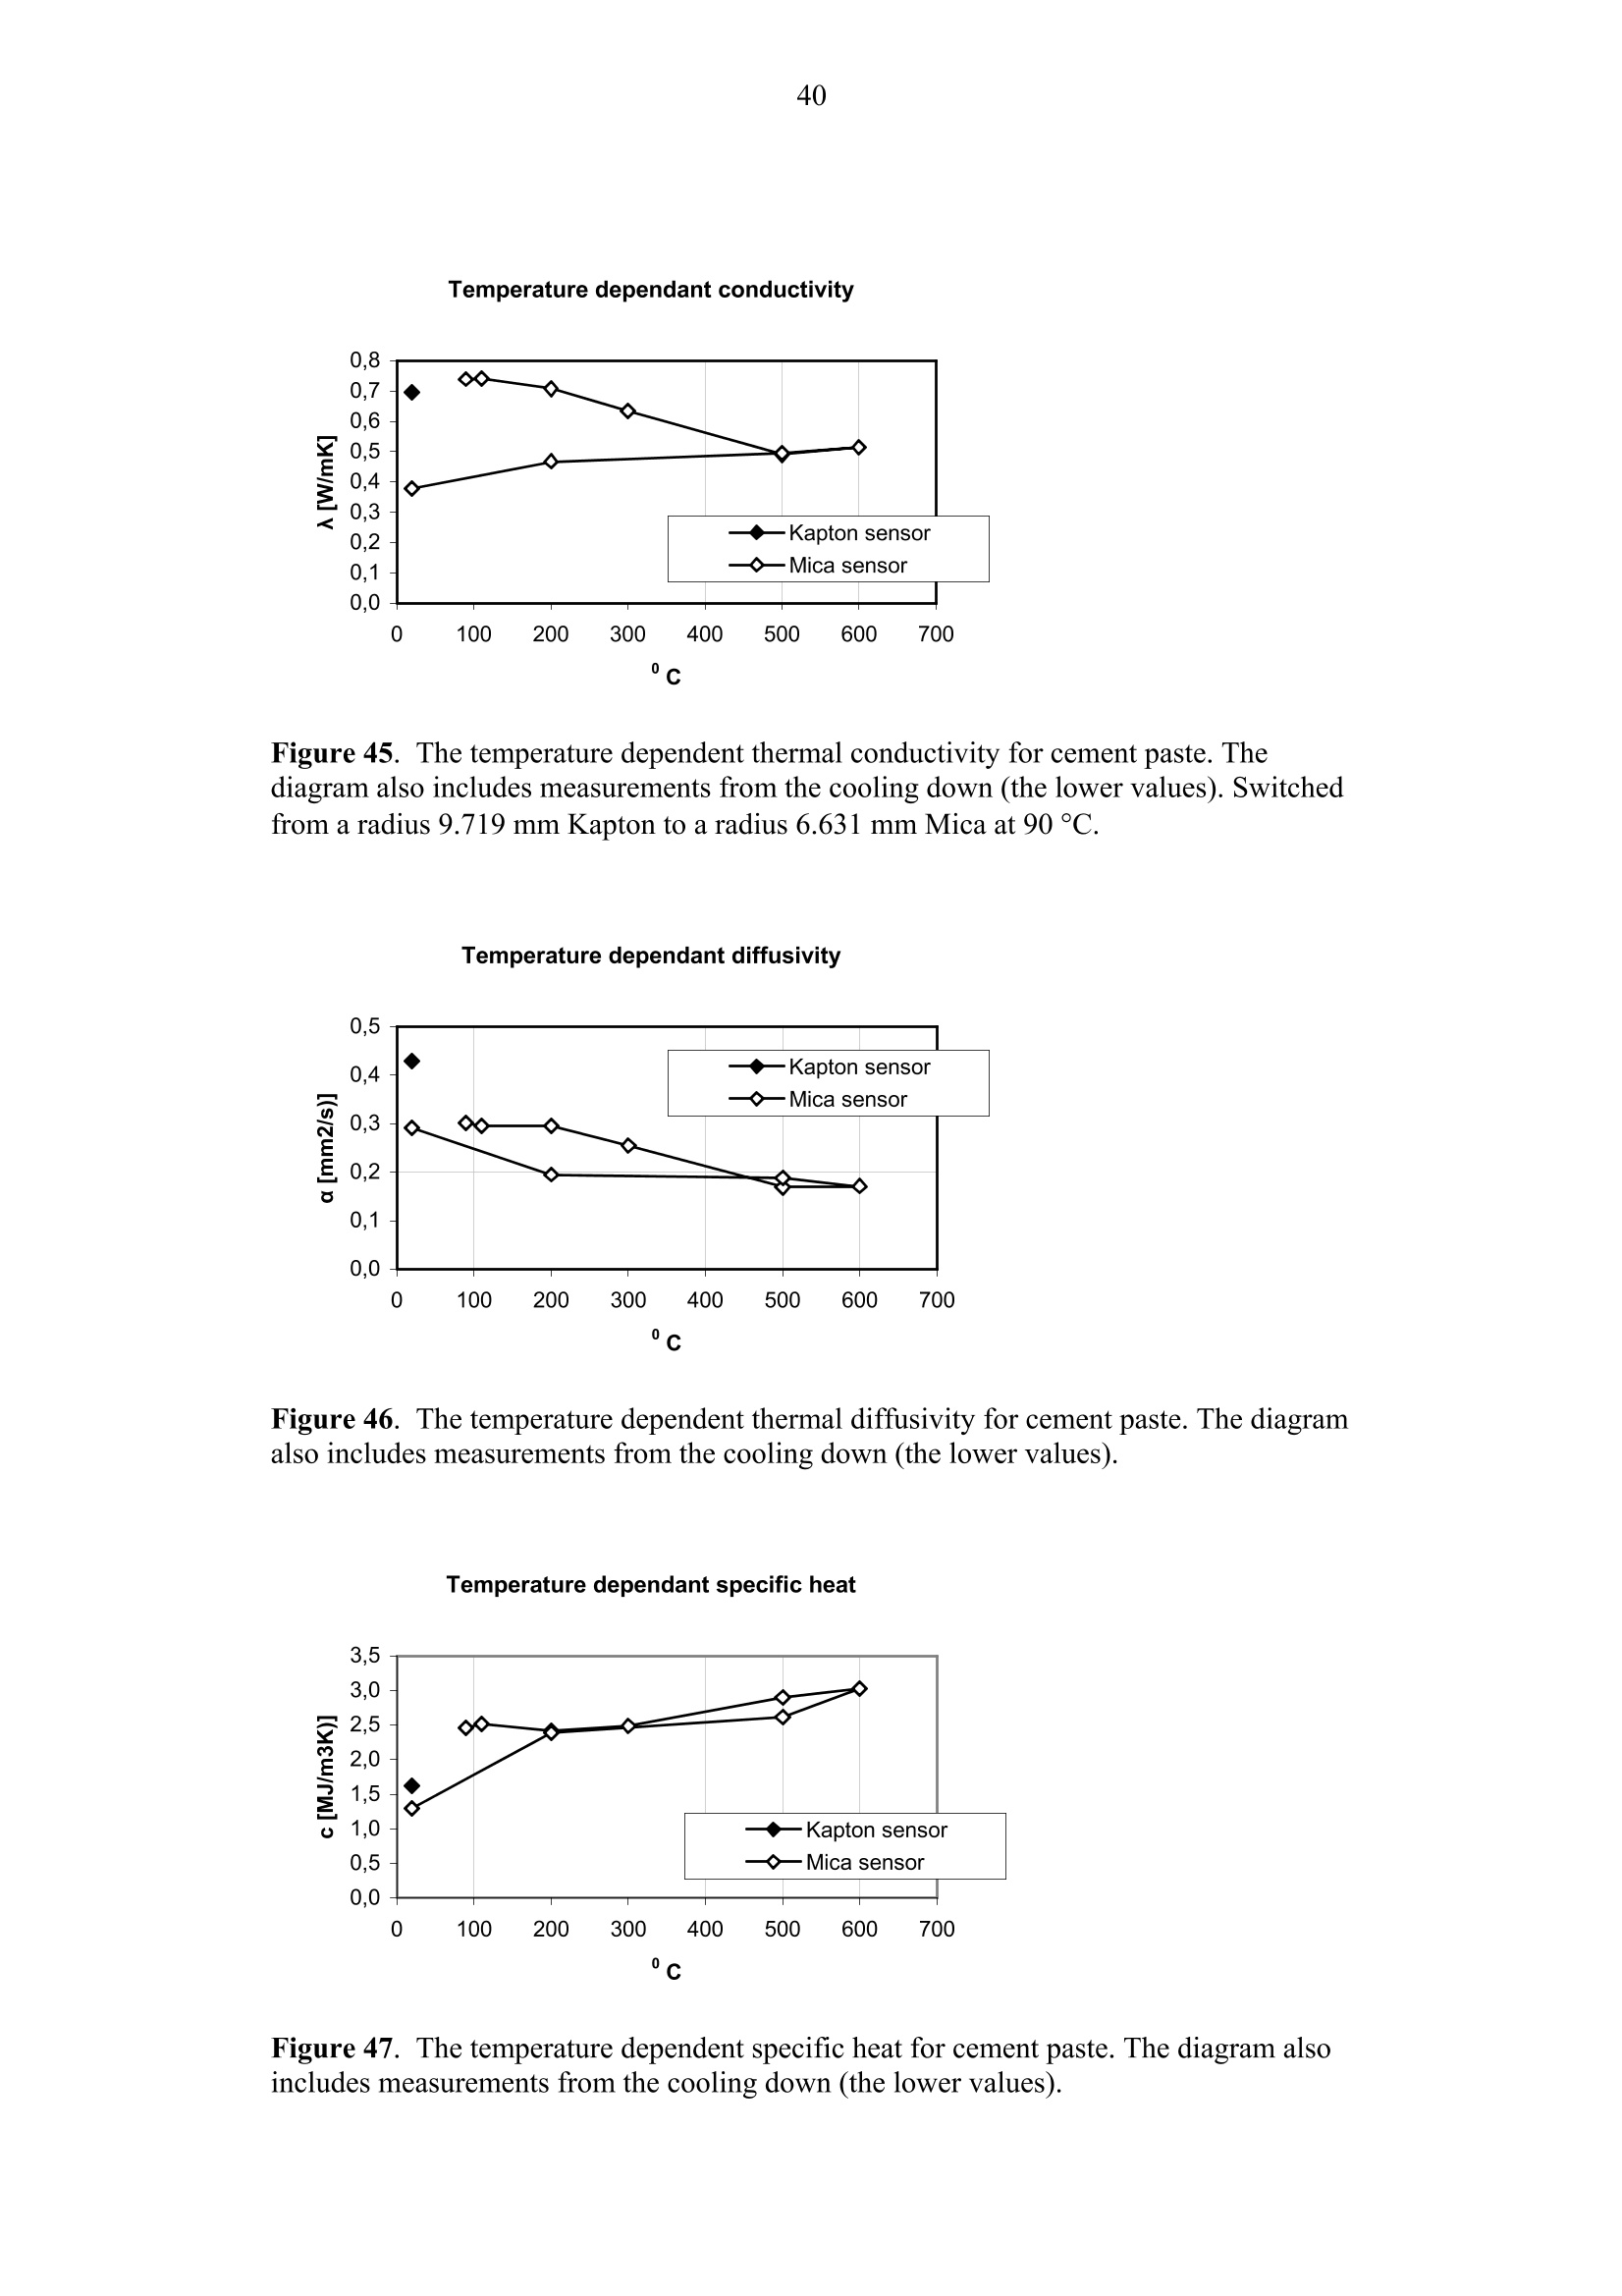


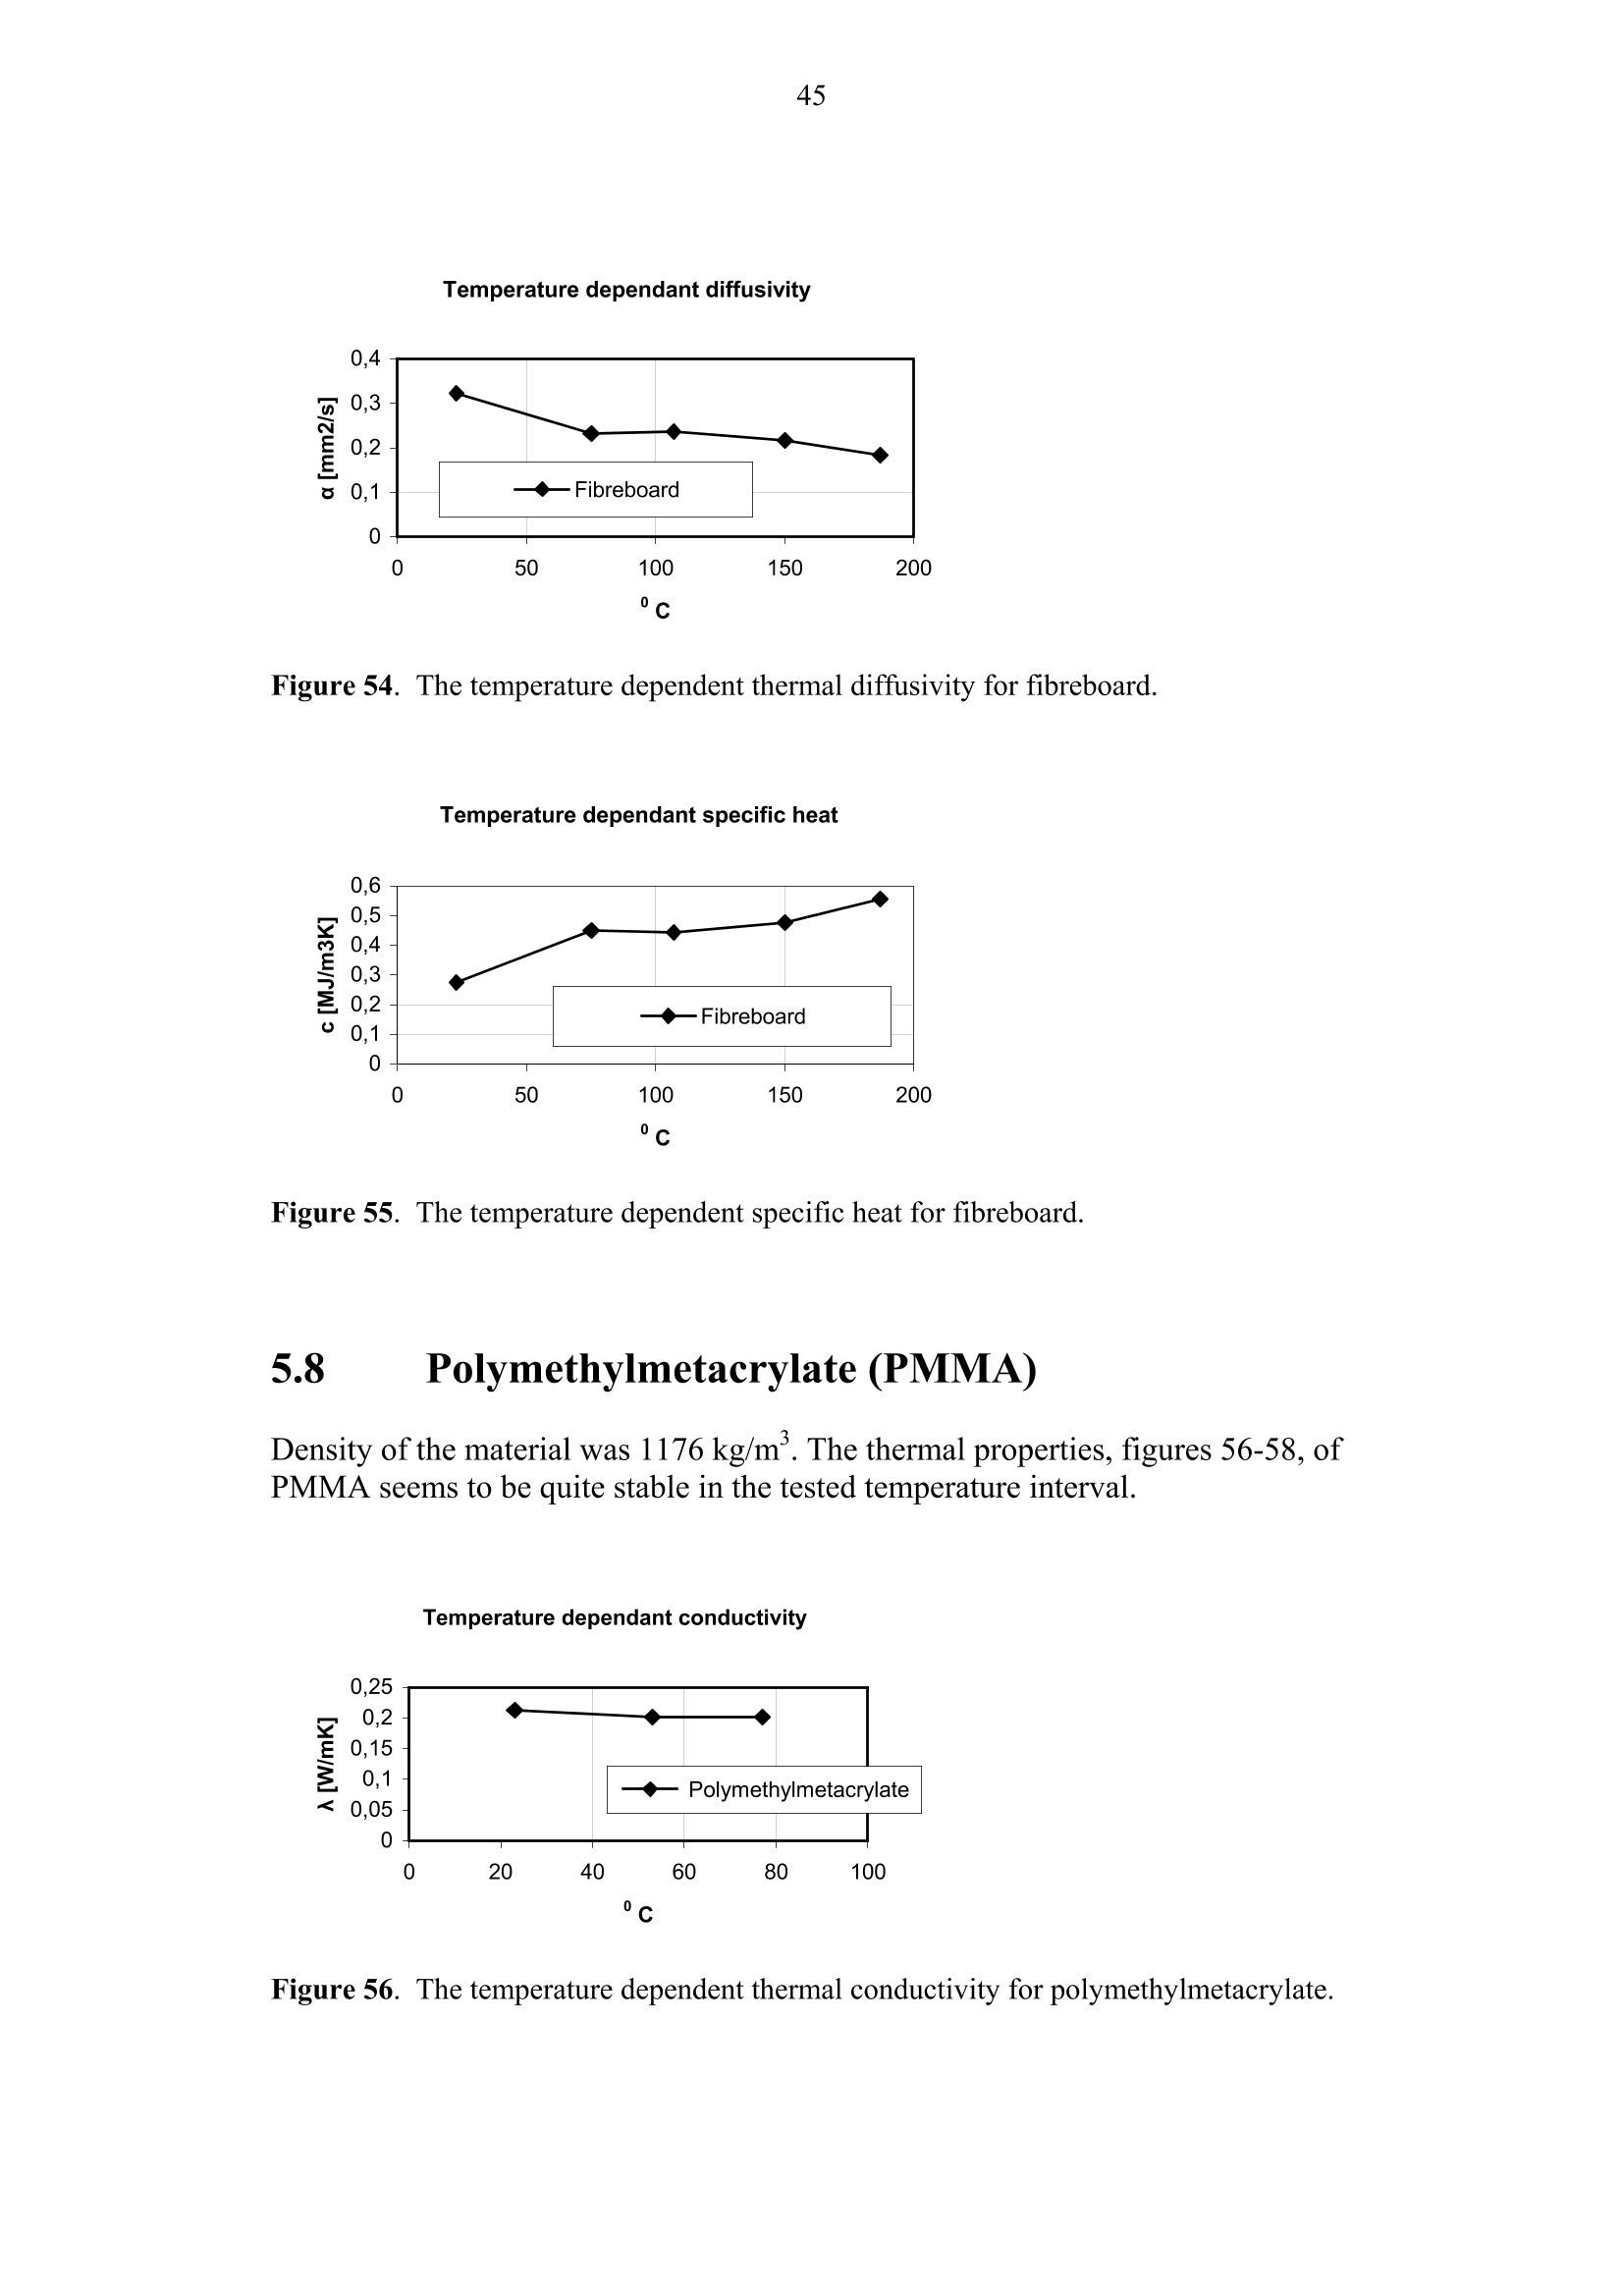
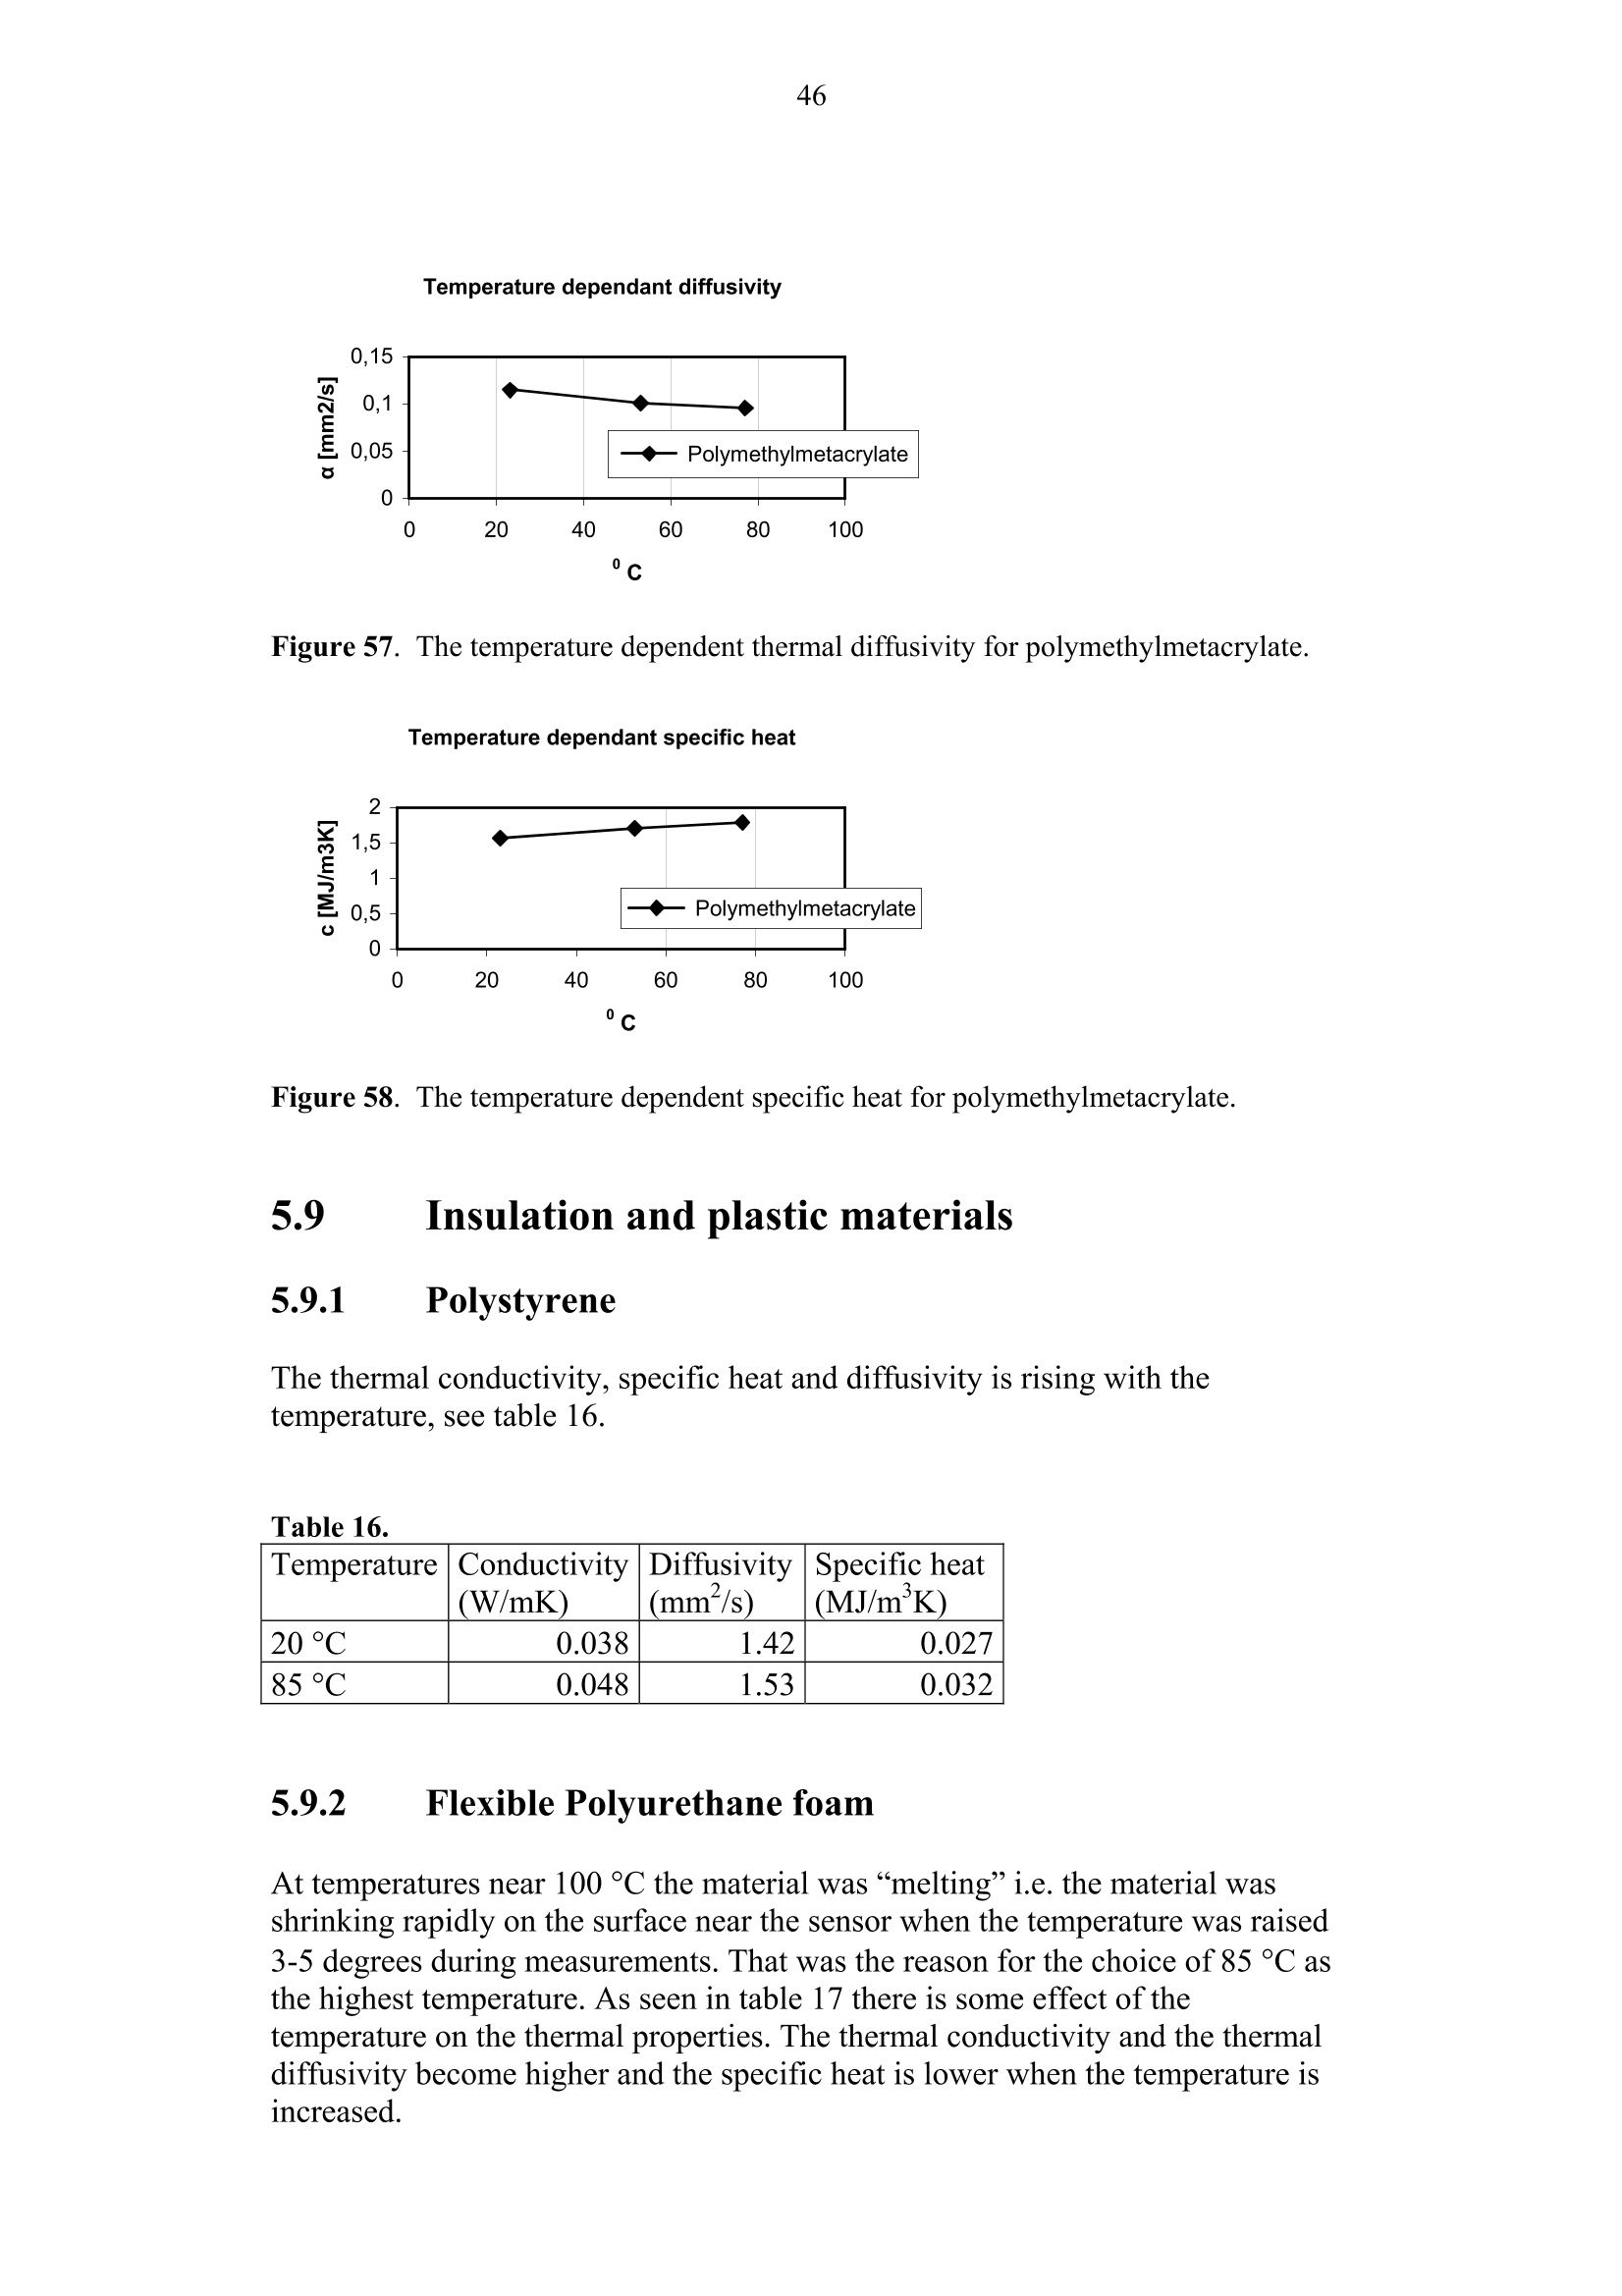

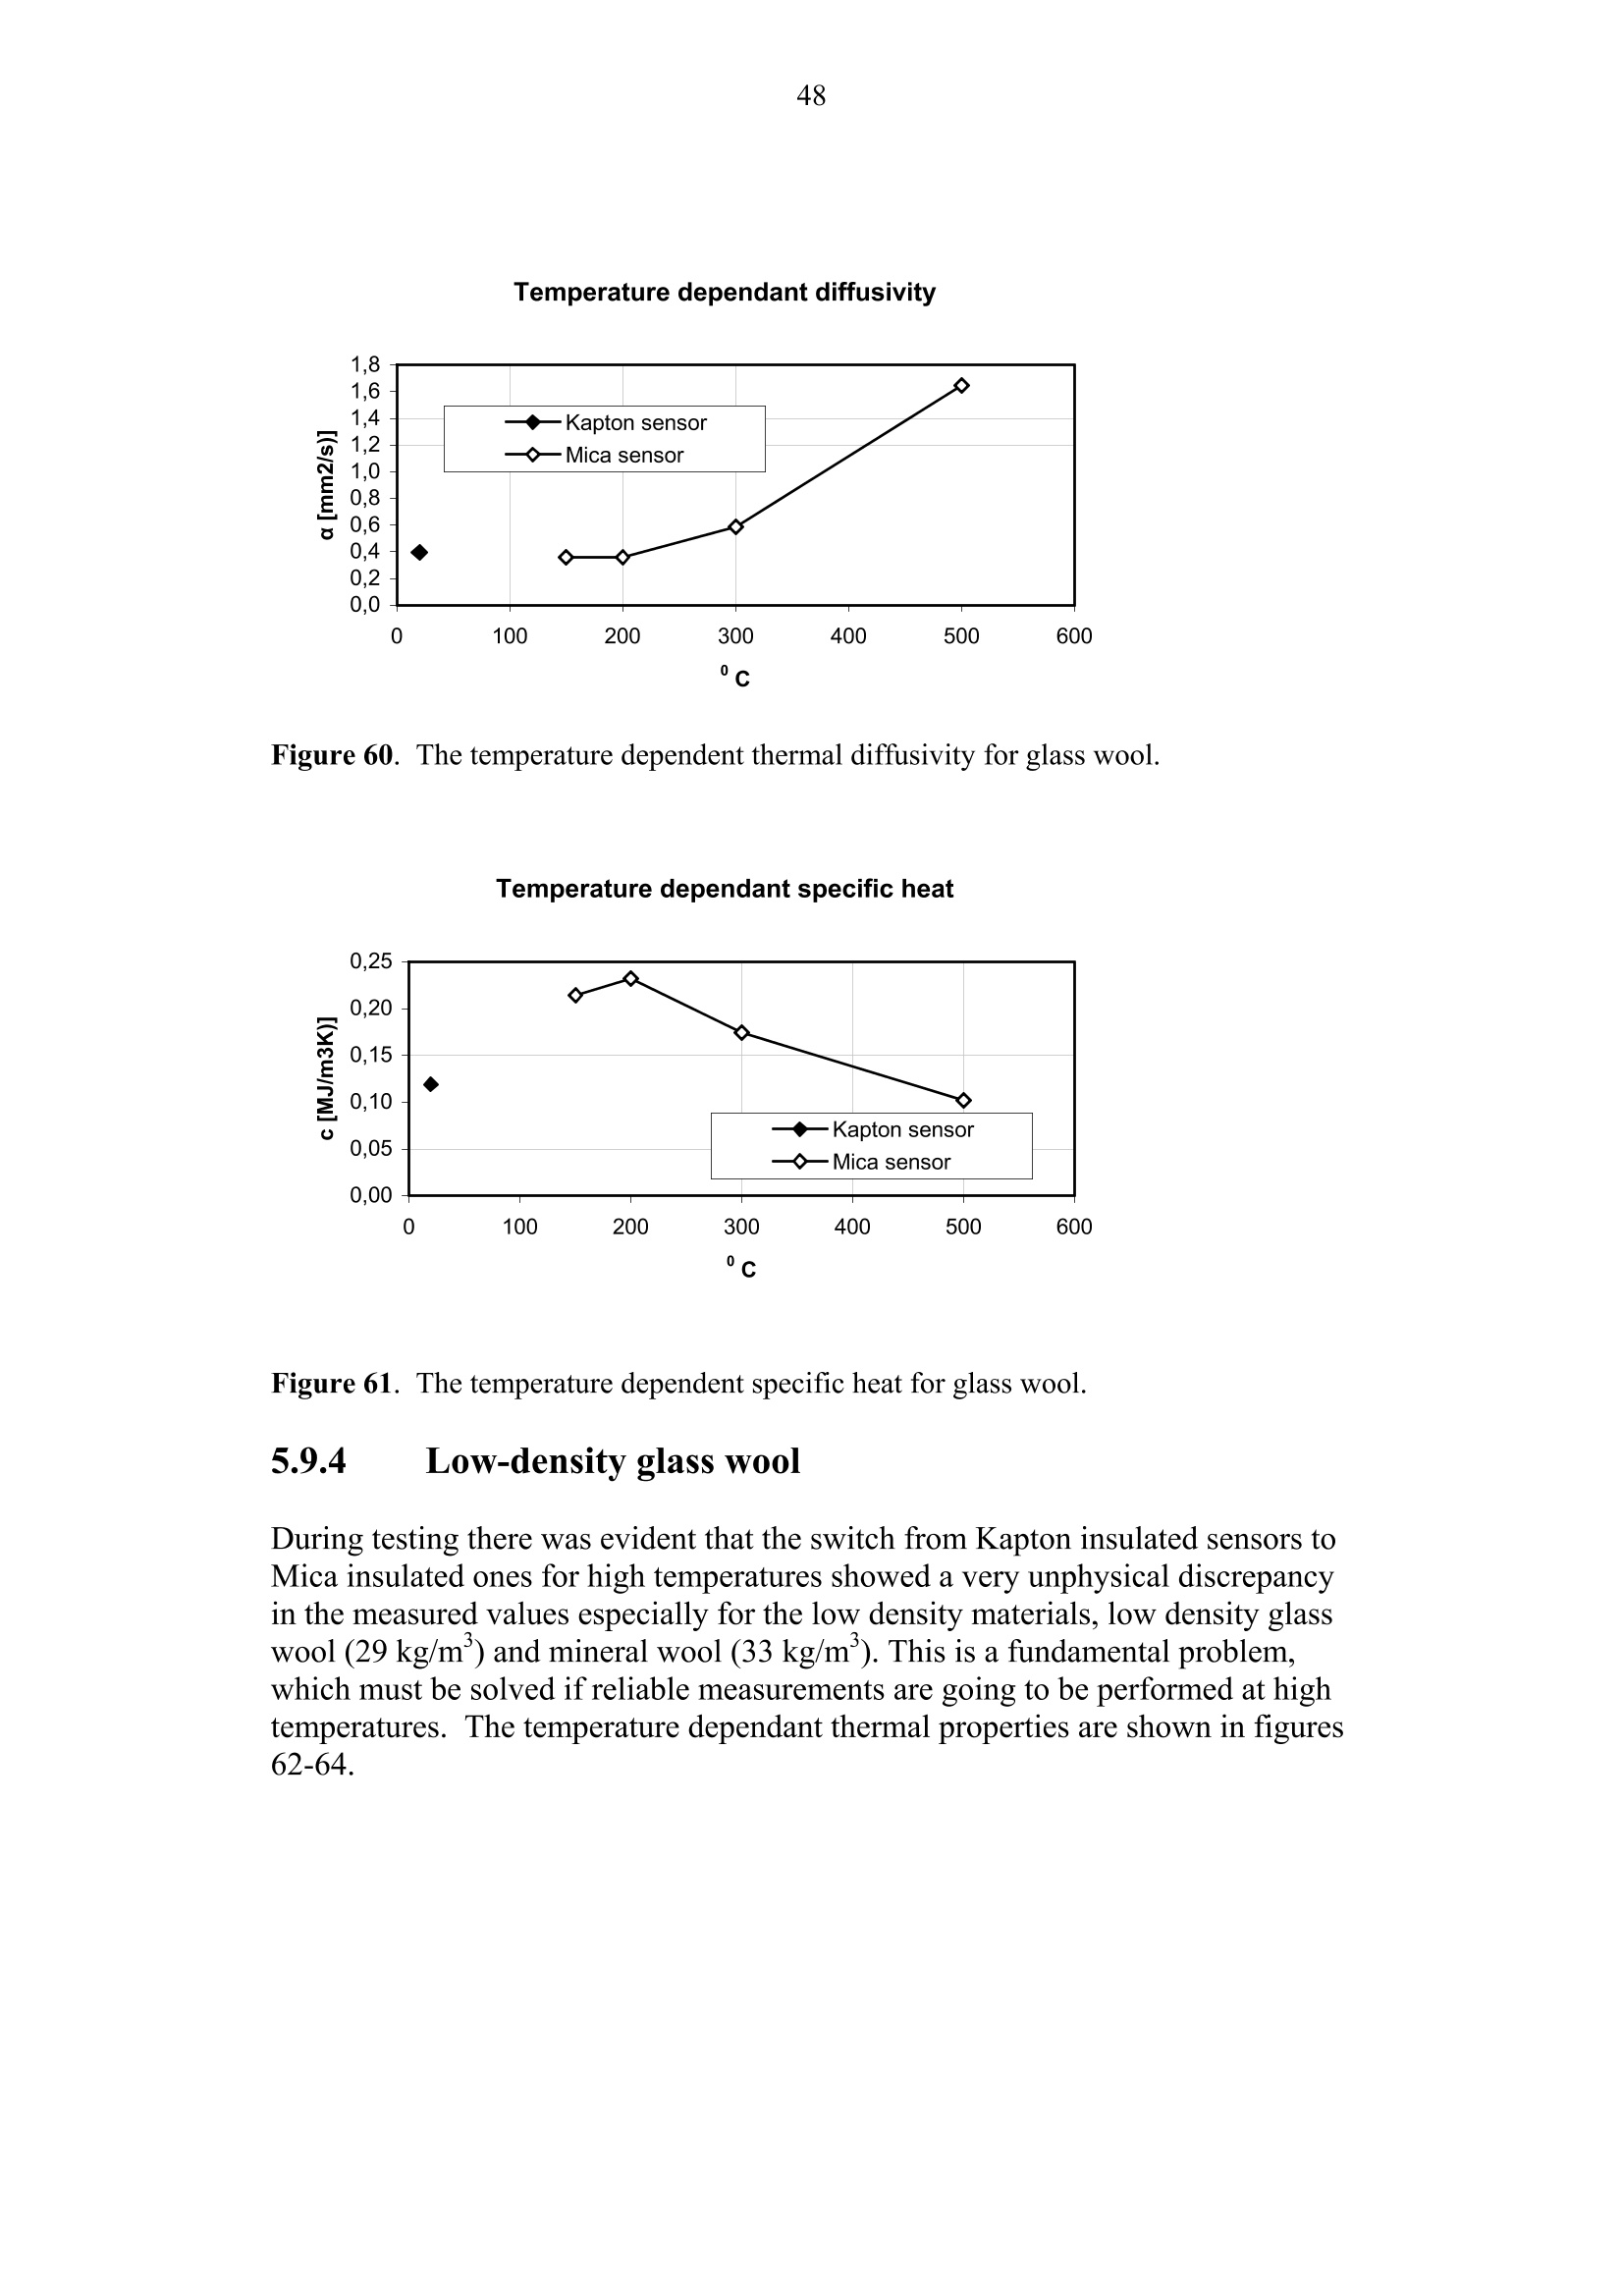


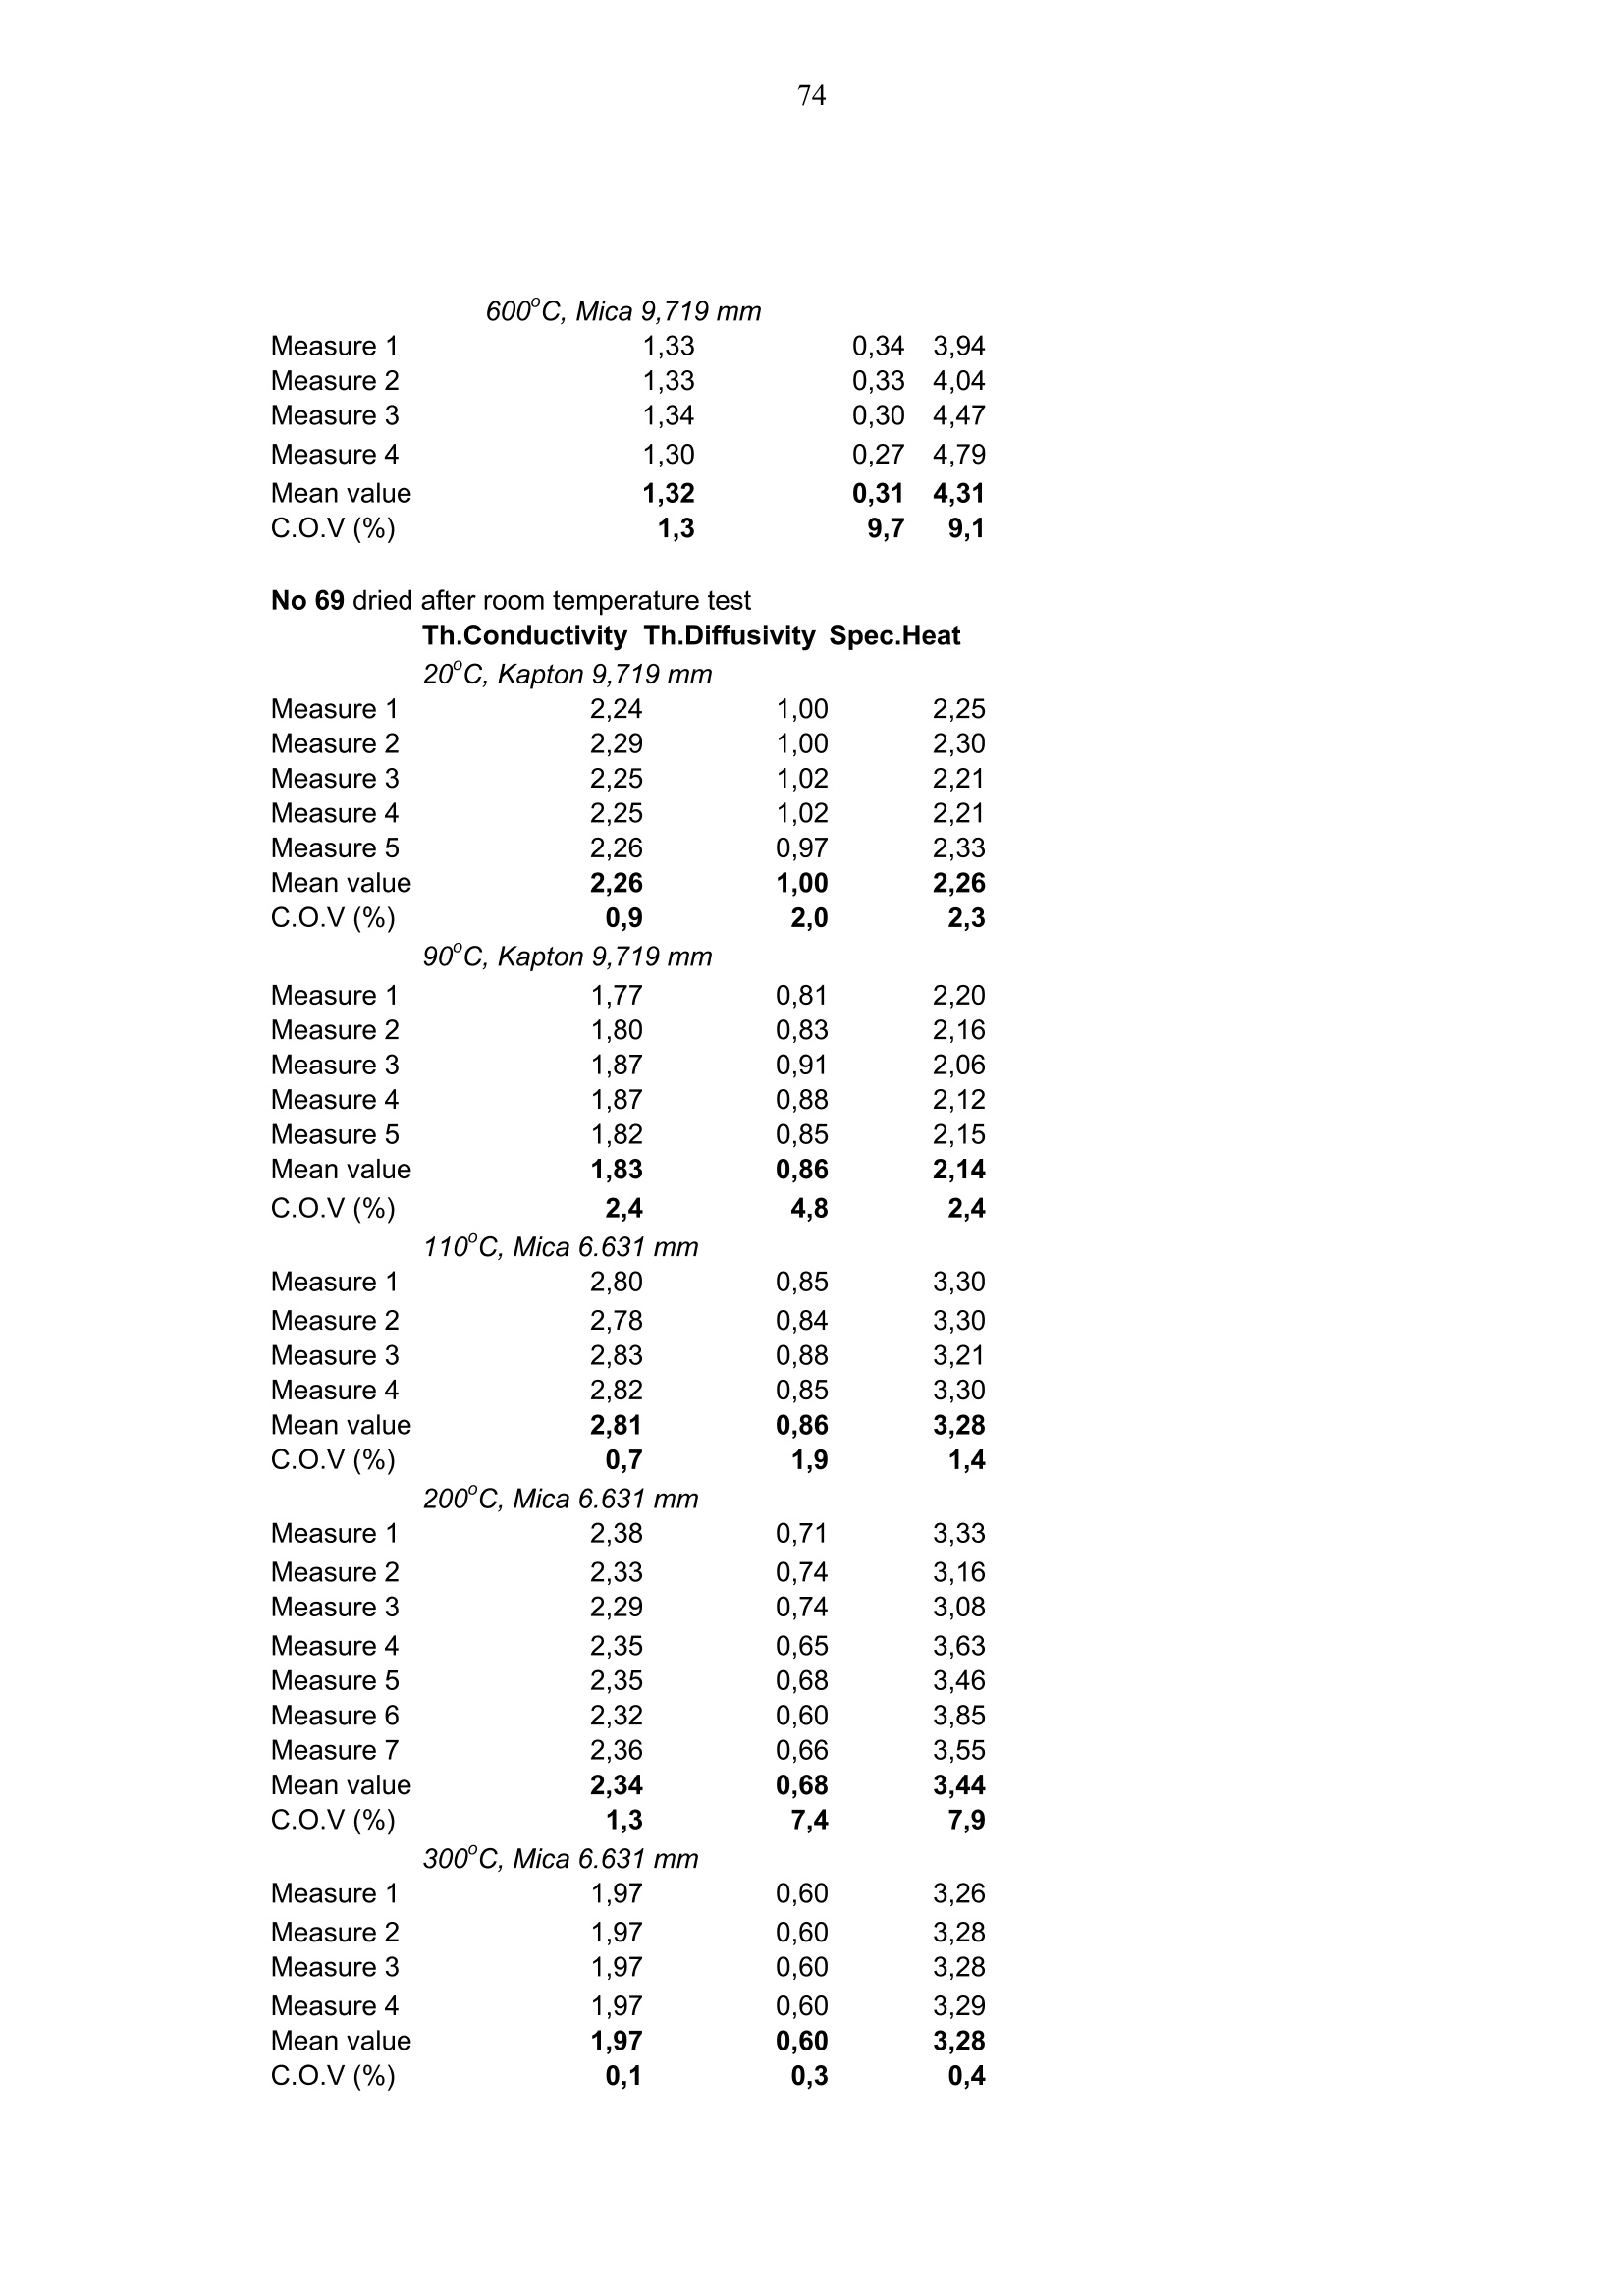


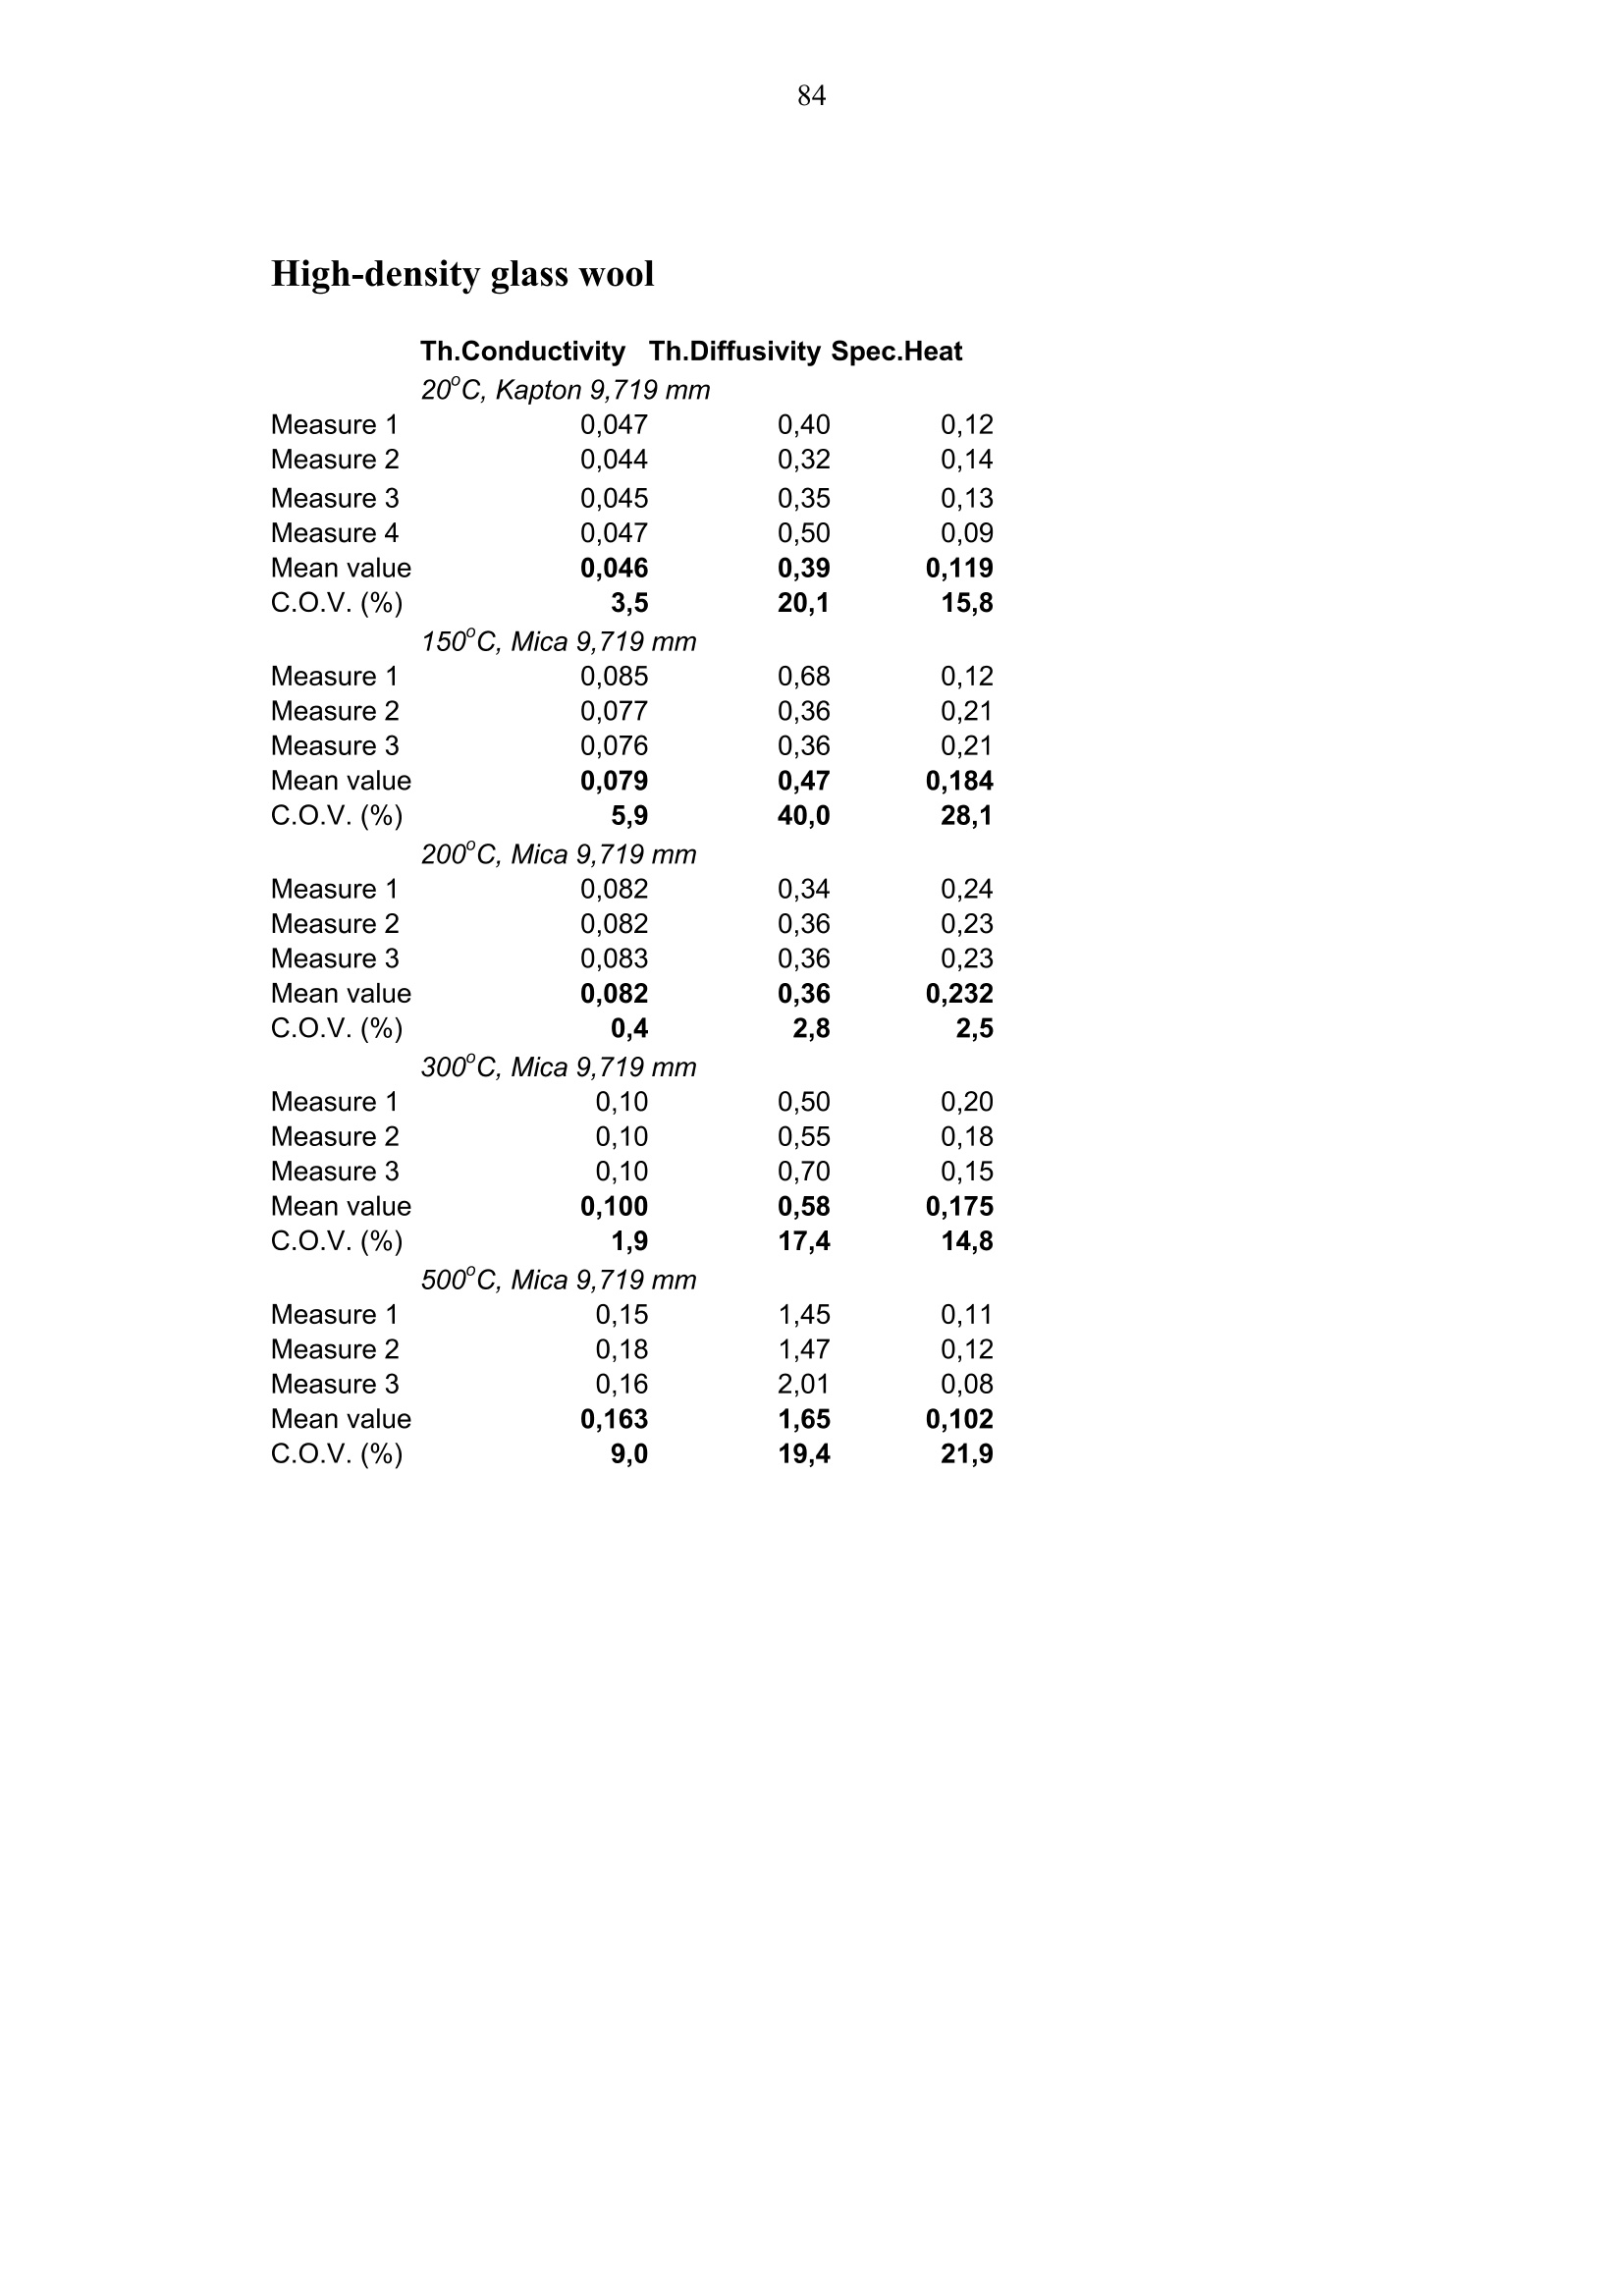


还剩88页未读,是否继续阅读?

产品配置单
上海依阳实业有限公司为您提供《建筑材料中导热系数,热导率,湿度,热性能检测方案(导热仪)》,该方案主要用于建筑工程中导热系数,热导率,湿度,热性能检测,参考标准--,《建筑材料中导热系数,热导率,湿度,热性能检测方案(导热仪)》用到的仪器有瞬态平面热源法导热系数测试系统
相关方案
更多
该厂商其他方案
更多