


方案详情
文
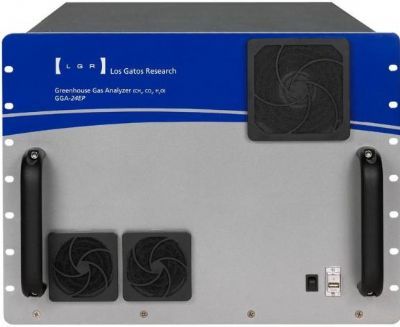
多国科学家在北极利用Los Gatos甲烷分析仪确定水的甲烷排放。
摘要:东西伯利亚 (ESAS) 仅有少量导致全球变暖的甲烷排放到大气中,而海底的永冻层可以作为甲烷的保存库。超过5000次的水中溶解甲烷的海上观测表明其大于 ESAS 地下水的 80% 和地表水的 50% (超饱和状态)。当前的大气排放通量,主要由两个组分构成,这与过去对整个世界海洋的甲烷排放的预测基本一致。通过 ESAS 水体的甲烷泄露的测量表明在生物 - 岩石圈和变暖的北极气候之间存在相互作用。
方案详情

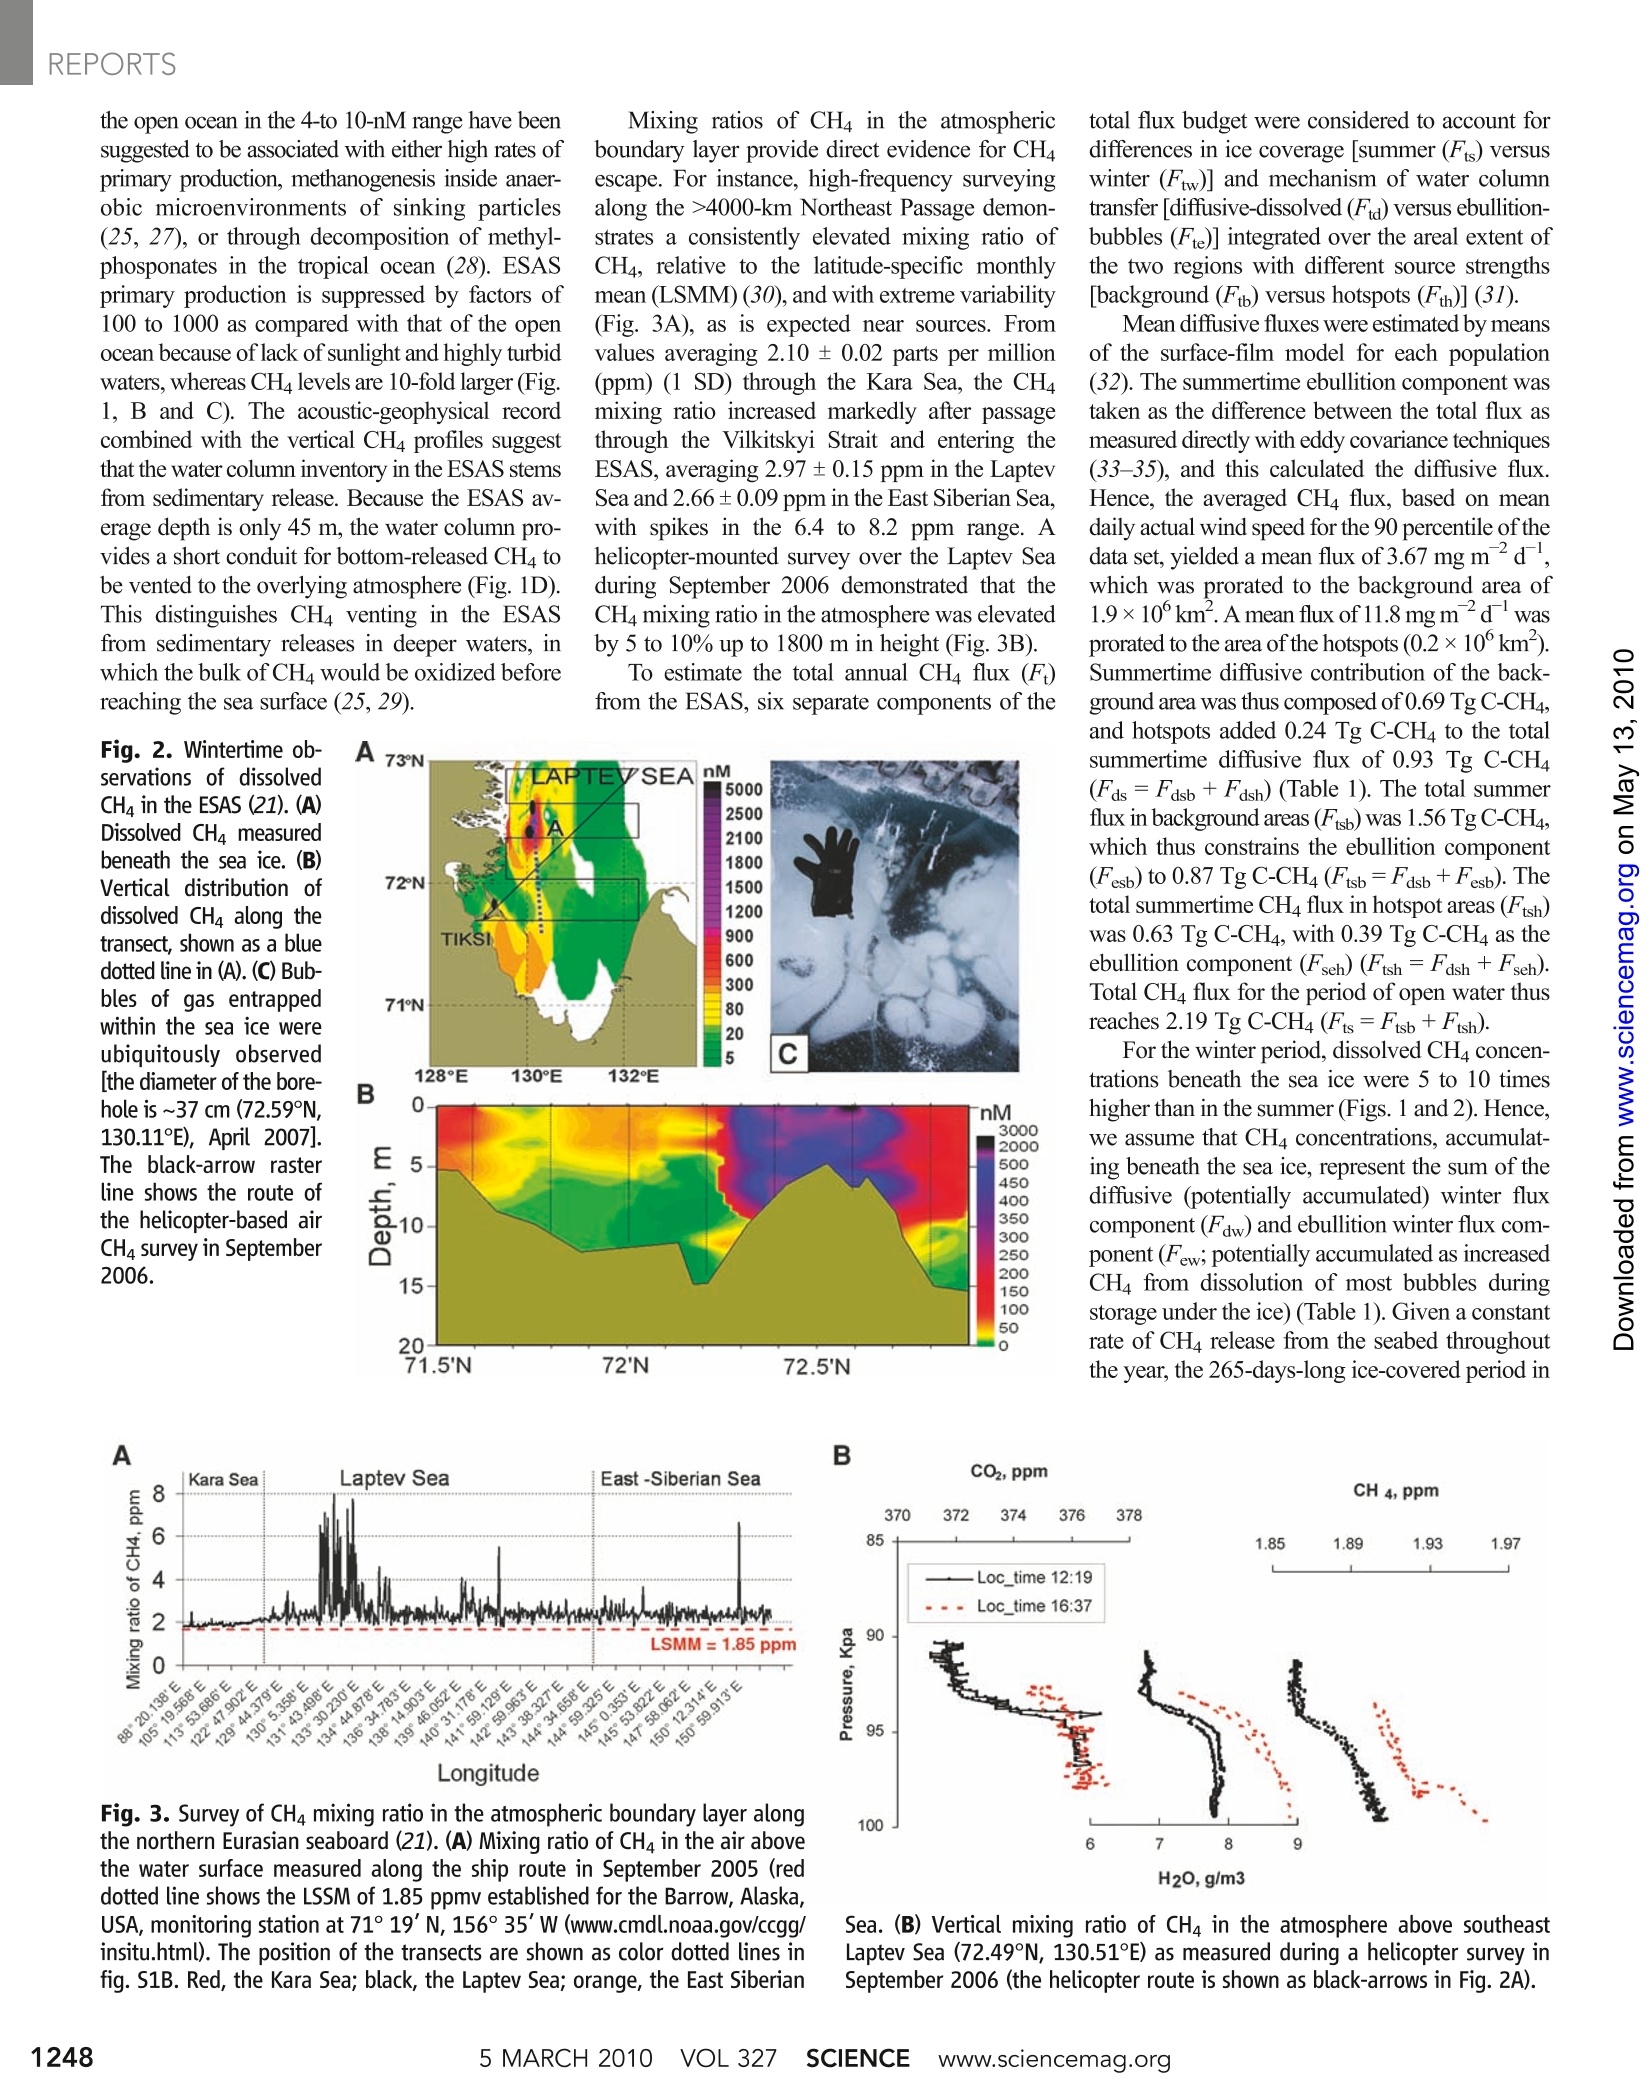
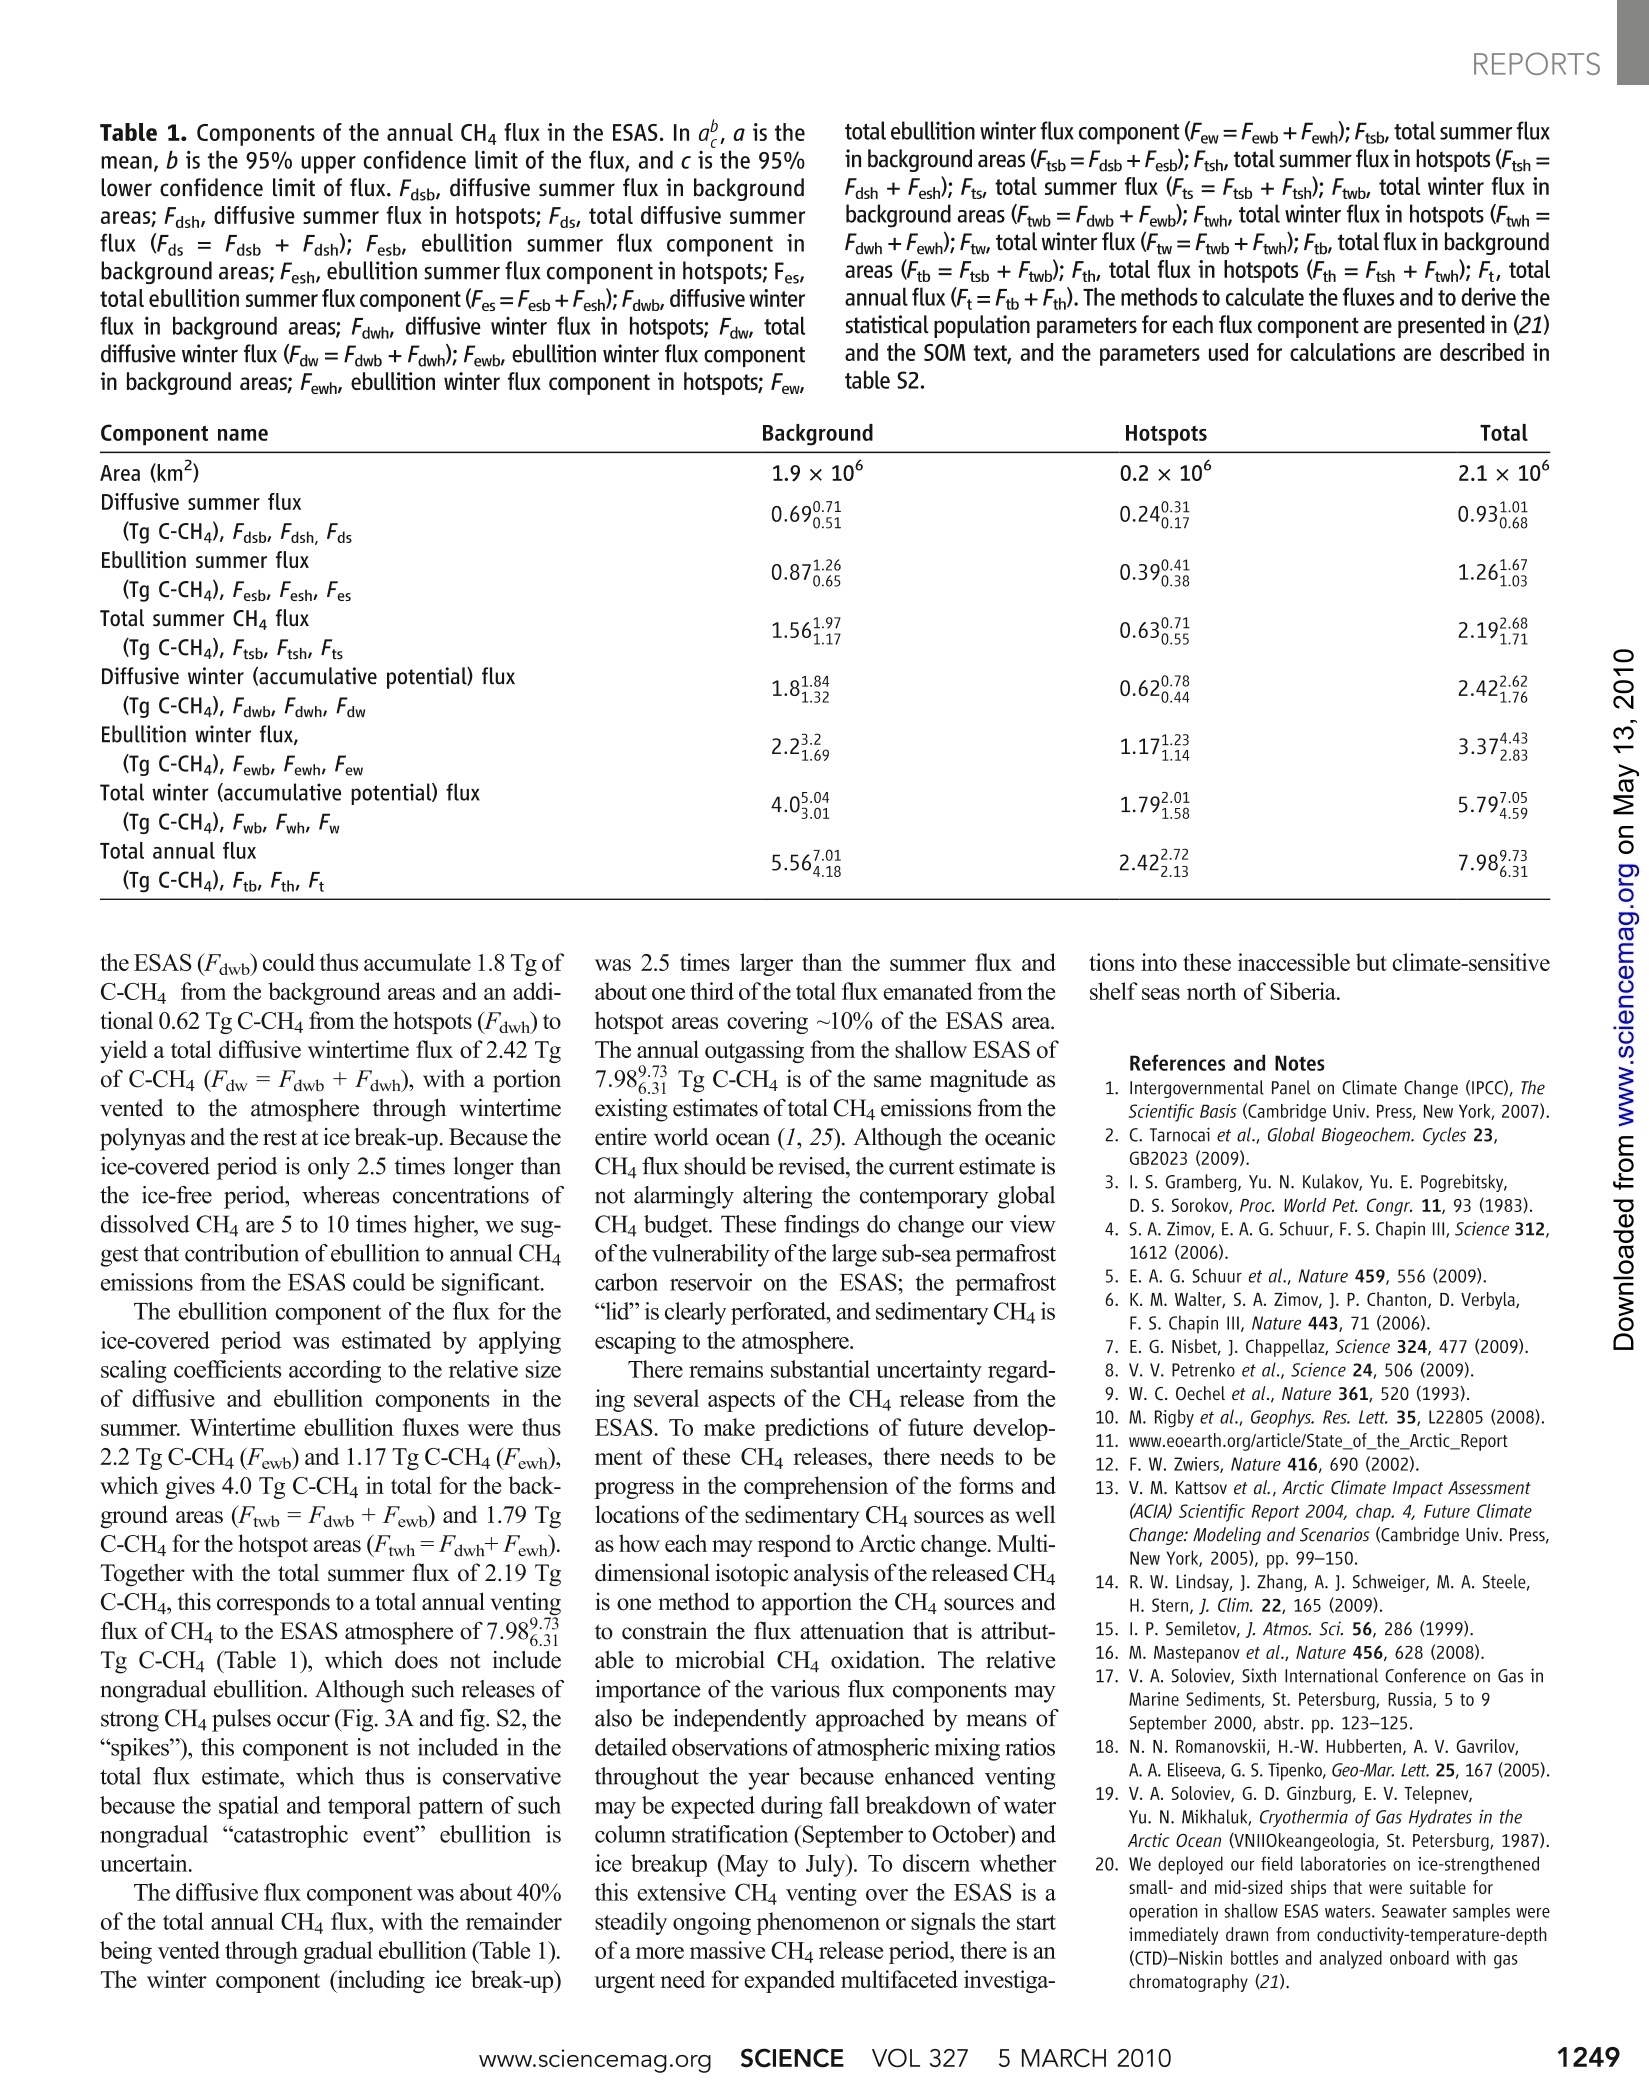
Extensive Methane Venting to the Atmosphere from REPORTS Sediments of the East Siberian Arctic Shelf Natalia Shakhova, et al. Science 327, 1246 (2010); DOI: 10.1126/science.1182221 This copy is for your personal, non-commercial use only. If you wish to distribute this article to others, you can order high-quality copies for yourcolleagues, clients, or customers by clicking here. Permission to republish or repurpose articles or portions of articles can be obtained byfollowing the guidelineshere. The following resources related to this article are available online at www.sciencemag.orgthis information is current as of May 13, 2010): Updated information and services, including high-resolution figures, can be found in the onlineversion of this article at: http://www.sciencemag.org/cgi/content/full/327/5970/1246 Supporting Online Material can be found at:http://www.sciencemag.org/cgi/content/full/327/5970/1246/DC1 A list of selected additional articles on the Science Web sites related to this article can befound at: http://www.sciencemag.org/cgi/content/full/327/5970/1246#related-content This article cites 25 articles. 2 of which can be accessed for free:http://www.sciencemag.org/cgi/content/full/327/5970/1246#otherarticles This article has been cited by 3 articles hosted by HighWire Press; see:http://www.sciencemag.org/cgi/content/full/327/5970/1246#otherarticles This article appears in the following subject collections:Atmospheric Science http://www.sciencemag.org/cgi/collection/atmos ( Science (print ISSN 0 036-8075; online ISSN 1095-9203) is published weekly, except the last week in December, by theAmerican Association for the Advancement of Science, 1200 N ew York Avenue NW, Washington, DC 2000 5 . Copyright2010 by the A merican Association fo r the A d vancement of S c ience; a e: ll r ights reserved. The title Sc i ence is aregistered trademark of AAAS. ) liquid sample (6-9) lies at least partly in thedifferent HSO4 profiles. Because of nearlyuniform H SO4 concentrations in case of in situexperiments (5, 12, 13), particles have muchmore time to grow to detectable sizes. In the caseof a point source, [H2SO4] decreases rapidly withtime (fig. S3) (17), and the growth is not efficientenough. We have conducted experiments withthese two approaches by using the same flowtube and detectors. Therefore, the differences aris-ing from different experimental geometries anddifferent detectors are eliminated in our study. In conclusion, we have shown that themystery concerning the apparent disagreementof several orders of magnitude in the nucleationrates and 2 to 3 orders of magnitude in the onset[Hz2SO4] between the in situ-produced HSO4and the H2SO4 from a liquid sample does notexist. Therefore, the role of other sulfur-containing species (13), like HSOs, seems tobe of minor importance in the nucleation process,even though these other pathways cannot becompletely excluded. Furthermore, we showedthat nucleation occurs at atmospherically relevantH SO4 concentrations. The relation between thenucleation rate and HSO4 concentration [d(ln.J)/d(ln[H2SO4])=1.0 to 2.1] from our experimentis consistent with the corresponding atmosphereobservations. A nucleation rate of unity is ob-served at a [HzSO4] slightly above 10° moleculescm,which is well in line with most atmosphericdata (1-4,28,29). However, in certain locationsco-occurrence of nucleation mechanisms involy-ing other species is plausible. We also showedthat HSO4 condensation has a dominating con-tribution to the observed particle growth in ourexperiment. The growth rate of (6±2)×10[HSO4] cm’moleculesnm sobtained from our data is close to the theoretical estimate of pureH SOa condensation and is smaller than ambientgrowth rates, which supports the findings that inthe atmosphere, compounds like organics (30, 31)or ammonia (32) are involved in the early growthprocess. Even though the exact nucleation mech-anism remains an open question, our results showthat HSO4 at atmospheric concentrations canexplain atmospheric nucleation rates in mostlocations even without clear participation of am-monia or organic substances. Therefore, our find-ings can be used straightforwardly in furthermodel studies, including climate models. ( References and Notes ) ( 1 . R. ]. Weber et al., Chem . Eng. Commun. 1 51, 5 3 (1996). ) ( 2 . S .-L. Sihto et al., Atmos . Chem. Phys. 6, 4079 (2006). ) ( 3 . C . Kuang, P . H. McMurry, A. V. McCormick, F. L. Ei s ele, ) ( J. G eophys. R es. 1 13, ( D10), D10209 (2008). ) ( 4. I. Riipinen et al., Atmos. Chem. Phys. 7 , 1 8 99 (2007). ) ( 5. T. Berndt, O. Boge, F . Stratmann, ]. Heintzenberg, M. K ulmala, Science 207, 698 (2005). ) ( 6. B . E. Wyslouzil, ] . H. Seinfeld, R. C. Flagan, K.Okuyama, J . P hys. Chem. 9 4, 6 842 ( 1 991). ) ( 7 . Y . Viisanen, M. Kulmala, A. Laaksonen, ]. Chem. P hys. 107,920 (1997). ) ( 8. S . M . Ball, D . R. Hanson, F. L. E i sele, P . H . M c Murry, ) ( ] . Geophys. Res. 104 ( D19), 23709 (1999). ) ( 9 . R . Zhang e t al., Science 304, 14 8 7 (2004). ) ( 10. P . H . M cMurry,J. Colloid Interface Sci. 7 8, 513 ( 1 980). ) ( 11. ] . P. Friend, R. A. Barnes, R. M. Vasta, ]. P hys. Chem. 8 4 , 2423(1980). ) ( 12. T . B erndt, O. Boge, F . S tratmann, Ge o phys. Res . Lett. 33 , L 15817 ( 2006). ) ( 13. T. Berndt et al. , Atmos. Chem. Phys. 8, 6365 (2008). ) ( 14. L .-H. Young et a l. , Atmos. Chem. Phys. 8, 4997 (2008). ) ( 15. D . R . B enson, G eophys. Res. L ett. 35, 11801 (2008). ) ( 16. D . K ashchiev,]. Chem. P hys. 76, 5098 (1982). ) ( 17. M aterials a nd methods ar e av a ilable as supporting m aterial on Science Online. ) ( 18. F . E isele, D. Tanner,]. Geophys. Res. 98, ( D 5), 9001 (1 9 93). ) ( 19. M . Sipila e t al., Aerosol Sci . Technol. 43, 126 (2009). ) Extensive Methane Venting to theAtmosphere from Sediments of theEast Siberian Arctic Shelf Natalia Shakhova,1,2*+ Igor Semiletov,1,2* Anatoly Salyuk, Vladimir Yusupov,Denis Kosmach, Orjan Gustafsson’ Remobilization to the atmosphere of only a small fraction of the methane held in East SiberianArctic Shelf (ESAS) sediments could trigger abrupt climate warming, yet it is believed thatsub-sea permafrost acts as a lid to keep this shallow methane reservoir in place. Here, we show thatmore than 5000 at-sea observations of dissolved methane demonstrates that greater than 80% ofESAS bottom waters and greater than 50% of surface waters are supersaturated with methaneregarding to the atmosphere. The current atmospheric venting flux, which is composed of adiffusive component and a gradual ebullition component, is on par with previous estimates ofmethane venting from the entire World Ocean. Leakage of methane through shallow ESAS watersneeds to be considered in interactions between the biogeosphere and a warming Arctic climate. the terrestrial and continental shelf regionsof the Arctic contain a megapool of carbonin shallow reservoirs (1-3), most of whichis presently sequestered in permafrost (4, 5). 20. L. A. Sgro,]. Fernandez de la Mora, Aerosol Sci. Technol.38,1(2004). ( 21. K . E. ]. L ehtinen, M . K ulmala, Atmos. C h em. Ph y s. 3, 25 1 (2003). ) ( 2 2. M . Kulmala et al.,J . A erosol Sci. 35, 1 43 ( 2004). ) ( 2 3. C . D. O’Dowd et al., ]. Geophys . Res . 107 , 8108 (2002). ) 24. K. lida, M. R. Stolzenburg, P. H. McMurry, ]. N. Smith,].Geophys. Res. 113, (D5), D05207 (2008). 25. M. Kulmala, K. E. ]. Lehtinen, A. Laaksonen, Atmos.Chem. Phys. 6, 787 (2006). 26. B. K. Ku, ]. Fernandez de la Mora, Aerosol Sci. Technol.43, 241(2009). ( 2 7. M . Kulmala e t a l ., Science 318, 8 9 (2007). ) ( 2 8. R . ]. Weber e t al., Geophys. Res.Lett. 26, 307 (1999). ) ( 2 9. W . Birmili, A. Wiedensohler, C. Plass-Dulmer, H . B erresheim, Geophys. Res. L ett. 27, 2205( 2 000). ) ( 3 0. ] . N. S m ith et al . , G e ophys. Res. Lett. 35 , L04808 (200 8 ). ) 31. C. D. O'Dowd, P. Aalto, K. Hameri, M. Kulmala, ( T. Hoffmann, Nature 416, 497 ( 2002). ) ( 32. ] . N. Smith et a l.,]. Geophys. R es. 110, (D22), D22503 (2005). ) 33. We thank K. Pielok and A. Rohmer for technical ( a ssistance a nd ]. H eitzenberg, K .E.]. Lehtinen,V.-M. K erminen, and M . M c Grath for help preparing themanuscript. C. D. O'Dowd is acknowledged f o r providing t he P HA-UCPC i n strument. K. L ehtipalo is acknowledged f or assistance with the PHA-UCPC, ]. M ikkila and E . S iivola for c onstructing th e P S M, R. Taipale for hel p w ith t he PTR-MS, ]. H a kala an d K. Neitola for assistance w ith experiments, and T. Nieminen fo r u s eful discussions.This work was partially funded by European C ommision6th F ramework program pr o ject European In t egrated P roject on Aerosol, Cloud, C limate, and Air Quality Interactions (EUCAARI), contract 036833-2. Financial s upport from Kone f o undation, Vaisala f oundation, O tto M alm foundation, the A cademy o f F i nland and European R esearch Council is a cknowledged. ) Supporting Online Material www.sciencemag.org/cgi/content/full/327/5970/1243/DC1Materials and MethodsSOM Text Figs. S1 to S4 ( 7 A ugust 2 009; a ccepted 5 ] anuary 2010 10.1126/science.1180315 ) shifts (7, 8) and the renewed growth of contem-porary atmospheric CH4(9,10). Observed Arcticwarming in early 21st century is stronger thanpredicted by several degrees (fig. S1A) (11-14),which may accelerate the thaw-release of CH ina positive feedback. Investigations of Arctic CH4releases have focused on thawing permafroststructures on land (2,4-6,15,16) with a scarcityof observations of CH4 in the extensive butinaccessible East Siberian Arctic Seas (ESAS),where warming is particularly pronounced (fig.S1A) (11). The ESAS (encompassing the Laptev, EastSiberian, and Russian part of the Chuckchi seas)occupies an area of 2.1×10°km, three times asgreat as that of terrestrial Siberian wetlands. It is ashallow seaward extension of the Siberian tundrathat was flooded during the Holocene transgres-sion 7 to 15 thousand years ago (17,18). The ESASsub-sea permafrost (fig. S1B), which is frozensediments interlayered with the flooded peatland(18), not only contains comparable amounts ofcarbon as still land-fast permafrost in the Siberiantundra but also hosts permafrost-related seabeddeposits of CH4(19). Moreover, ESAS sub-sea permafrost is potentially more vulnerable tothawing than terrestrial permafrost. In contrastto on-land permafrost, sub-sea permafrost has ex-perienced a drastic change in its thermal regimebecause of the seawater inundation. The annualaverage temperature of ESAS bottom seawater(-1.8°to 1℃) is 12°to 17℃ warmer than theannual average surface temperature over on-land permafrost (18, 19). A physical implicationof combined bottom-up geothermal and top-down seawater heat fluxes is the partial thawingand failure of sub-sea permafrost and thus anincreased permeability for gases. We conse-quently hypothesized that CH4 is released fromseabed deposits to vent extensively to the Arcticatmosphere. To test our hypothesis, we have undertakenannual field campaigns (August to September,2003 to 2008; six cruises in total), one helicoptersurvey (September 2006), and one over-icewinter expedition (April 2007) (20,21). On thebasis of a more limited coverage, we previouslydemonstrated that CH4 is released from ESASsediments to the overlying water column (22, 23).The objective of the present study is an integratedassessment of multiple years of observations for “International Arctic Research Centre, University of Alaska,Fairbanks, AK 99709, USA. Russian Academy of Sciences, FarEastern Branch, Pacific Oceanological Institute, Vladivostok690041, Russia. Stockholm University, Bert Bolin Centre forClimate Research and Department of Applied EnvironmentalScience, Stockholm S-10691, Sweden. *These authors contributed equally to this work.tTo whom correspondence should be addressed. E-mail:nshakhov@iarc.uaf.edu the whole of the ESAS in order to provide anestimate of the venting flux of CH4 to the atmo-sphere over the entire ESAS. It is this estimate ofCH flux to the atmosphere that has been missingand has prohibited a quantitative evaluation ofthe putative climate impact of ESAS CH4. TheCH flux estimates are based on 5100 seawatersamples from 1080 stations-a larger databasethan for any previous ocean CH4 study (24)geographically distributed over the ESAS (Fig.1A). The “landscape” of coastal waters is for-tunately less heterogeneous than the terrestrialtundra counterpart. Hence, this assessment ofcoastal CH4 fluxes may be contrasted with up-scaling challenges facing estimates of greenhousegas emissions from the tundra, which nonethelessare usually limited to measurements at a few sites(4-6,15,16). The dissolved CH4 concentrations in ESASduring summers of 2003 to 2008 demonstrate aubiquitous supersaturation over large spatial scales.Although there are some spatial and vertical gra-dients, the emerging picture is that most of theESAS is supersaturated with CH4 in the near-bottom waters (Fig.1B), with>50%ofthe ESASsurface waters being supersaturated (Fig. 1C).The median summertime supersaturation was880% in background areas and 8300% in hotspotareas [supporting online material (SOM) text](21). Besides the vertical profiles with maxi-mums near the seafloor, which is common to theoceanic water column (25), the dissolved CH4distribution in the ESAS varied to maximum nearthe surface and had uniform distribution through-out the water column. Both the bottom- and surface-water-dissolvedCH4 concentrations in winter (~5° to 7℃ colderthan in summer), which were measured in thestudied area beneath the sea ice (Fig.2A), were 5to 10 times higher than in summer yet had thesame distribution within the water column (Fig.2B). Such vertical profiles point to a rapid trans-port mechanism such as ebullition, which is con-sidered to be a predominant mechanism of CH4transport in shallow waters and particularly whenCH4 releases from seabed deposits (26). Largebubbles of gas entrapped within the fast (annual)sea ice were observed in winter (Fig. 2C), withCH4 concentrations of up to 11,400 parts per mil-lion by volume (ppmv). Manifestations of ebul-lition were furthermore registered acoustically asbubble clouds, which rose from the seabed through-out the entire water column or, at deeper locations,to subsurface layers (fig. S2). Taken together, theobservations demonstrate that the ESAS theworld's largest continental shelf seais peren-nially laden with CH4 all the way up to the seasurface. The horizontal and vertical CH4 distributionsindicate a sedimentary source, yet other sourceswere considered. Riverborne export of CH4 wasexcluded on the basis of measurements in, forexample, the Bykovskaya Channel, which is themain outflow of the Lena River (fig. S3). Dis-solved CH4 concentrations decreased downstreamthrough the delta channel and then increased againin coastal waters, suggesting separate sources.Production of CH4 in the water column was alsodeemed unlikely to account for the high ESASconcentrations. Mixed-layer maxima of CH4 in the open ocean in the 4-to 10-nM range have beensuggested to be associated with either high rates ofprimary production, methanogenesis inside anaer-obic microenvironments of sinking particles(25,27), or through decomposition of methyl-phosponates in the tropical ocean (28). ESASprimary production is suppressed by factors of100 to 1000 as compared with that of the openocean because of lack of sunlight and highly turbidwaters, whereas CH4 levels are 10-fold larger (Fig.1, B and C). The acoustic-geophysical recordcombined with the vertical CH4 profiles suggestthat the water column inventory in the ESAS stemsfrom sedimentary release. Because the ESAS av-erage depth is only 45 m, the water column pro-vides a short conduit for bottom-released CH4 tobe vented to the overlying atmosphere (Fig.1D).This distinguishes CH4 venting in the ESASfrom sedimentary releases in deeper waters, inwhich the bulk of CH4 would be oxidized beforereaching the sea surface (25, 29). Mixing ratios of CH4 in the atmosphericboundary layer provide direct evidence for CH4escape. For instance, high-frequency surveyingalong the >4000-km Northeast Passage demon-strates a consistently elevated mixing ratio ofCH4, relative to the latitude-specific monthlymean (LSMM) (30), and with extreme variability(Fig. 3A), as is expected near sources. Fromvalues averaging 2.10±0.02 parts per million(ppm) (1 SD) through the Kara Sea, the CH4mixing ratio increased markedly after passagethrough the Vilkitskyi Strait and entering theESAS, averaging 2.97 ±0.15 ppm in the LaptevSea and 2.66±0.09 ppm in the East Siberian Sea,with spikes in the 6.4 to 8.2 ppm range. Ahelicopter-mounted survey over the Laptev Seaduring September 2006 demonstrated that theCH4 mixing ratio in the atmosphere was elevatedby 5 to 10% up to 1800 m in height (Fig. 3B). To estimate the total annual CH4 flux (F)from the ESAS, six separate components of the Fig. 2. Wintertime ob-servations of dissolvedCHa in the ESAS (21). (A)Dissolved CH4 measuredbeneath the sea ice. (B)Vertical distribution ofdissolved CH4 along thetransect, shown as a bluedotted line in (A). (C) Bub-bles of gas entrappedwithin the sea ice wereubiquitously observedthe diameter of the bore-hole is~37 cm (72.59°N,130.11°E), April 2007].The black-arrow rasterline shows the route ofthe helicopter-based airCH4 survey in September2006. A 73N total flux budget were considered to account fordifferences in ice coverage [summer (Fts) versuswinter (Ftw)] and mechanism of water columntransfer [diffusive-dissolved (Fla) versus ebullition-bubbles (Fte)] integrated over the areal extent ofthe two regions with different source strengths[background (Ftb) versus hotspots (Fth)] (31). Mean diffusive fluxes were estimated by means of the surface-film model for each population(32). The summertime ebullition component wastaken as the difference between the total flux asmeasured directly with eddy covariance techniques(33-35), and this calculated the diffusive flux.Hence, the averaged CH4 flux, based on meandaily actual wind speed for the 90 percentile of thedata set, yielded a mean flux of 3.67 mg md-,which was prorated to the background area of1.9×10°km’. A mean flux of 11.8 mg mdwasprorated to the area of the hotspots (0.2×10°km).Summertime diffusive contribution of the back-ground area was thus composed of 0.69 Tg C-CH4,and hotspots added 0.24 Tg C-CH4 to the totalsummertime diffusive flux of 0.93 Tg C-CH4(Fds =Fdsb +Fdsh) (Table 1). The total summerflux in background areas (Ftsb) was 1.56 Tg C-CH4,which thus constrains the ebullition component(Fesb) to 0.87 Tg C-CH4 (Ftsb=Fdsb+Fesb). Thetotal summertime CH4 flux in hotspot areas (Ftsh)was 0.63 Tg C-CH4, with 0.39 Tg C-CH4 as theebullition component (Fseh) (Ftsh=Fdsh +Fseh).Total CH4 flux for the period of open water thusreaches 2.19 Tg C-CH4 (Fts=Ftsb +Ftsh). For the winter period, dissolved CH4 concen-trations beneath the sea ice were 5 to 10 timeshigher than in the summer (Figs. 1 and 2). Hence,we assume that CH4 concentrations, accumulat-ing beneath the sea ice, represent the sum of thediffusive (potentially accumulated) winter fluxcomponent (Fdw) and ebullition winter flux com-ponent (Few; potentially accumulated as increasedCH4 from dissolution of most bubbles duringstorage under the ice) (Table 1). Given a constantrate of CH4 release from the seabed throughoutthe year, the 265-days-long ice-covered period in Longitude Fig. 3. Survey of CH4 mixing ratio in the atmospheric boundary layer alongthe northern Eurasian seaboard (21). (A) Mixing ratio of CHa in the air abovethe water surface measured along the ship route in September 2005 (reddotted line shows the LSSM of 1.85 ppmv established for the Barrow, Alaska,USA, monitoring station at 71° 19'N, 156°35’W (www.cmdl.noaa.gov/ccgg/insitu.html). The position of the transects are shown as color dotted lines infig. S1B. Red, the Kara Sea; black, the Laptev Sea; orange, the East Siberian Sea. (B) Vertical mixing ratio of CH4 in the atmosphere above southeastLaptev Sea (72.49°N, 130.51°E) as measured during a helicopter survey inSeptember 2006 (the helicopter route is shown as black-arrows in Fig. 2A). Table 1. Components of the annual CHa flux in the ESAS. In a, a is themean, b is the 95% upper confidence limit of the flux, and c is the 95%lower confidence limit of flux. Fdsb, diffusive summer flux in backgroundareas; Fdsh, diffusive summer flux in hotspots; Fds, total diffusive summerflux (Fds = Fdsb + Fdsh); Fesb, ebullition summer flux component inbackground areas; Fesh, ebullition summer flux component in hotspots; Fes,total ebullition summer flux component (Fes=Fesb+Fesh); Fdwb, diffusive winterflux in background areas; Fdwh, diffusive winter flux in hotspots; Fdw, totaldiffusive winter flux (Fdw=Fdwb +Fdwh); Fewb, ebullition winter flux componentin background areas; Fewh, ebullition winter flux component in hotspots; Few total ebullition winter flux component (Few=Fewb+Fewh);Ftsb, total summer fluxin background areas (Ftsb=Fdsb+Fesb); Ftsh, total summer flux in hotspots (Ftsh=Fdsh + Fesh); Fts, total summer flux (Fts=Ftsb + Ftsh); Ftwb, total winter flux inbackground areas (Ftwb=Fdwb +Fewb); Ftwh, total winter flux in hotspots (Ftwh=Fdwh +Fewh); Ftw, total winter flux (Ftw=Ftwb+Ftwh); Ftb, total flux in backgroundareas (Ftb=Ftsb+ Ftwb); Fth, total flux in hotspots (Fth=Ftsh +Ftwh); Ft, totalannual flux (F=Ftb+Fth). The methods to calculate the fluxes and to derive thestatistical population parameters for each flux component are presented in (21)and the SOM text, and the parameters used for calculations are described intable S2. Component name Background Hotspots Total Area (km²) 1.9×10° 0.2×10° 2.1×10° Diffusive summer flux 0.6951 0.24817 0.930.68 (Tg C-CH4), Fdsb, Fdsh, Fds Ebullition summer flux 0.87065 0.3938 1.26103 (Tg C-CH4), Fesb, Fesh, Fes Total summer CHa flux (Tg C-CH4), Ftsb, Ftsh, Fts 1.561¥ 0.63 2.192.68 Diffusive winter (accumulative potential) flux 1.813 0.629-.0.7484 2.4239 (Tg C-CH4), Fdwb, Fdwh, Fdw Ebullition winter flux, (Tg C-CH4), Fewb, Fewh, Few 2.2169 1.17 3.372.83 Total winter (accumulative potential) flux 4.03.81 1.79 5.798 (Tg C-CH4), Fwb, Fwh, Fw Total annual flux (Tg C-CH4), Ftb, Fth, Ft 5.56418 2.42 7.9831 the ESAS (Fdwb) could thus accumulate 1.8 Tg ofC-CH4 from the background areas and an addi-tional 0.62 Tg C-CH4 from the hotspots(Fdwh) toyield a total diffusive wintertime flux of 2.42 Tgof C-CH4 (Fdw =Fdwb +Fdwh), with a portionvented to the atmosphere through wintertimepolynyas and the rest at ice break-up. Because theice-covered period is only 2.5 times longer thanthe ice-free period, whereas concentrations ofdissolved CH4 are 5 to 10 times higher, we sug-gest that contribution of ebullition to annual CHemissions from the ESAS could be significant. The ebullition component of the flux for theice-covered period was estimated by applyingscaling coefficients according to the relative sizeof diffusive and ebullition components in thesummer. Wintertime ebullition fluxes were thus2.2 Tg C-CH4 (Fewb) and 1.17 Tg C-CH4 (Fewh),which gives 4.0 Tg C-CH4 in total for the back-ground areas (Ftwb=Fdwb +Fewb) and 1.79 TgC-CH4 for the hotspot areas (Ftwh=Fdwh+Fewh).Together with the total summer flux of 2.19 TgC-CH4, this corresponds to a total annual ventingflux of CHa to the ESAS atmosphere of 7.98Tg C-CH4(Table 1), which does not includenongradual ebullition. Although such releases ofstrong CH4 pulses occur (Fig. 3A and fig. S2, the“spikes”), this component is not included in thetotal flux estimate, which thus is conservativebecause the spatial and temporal pattern of suchnongradual “catastrophic event” ebullition isuncertain. The diffusive flux component was about 40%of the total annual CH4 flux, with the remainderbeing vented through gradual ebullition (Table 1).The winter component (including ice break-up) was 2.5 times larger than the summer flux andabout one third of the total flux emanated from thehotspot areas covering ~10% of the ESAS area.The annual outgassing from the shallow ESAS of7.9827 Tg C-CHa is of the same magnitude asexisting estimates of total CH4 emissions from theentire world ocean (1,25). Although the oceanicCH4 flux should be revised, the current estimate isnot alarmingly altering the contemporary globalCH4 budget. These findings do change our viewof the vulnerability of the large sub-sea permafrostcarbon reservoir on the ESAS; the permafrost“lid"is clearly perforated, and sedimentary CH isescaping to the atmosphere. There remains substantial uncertainty regard-ing several aspects of the CH4 release from theESAS. To make predictions of future develop-ment of these CH4 releases, there needs to beprogress in the comprehension of the forms andlocations of the sedimentary CH4 sources as wellas how each may respond to Arctic change. Multi-dimensional isotopic analysis of the released CH4is one method to apportion the CH4 sources andto constrain the flux attenuation that is attribut-able to microbial CH4 oxidation. The relativeimportance of the various flux components mayalso be independently approached by means ofdetailed observations of atmospheric mixing ratiosthroughout the year because enhanced ventingmay be expected during fall breakdown of watercolumn stratification (September to October) andice breakup (May to July). To discern whetherthis extensive CH4 venting over the ESAS is asteadily ongoing phenomenon or signals the startof a more massive CH4 release period, there is anurgent need for expanded multifaceted investiga- tions into these inaccessible but climate-sensitiveshelf seas north of Siberia. ( References and Notes ) ( 1. I ntergovernmental P a nel on Climate Ch a nge (IPCC), The ) Scientific Basis (Cambridge Univ. Press, New York, 2007). 2. C. Tarnocai et al., Global Biogeochem. Cycles 23,GB2023 (2009). 3. I. S. Gramberg, Yu. N. Kulakov, Yu. E. Pogrebitsky,D. S. Sorokov, Proc. World Pet. Congr. 11, 93 (1983). 4. S. A. Zimov, E. A. G. Schuur, F. S. Chapin III, Science 312,1612 (2006). 5. E. A. G. Schuur et al., Nature 459, 556 (2009). ( 6 . K . M. Walter, S. A . Z imov, ]. P . Chanton, D. Verbyla, F. S. Chapin II, Nature 443, 7 1 ( 2006). ) 7. E. G. Nisbet, ]. Chappellaz, Science 324, 477 (2009). 8. V. V. Petrenko et al., Science 24, 506 (2009). ( 9 . W . C. Oechel e t al. , Nature 361, 520 (1993). ) 10. M. Rigby et al., Geophys. Res. Lett. 35, L22805 (2008). 11. www.eoearth.org/article/State_of_the_Arctic_Report ( 12. F . W. Zwiers, Nature 416, 690 (2002). ) 13. V. M. Kattsov et al., Arctic Climate Impact Assessment(ACIA) Scientific Report 2004, chap. 4, Future ClimateChange: Modeling and Scenarios (Cambridge Univ. Press,New York, 2005), pp. 99-150. ( 14. R . W. L i ndsay, ] . Zhang, A. ]. S c hweiger, M. A. Steele, ) H. Stern, ]. Clim. 22, 165 (2009). ( 15. I . P . Semiletov, J. Atmos. Sci . 56,286( 1 999). ) ( 16. M . M astepanov et al., Nature 456, 628 (2008). ) ( 1 7. V . A. Soloviev, Sixth I nternational Conference on Gas in M arine Sediments, S t . Petersburg, Russia, 5 to 9 S eptember 2 0 00, a b str. p p. 1 23-125. ) 18. N. N. Romanovskii, H.-W. Hubberten, A. V. Gavrilov,A. A. Eliseeva, G. S. Tipenko, Geo-Mar. Lett. 25, 167 (2005).19. V. A. Soloviev, G. D. Ginzburg, E. V. Telepnev, Yu. N. Mikhaluk, Cryothermia of Gas Hydrates in theArctic Ocean (VNIIOkeangeologia, St. Petersburg, 1987) 20. We deployed our field laboratories on ice-strengthenedsmall- and mid-sized ships that were suitable foroperation in shallow ESAS waters. Seawater samples were. immediately drawn from conductivity-temperature-depth(CTD)-Niskin bottles and analyzed onboard with gaschromatography (21). 21. Materials and methods are available as supportingmaterial on Science Online. 22. N. Shakhova, I. Semiletov, G. Panteleev, Geophys. Res. Lett.32, L09601 (2005). 23. N. Shakhova, I. Semiletov, ]. Mar. Syst. 66, 227(2007). 24. All the seawater-dissolved CHa concentration data arepublicly and freely available at http://research.iarc.uaf.edu/SSSS/. A description of this large database ascompared with previous ocean CH4 studies is presented intable S3. ( 2 5. W . S. Reeburgh, C hem. R e v. 107, 4 8 6 (2007). ) ( 2 6. I. Leifer, B. L uyendyk, ]. Boles, ]. C l ark, G l obal B iogeochem. Cycles 20, G B3008 (2006). ) ( 2 7. N. ]. P . O w ens, C. S. L a w, R. F . C. Mantoura, P. H. B u rkill, C . A . Llewellyn, Nature 354, 2 93 ( 1991). ) ( 2 8. D. M. Karl et a l., Nat. Geosci.1, 473 ( 2008). ) ( 29. G . K. Westbrook et al., Geophys. Res. Lett. 36, L 1 5608 ( 2009). ) ( 3 0. L SMM closest to th e st u dy area is established for the Barrow, Alaska, USA, monitoring s tation at 71°19'N, ) 156° 35'W(www.cmdl.noaa.gov/ccgg/insitu.html); it isequal to 1.85 ppmv. 31. The division into two subpopulations for background andhotspot areas within the ESAS was based on a statisticalapproach detailed in SOM text S2.1 and displayedgraphically in fig. S4. These two resolved populationswere then first subjected to an empirical distributionfunction (EDF) test (SOM text S1.1). The results of theEDF test (table S1) yielded that a lognormal distributionfunction best fit the data. This function was hence usedwhen applying the maximum likelihood (ML) method tocalculate the statistical population parameters mean andvariance [expressed as upper and lower 95% confidencelimits (equations are provided in SOM text S1.1)]. Thederived population parameters, displayed in table S2,were then used to estimate the overall ESAS CH fluxes as summarized in Table 1. 32. R. Wanninkhof, ]. Geophys. Res. 97 (C5), 7373 (1992). 33. D. D. Baldocchi, Glob. Change Biol. 9, 479 (2003). 34. ]. B. Edson, A. A. Hinton, K. E. Prada, J. E. Hare, C. W. Fairall, J. Atmos. Ocean. Technol. 15, 547 (1998). Hippocampal Short- and Long-TermPlasticity Are Not Modulated byAstrocyte Ca Signaling Cendra Agulhon,* Todd A. Fiacco, Ken D. McCarthy1 The concept that astrocytes release neuroactive molecules (gliotransmitters) to affect synaptictransmission has been a paradigm shift in neuroscience research over the past decade. This conceptsuggests that astrocytes, together with pre- and postsynaptic neuronal elements, make up afunctional synapse. Astrocyte release of gliotransmitters (for example, glutamate and adenosinetriphosphate) is generally accepted to be a Ca+-dependent process. We used two mouse lines toeither selectively increase or obliterate astrocytic G G protein-coupled receptor Ca²+ signalingto further test the hypothesis that astrocytes release gliotransmitters in a Ca+-dependent mannerto affect synaptic transmission. Neither increasing nor obliterating astrocytic Ca+fluxes affectsspontaneous and evoked excitatory synaptic transmission or synaptic plasticity. Our findings suggestthat, at least in the hippocampus, the mechanisms of gliotransmission need to be reconsidered. alcium transients in astrocytes are phys-Ciologically driven by metabotropic G, G3protein-coupled receptors (G。GPCRs),which can be activated after neurotransmitter re-lease from presynaptic terminals (1,2). At Schaffercollateral-CA1 (SC-CA1) synapses in acute hip-pocampal slices, astrocytes can modulate neuro-nal activity by elevations in Cathat are evokedby the following: (i) uncaging IPs or Ca in in-dividual astrocytes, (ii) repetitive depolarizationof the astrocyte membrane, (iii) mechanical stim-ulation of an astrocyte, or (iv) bath application ofendogenous G, GPCR agonists. With these phar-macological approaches, astrocyte Caelevationshave been reported to trigger gliotransmitter re-lease from astrocytes, resulting in the modulationof synaptic transmission and plasticity through the ( Department of Pharmacology, University of North Carolinaat Chapel H ill, Genetic Medicine Building , CB 7365, Chapel H ill, NC 27599, U S A. "D e partment of Cell Bio l ogy and Neu- r oscience, U niversity of California Riverside, Riverside, CA 92521, USA. ) ( *To whom c o rrespondence should be addressed. E- m ail:cendra_agulhon@med.unc.edu ) activation of presynaptic [for example, group Imetabotropic glutamate receptors (mGluRs) oradenosine A(1) receptors (AjRs)] or postsyn-aptic receptors [N-methyl-D-aspartate receptors(NMDARs)] (3-11). To circumvent a numberof caveats associated with the pharmacologicalapproaches described above (12-15), we haverecently developed and characterized two genet-ically modified mice [the MrgA1 and IP3R2knockout (KO) mice] that enable either selectiveactivation or inactivation of G, GPCR Casig-naling in astrocytes (13, 16,17). Within the hip-pocampus, the stimulation of transgenic MrgAlG。 GPCRs leads to astrocyte-specific Care-sponses that mimic the “Ca fingerprintre-sponse that is elicited by endogenous G GPCRs(13). In hippocampal slices derived from IP3R2KO mice (17), G, GPCR Casignaling is oblit-erated selectively in 100% of astrocytes withoutaffecting neuronal Caresponses (16). We first tested the possibility that astrocyticG, GPCR Ca is involved in the modulationof spontaneous excitatory postsynaptic currents(sEPSCs). In these and the following experiments, 35. T. Fujitani, Pap. Meteorol. Geophys. 36, 157 (1985). 36. We thank V. Sergienko, G. Golitsyn, S. Akasofu,L. Hinzman, and V. Akulichev for their support of ourwork in the Siberian Arctic. This research was supportedby the International Arctic Research Centre through aNational Oceanic and Atmospheric AdministrationCooperative Agreement, the Far Eastern Branch of theRussian Academy of Sciences, the Russian Foundation forBasic Research, NSF, the Swedish Research Council, andthe Knut and Alice Wallenberg Foundation. Supporting Online Material www.sciencemag.org/cgi/content/full/327/5970/1246/DC1Materials and MethodsSOM TextFigs. S1 to S4Tables S1 to S3References 21 September 2009; accepted 21 ]anuary 201010.1126/science.1182221 a high percentage of astrocytes (~90 to 100%)were stimulated so that each CA1 neuron hasthe vast majority of its synapses embedded inastrocyte processes that elevate Caupon G,GPCR agonist application. Control experimentsshowed that MrgA1R expression by itself in as-trocytes does not affect basal neuronal activity ina nonspecific manner [supporting online material(SOM) text S1].MrgA1R agonist Phe-Met-Arg-Phe-NH2 amide (FMRF, 15 uM) was appliedto trigger Ca elevations in ~90% of matureMrgA1 passive astrocytes (13) in cell bodies aswell as fine processes (Fig. 1, A and B, boxes/traces 1 to 5, SOM text S2, and movie S1). Nosignificant effect of astrocyte Caelevations onsEPSC frequency and amplitude in CA1 neuronsfrom MrgA1 mice was found Fig. 1C andSOM text S3,n=7, P>0.05). To test the pos-sibility that this lack of effect might be causedby the stimulation of a transgenic G, GPCR, wealso stimulated endogenous astrocytic endothelinG, GPCRs (ETRs), which were selected as op-timal candidates because they evoke gliotrans-mitter release in vitro (18), they are thought tobe very weakly expressed by neurons and heavi-ly expressed by brain astrocytes at postnatal day1 to 30 (19), and no direct effects on neuronalactivity have been reported when stimulatingETRs (13). Astrocytic ETR-mediated Ca in-creases in ~100% of astrocytes from wild-type(WT) hippocampal slices [endothelin 1 (ET1)and ET3, 10 nM each; SOM text S4, and fig.S1) had no effect on the frequency or amplitudeofsEPSCs (Fig. 1, D to F, and SOM text S5, n=5,P>0.05). Previous studies using conventional pharma-cological approaches have suggested that post-synaptic NMDARs might be preferential targetsfor glutamate release from astrocytes (3-7,9, 10),prompting us to examine the possibility that as-trocytic G,GPCR Caelevations modulate theNMDAR-mediated component of evoked whole-cell EPSCs (eEPSCs). FMRF does not produce anonspecific effect on NMDA eEPSCs (Fig. 2, Aand A1, and SOM text S6). FMRF or ETs were MARCH VOL CIENCEwww.sciencemag.org
确定
还剩4页未读,是否继续阅读?


北京理加联合科技有限公司为您提供《东西伯利亚沉积物中大气甲烷排放检测方案(在线自动监测系统)》,该方案主要用于其他中大气甲烷排放检测,参考标准--,《东西伯利亚沉积物中大气甲烷排放检测方案(在线自动监测系统)》用到的仪器有温室气体分析仪
相关方案
更多