


方案详情
文
This paper presents an experimental study on wave interactions with a
rectangular barge in a beam sea condition. Regular waves with a wave
period the same as the natural frequency of the barge were used in the experiments due to the fact that the barge is prone to capsizing under such waves. The barge was fixed on the free surface and no wave
overtopping was assumed. Particle Image Velocimetry (PIV) was
employed to measure the full-field two-dimensional velocity. Since the flow is highly turbulent, the phase-averaging technique was used to the extract the mean flow and turbulence properties. The mean flow
pattern, including velocity, vorticity, and streamline, was analyzed to quantify the mechanism of the interactions. The generation and
evolution of vorticity and turbulence kinetic energy were demonstrated.The turbulent kinetic energy is found to highly correlate with the vorticity field
方案详情

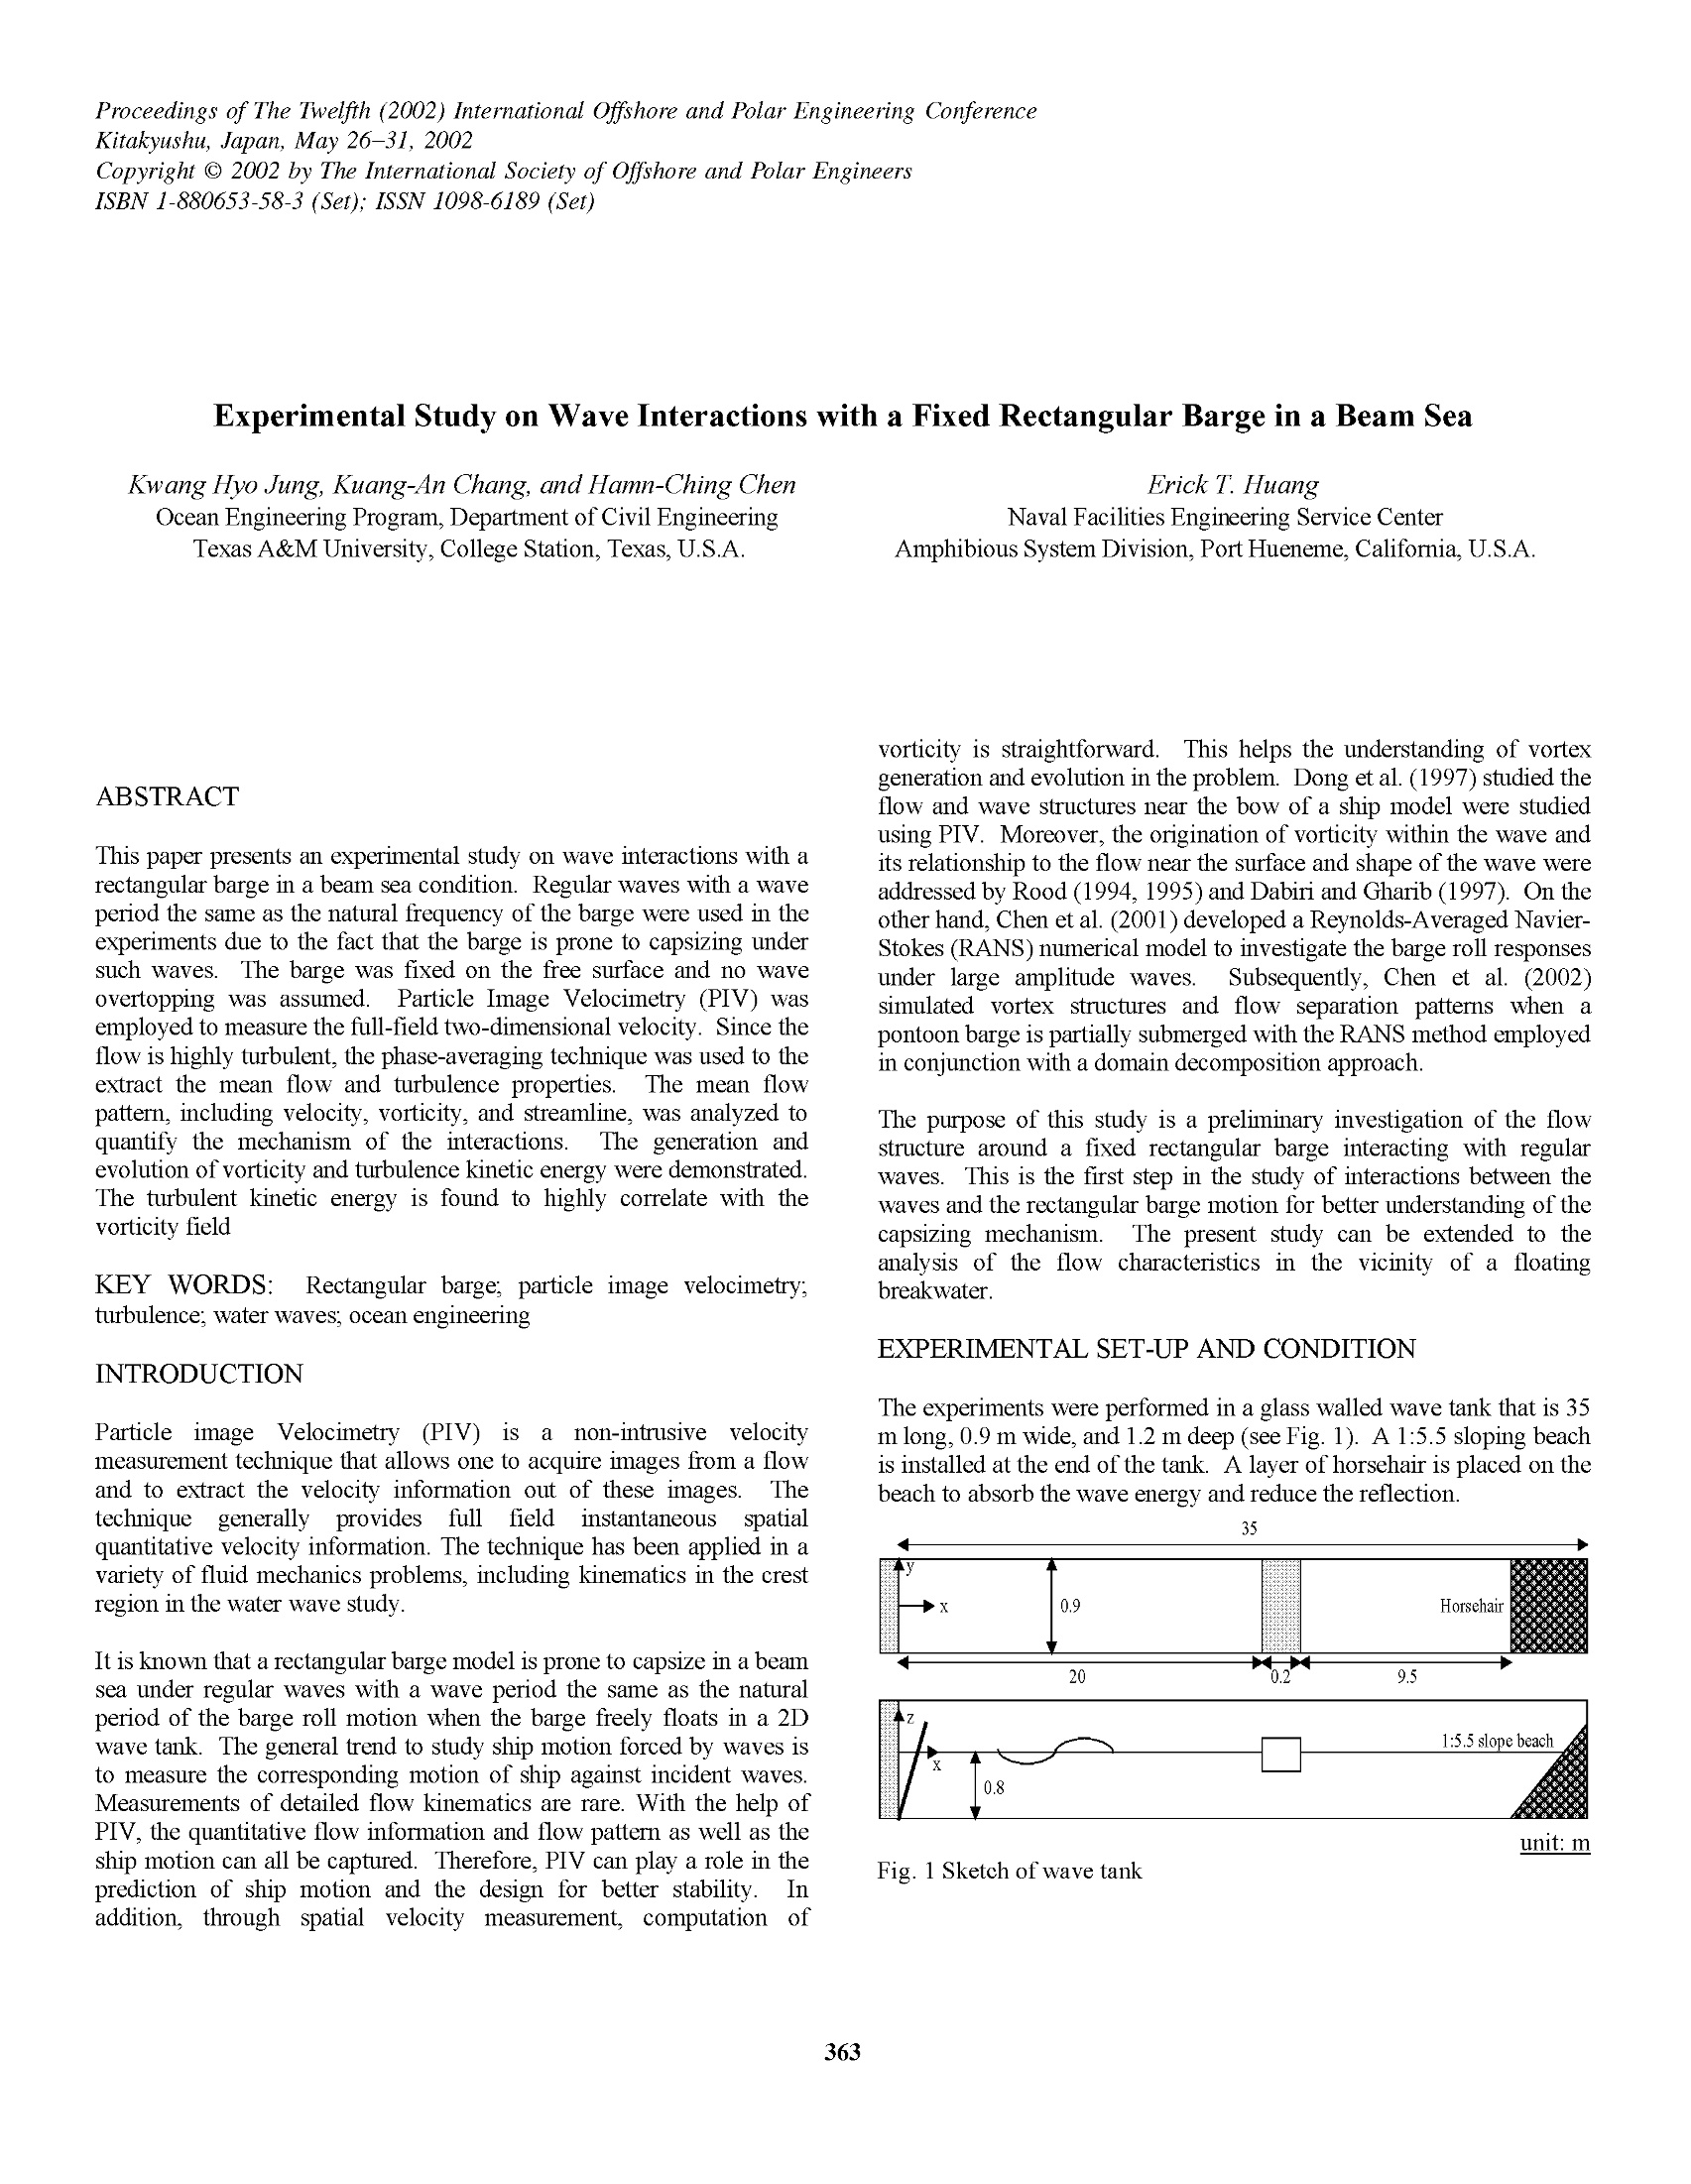
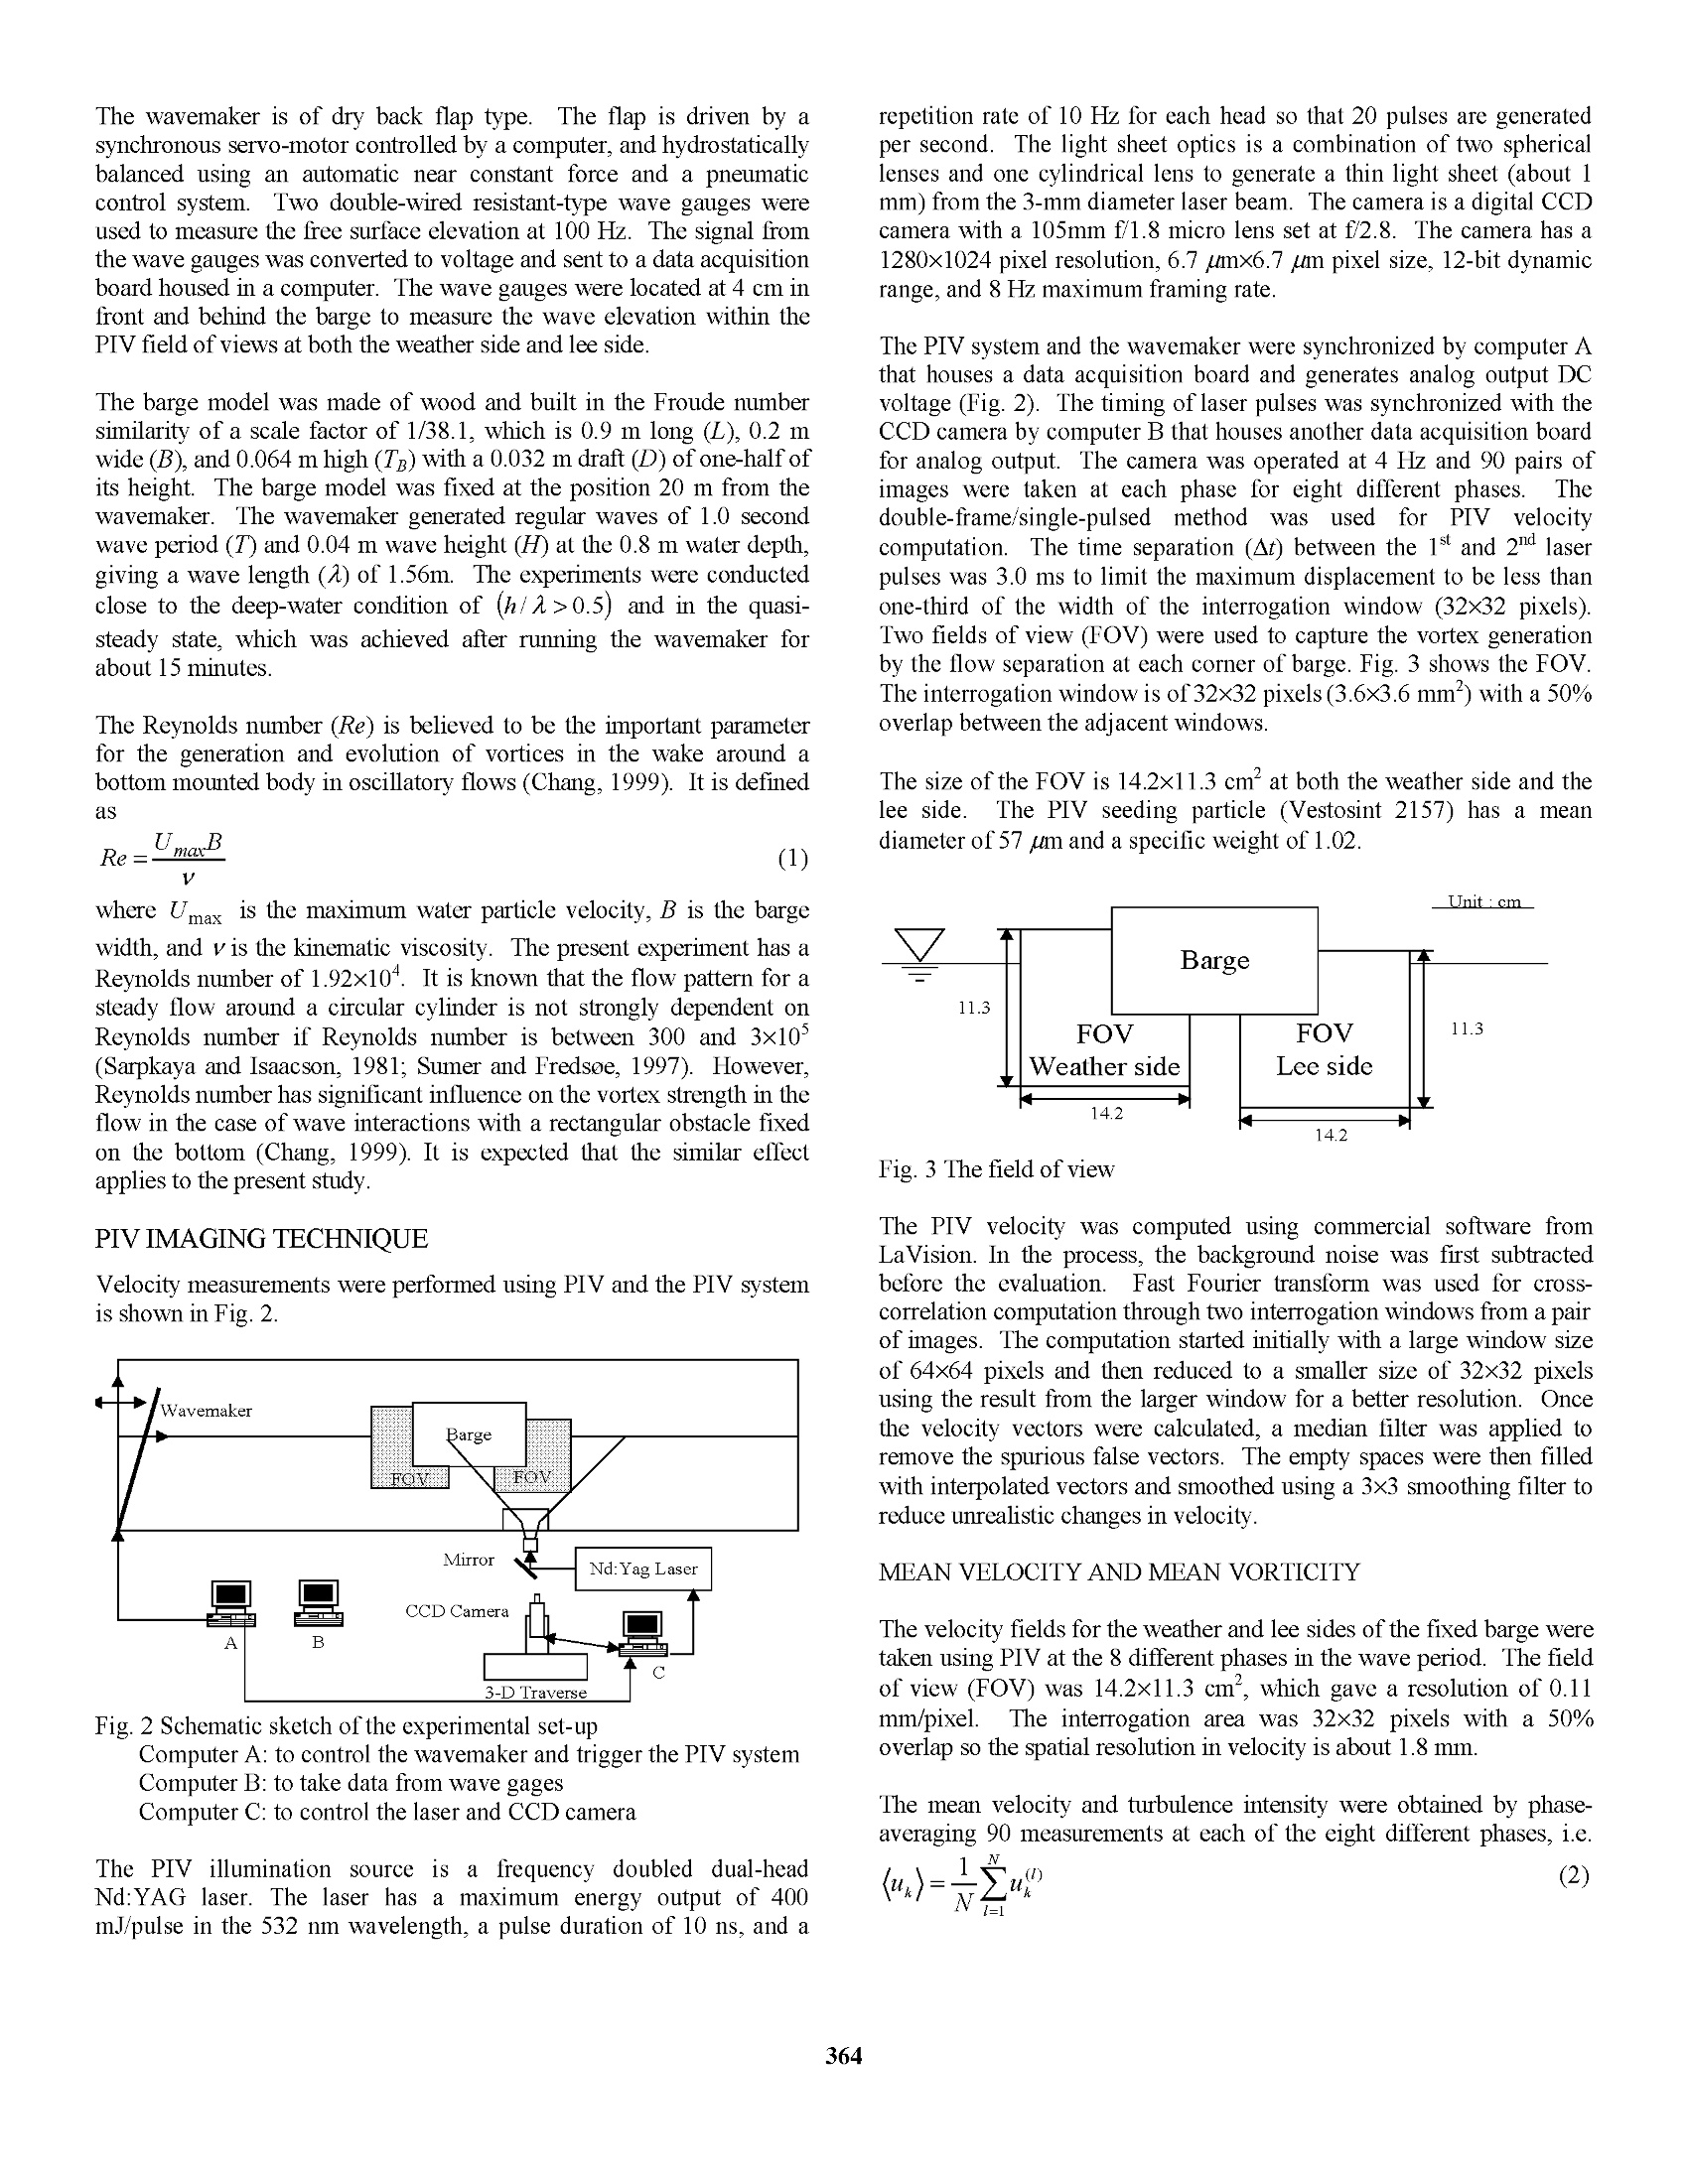
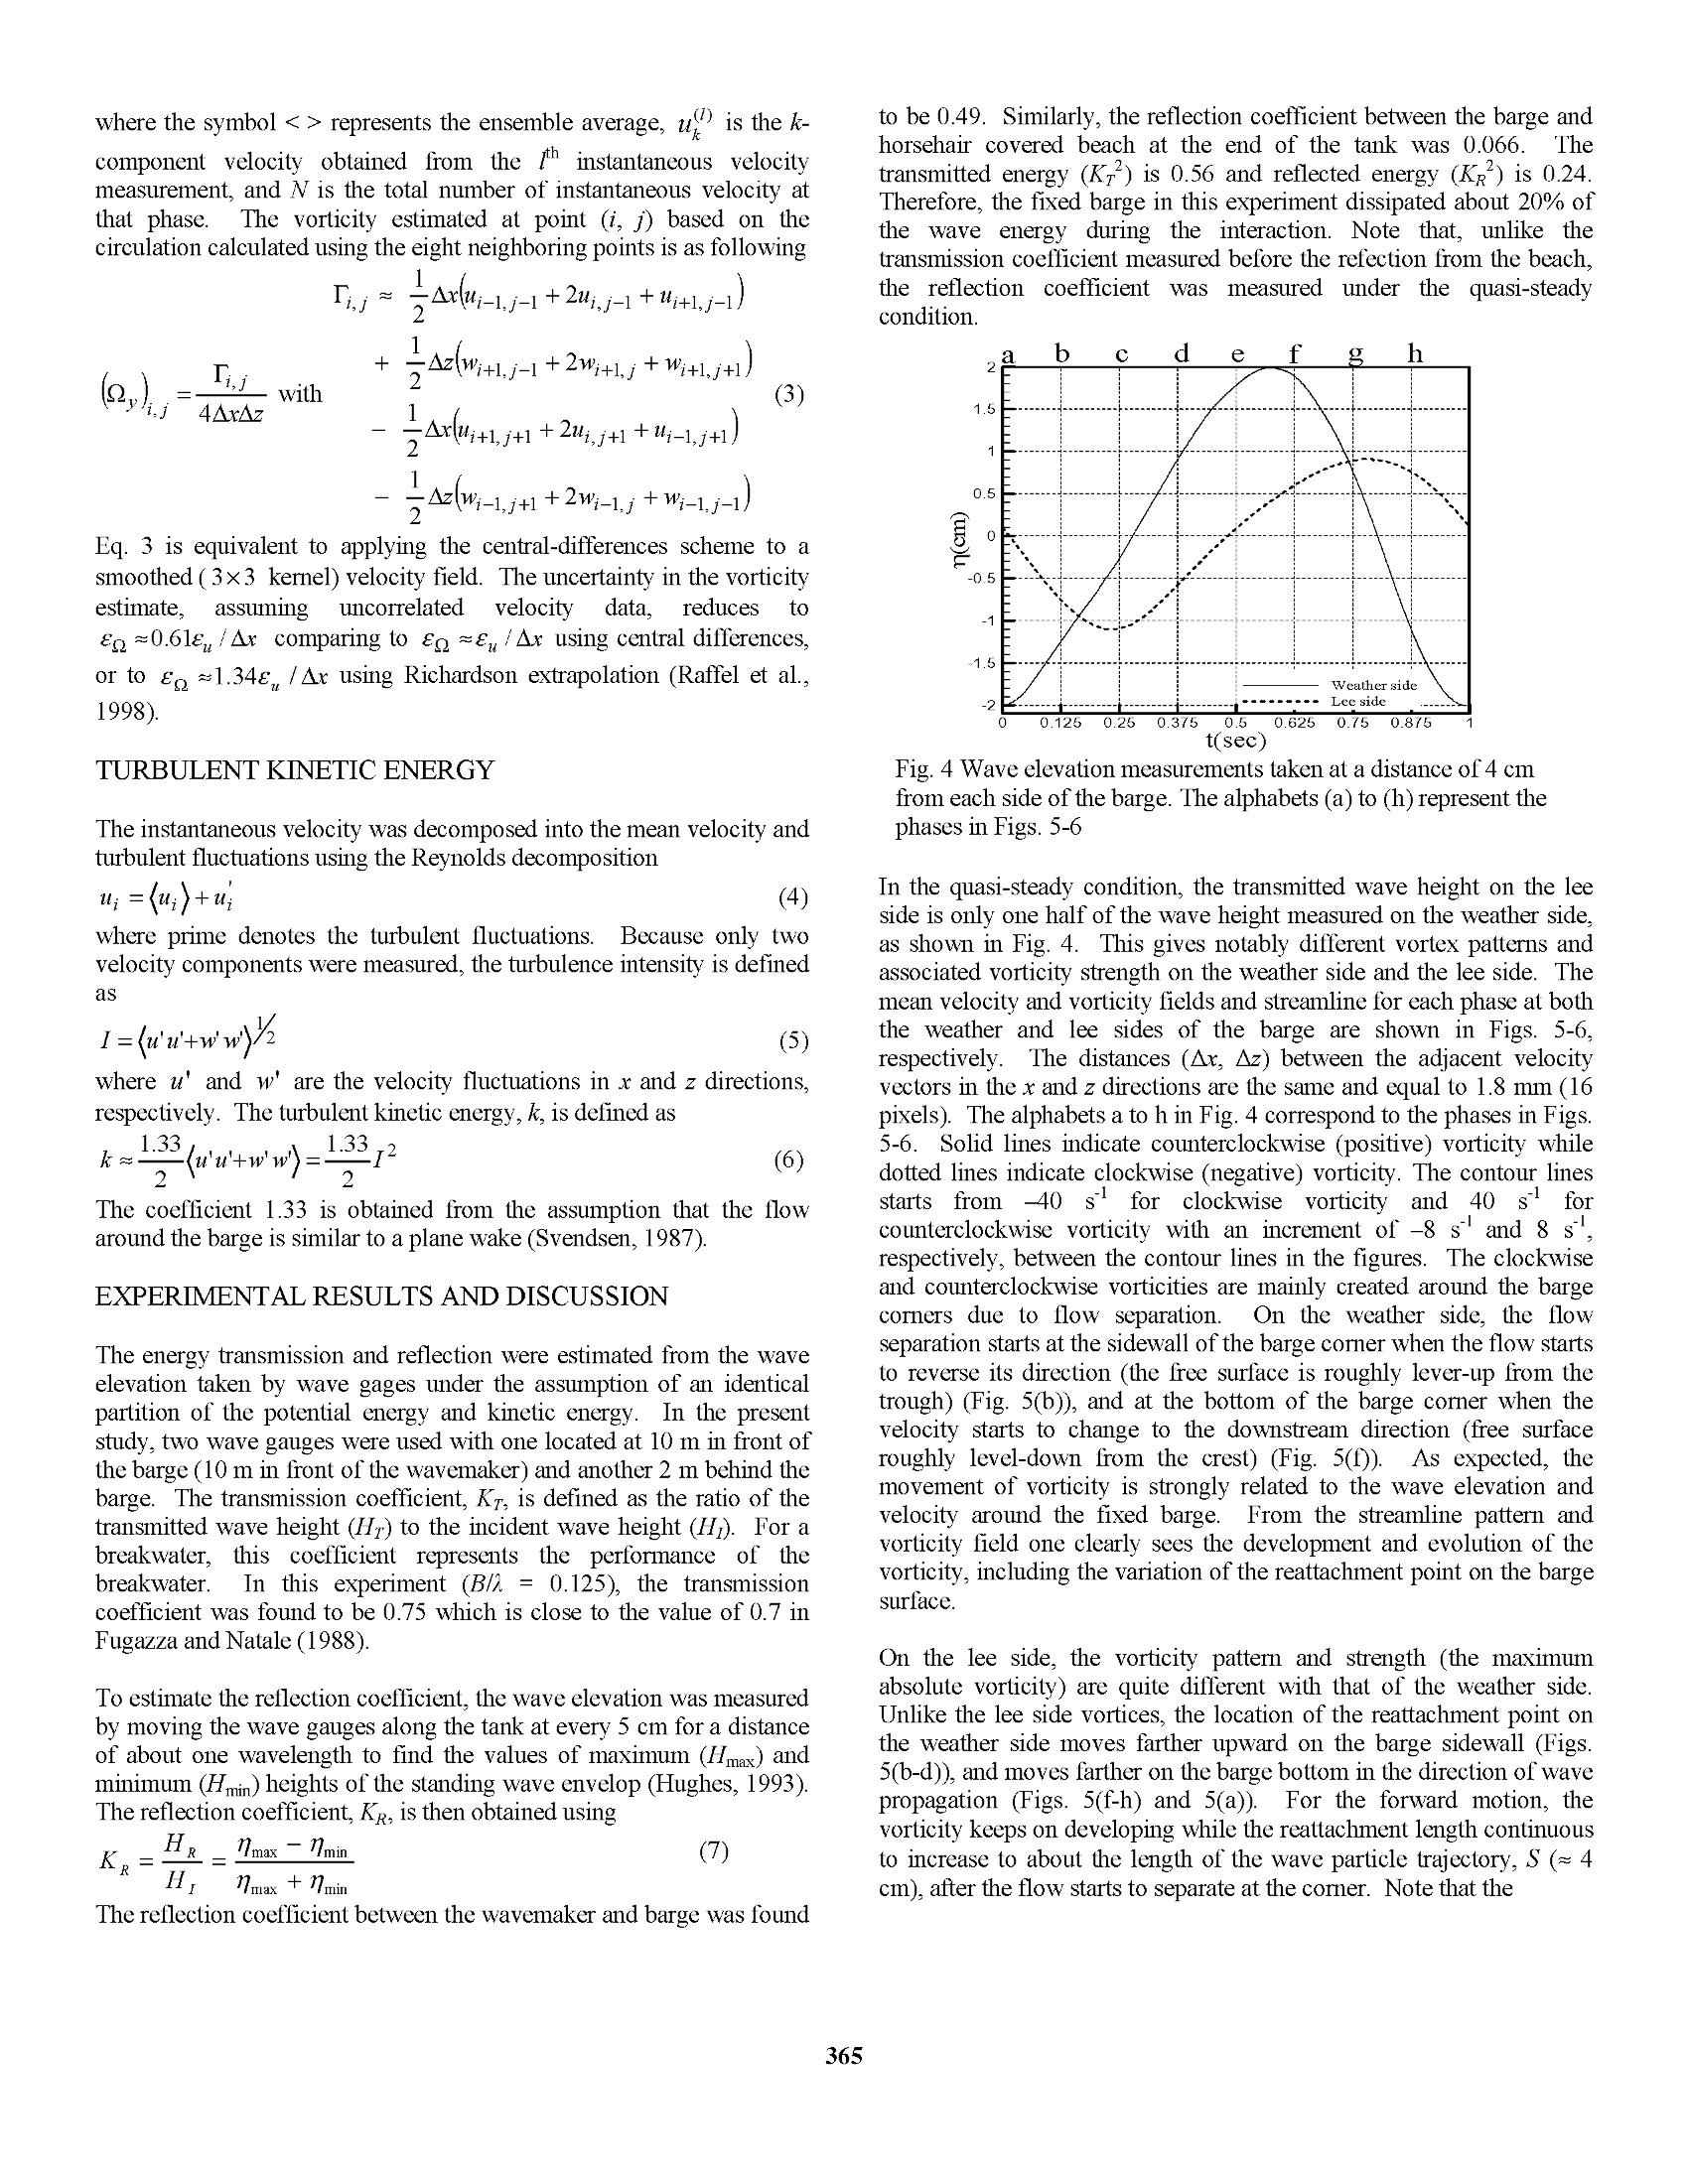
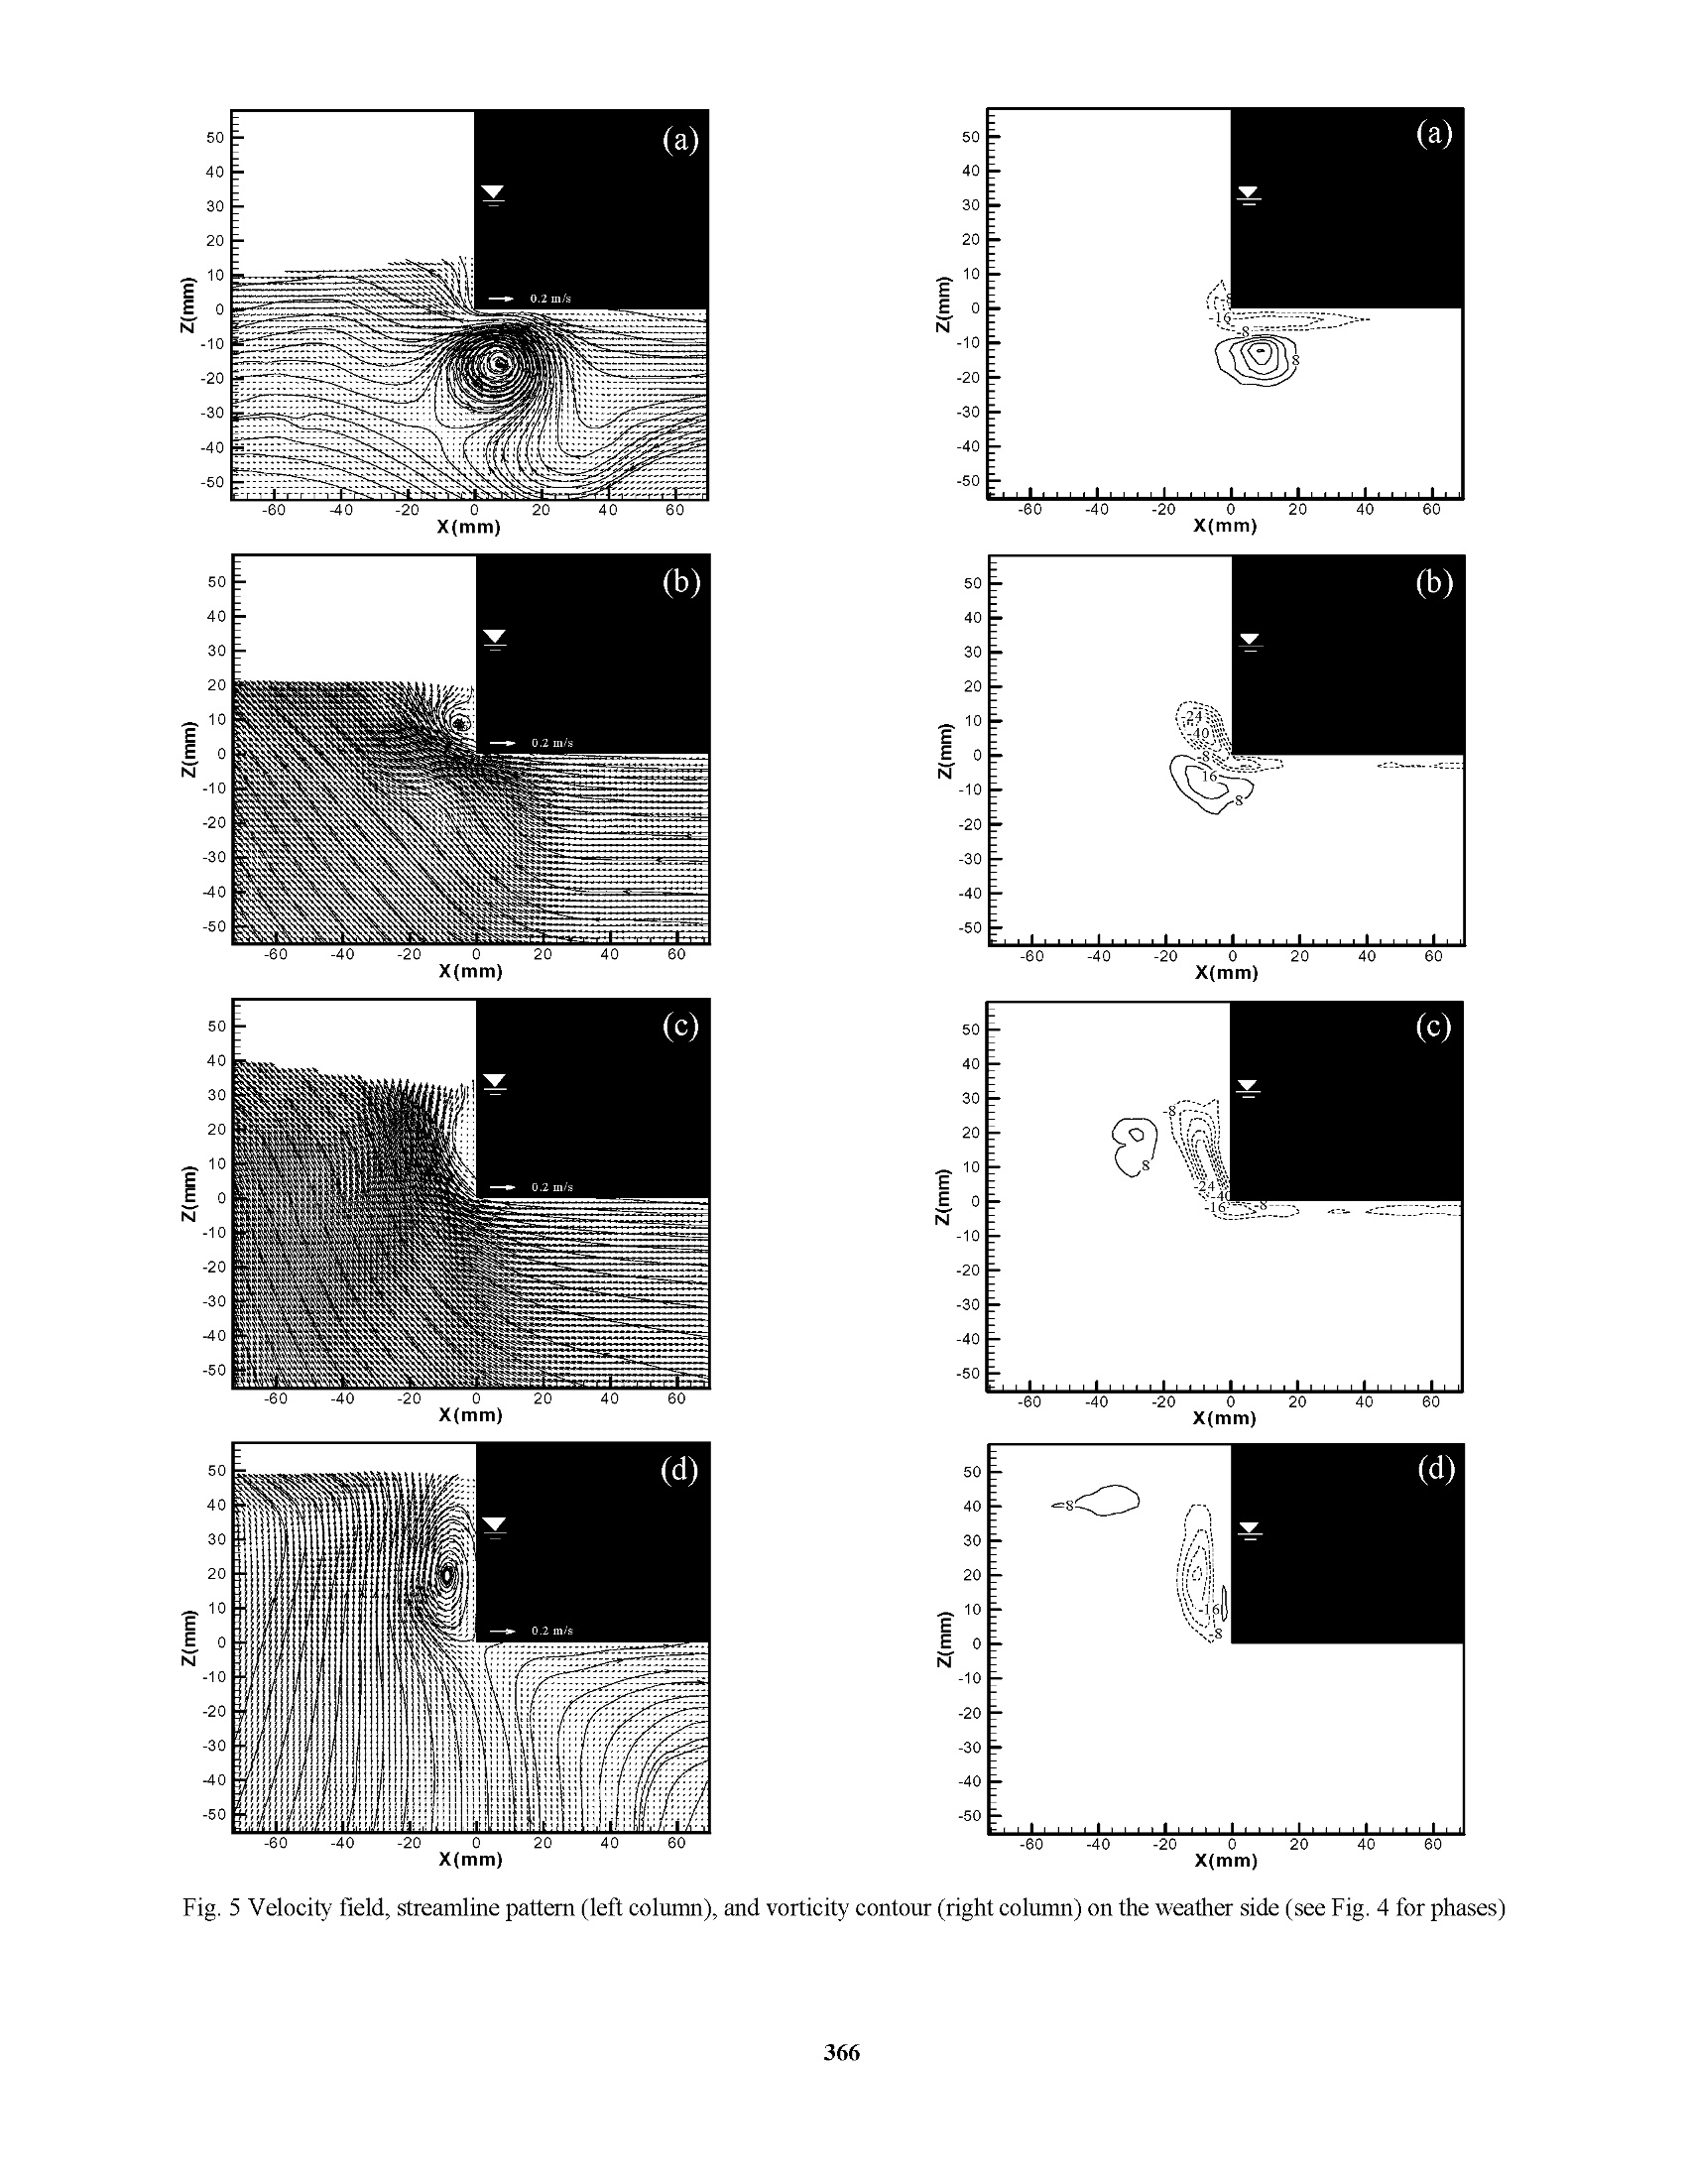
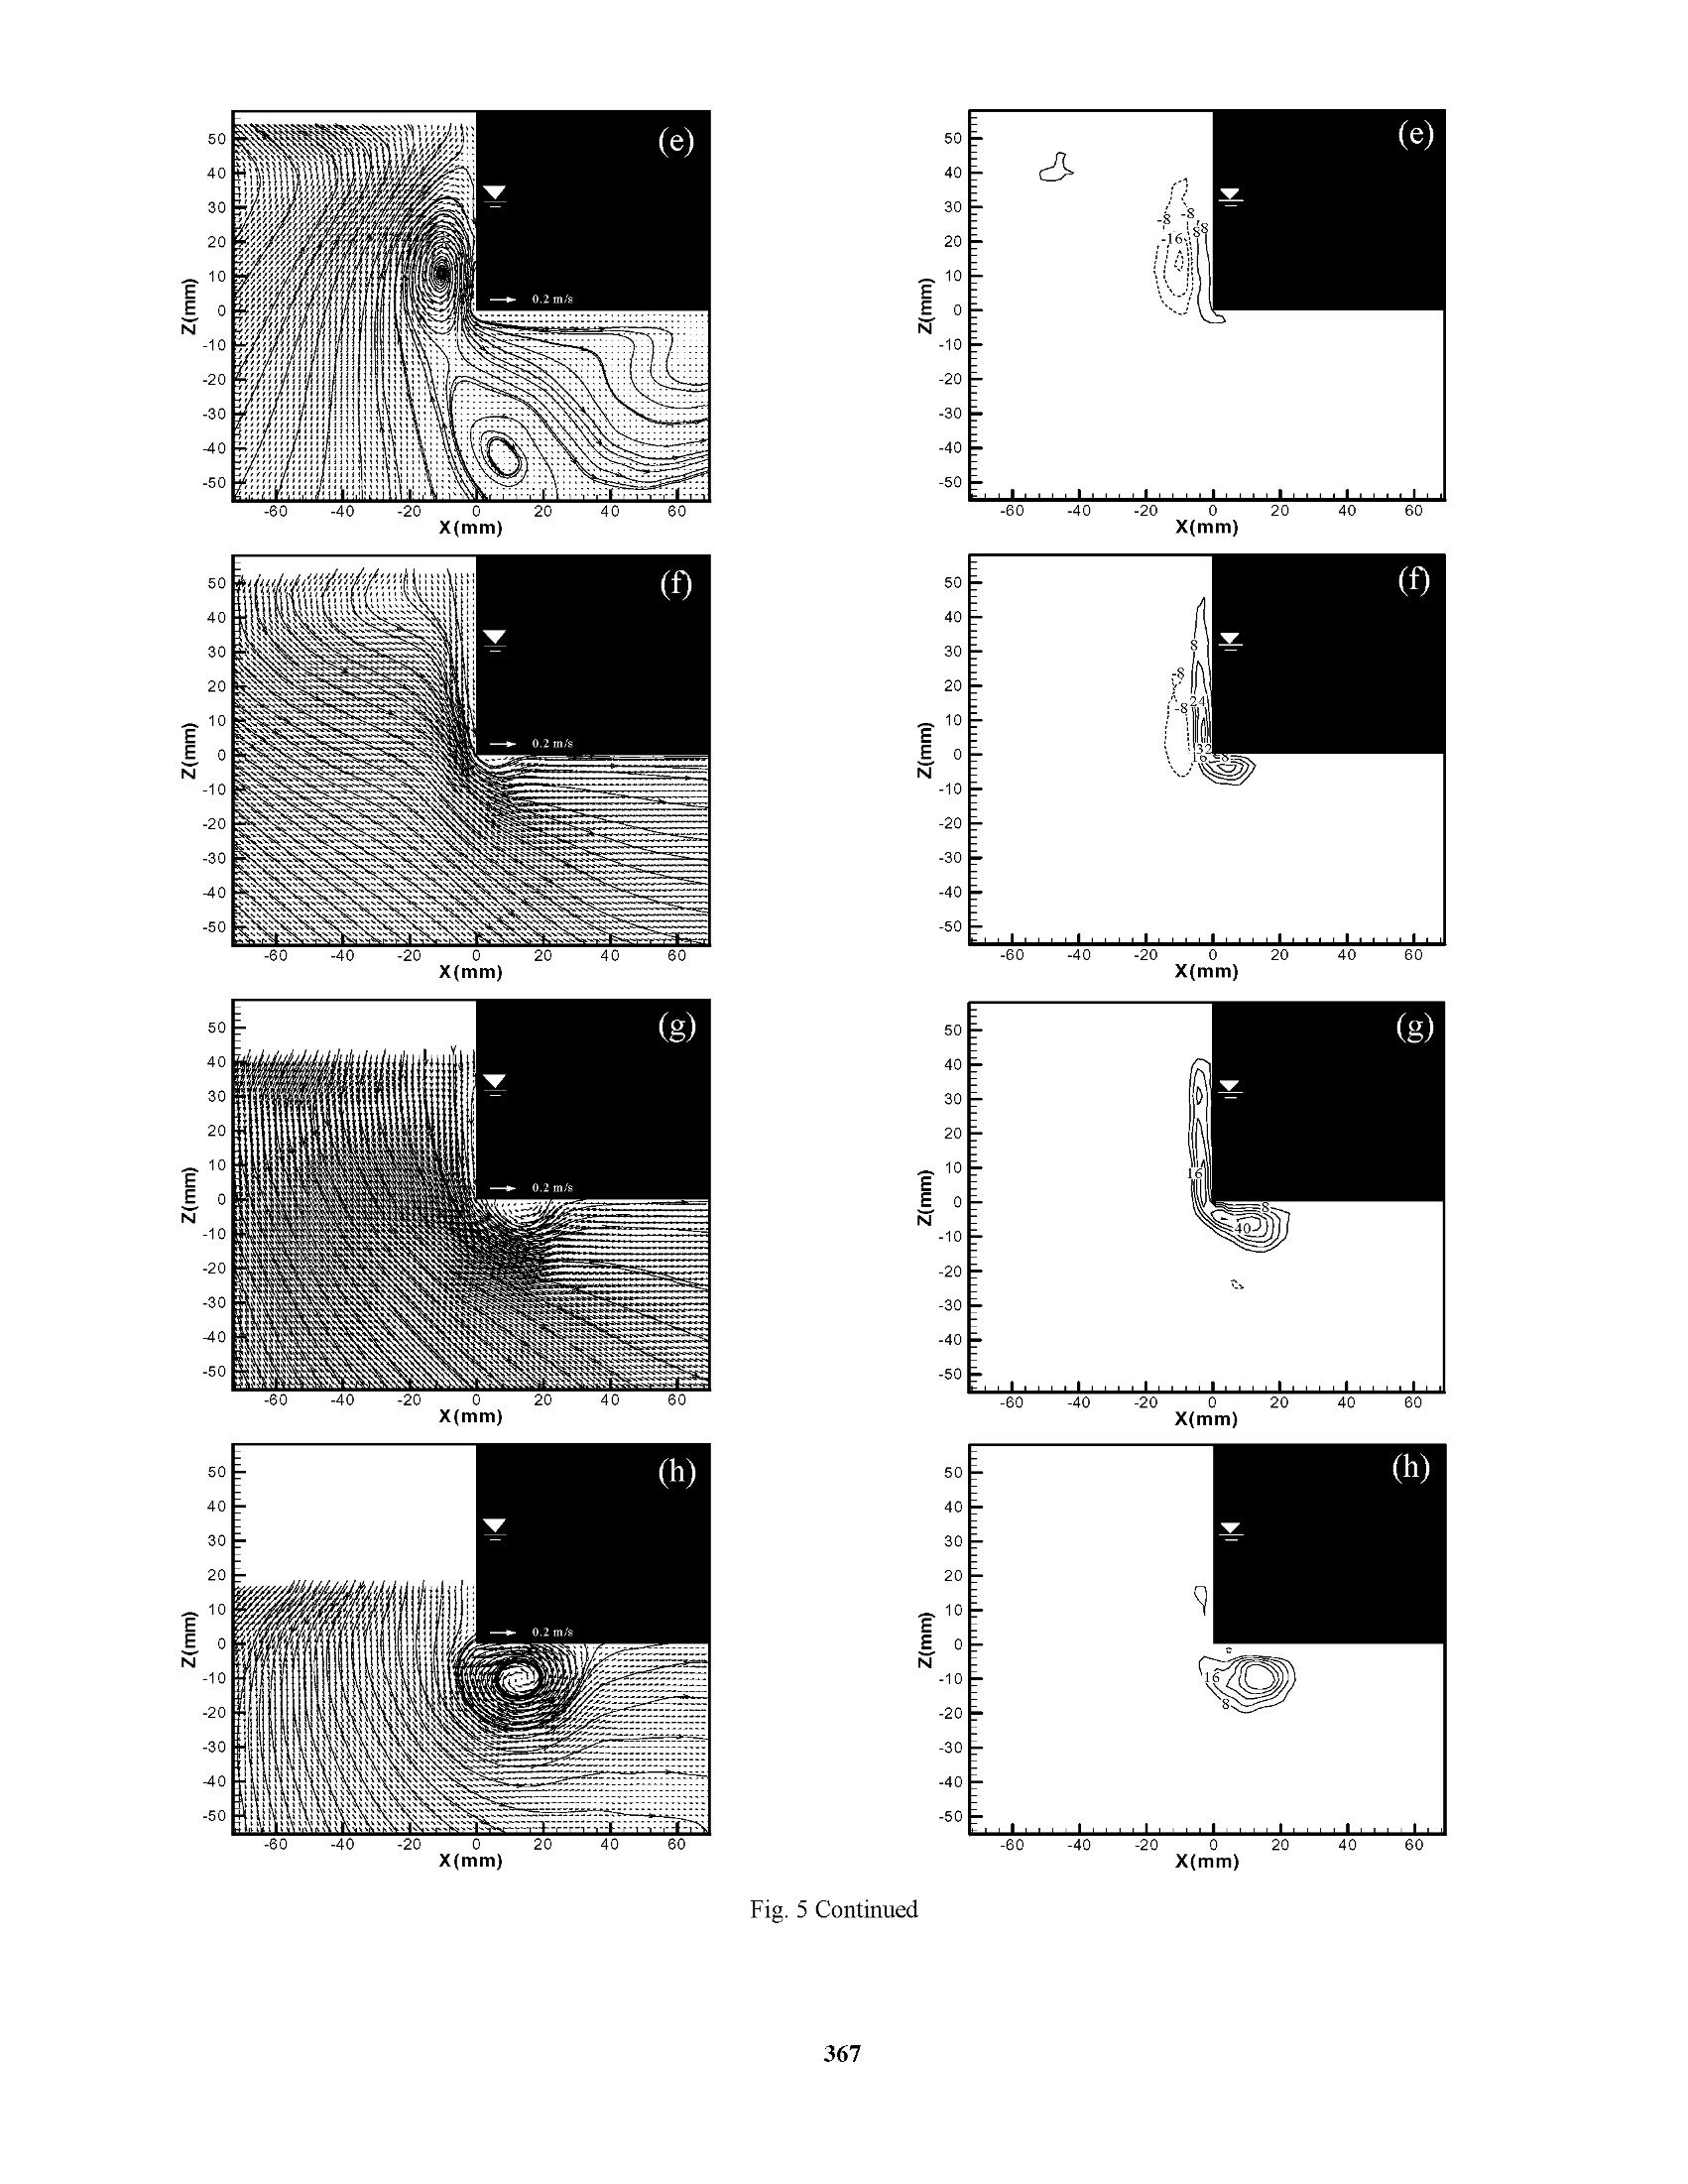
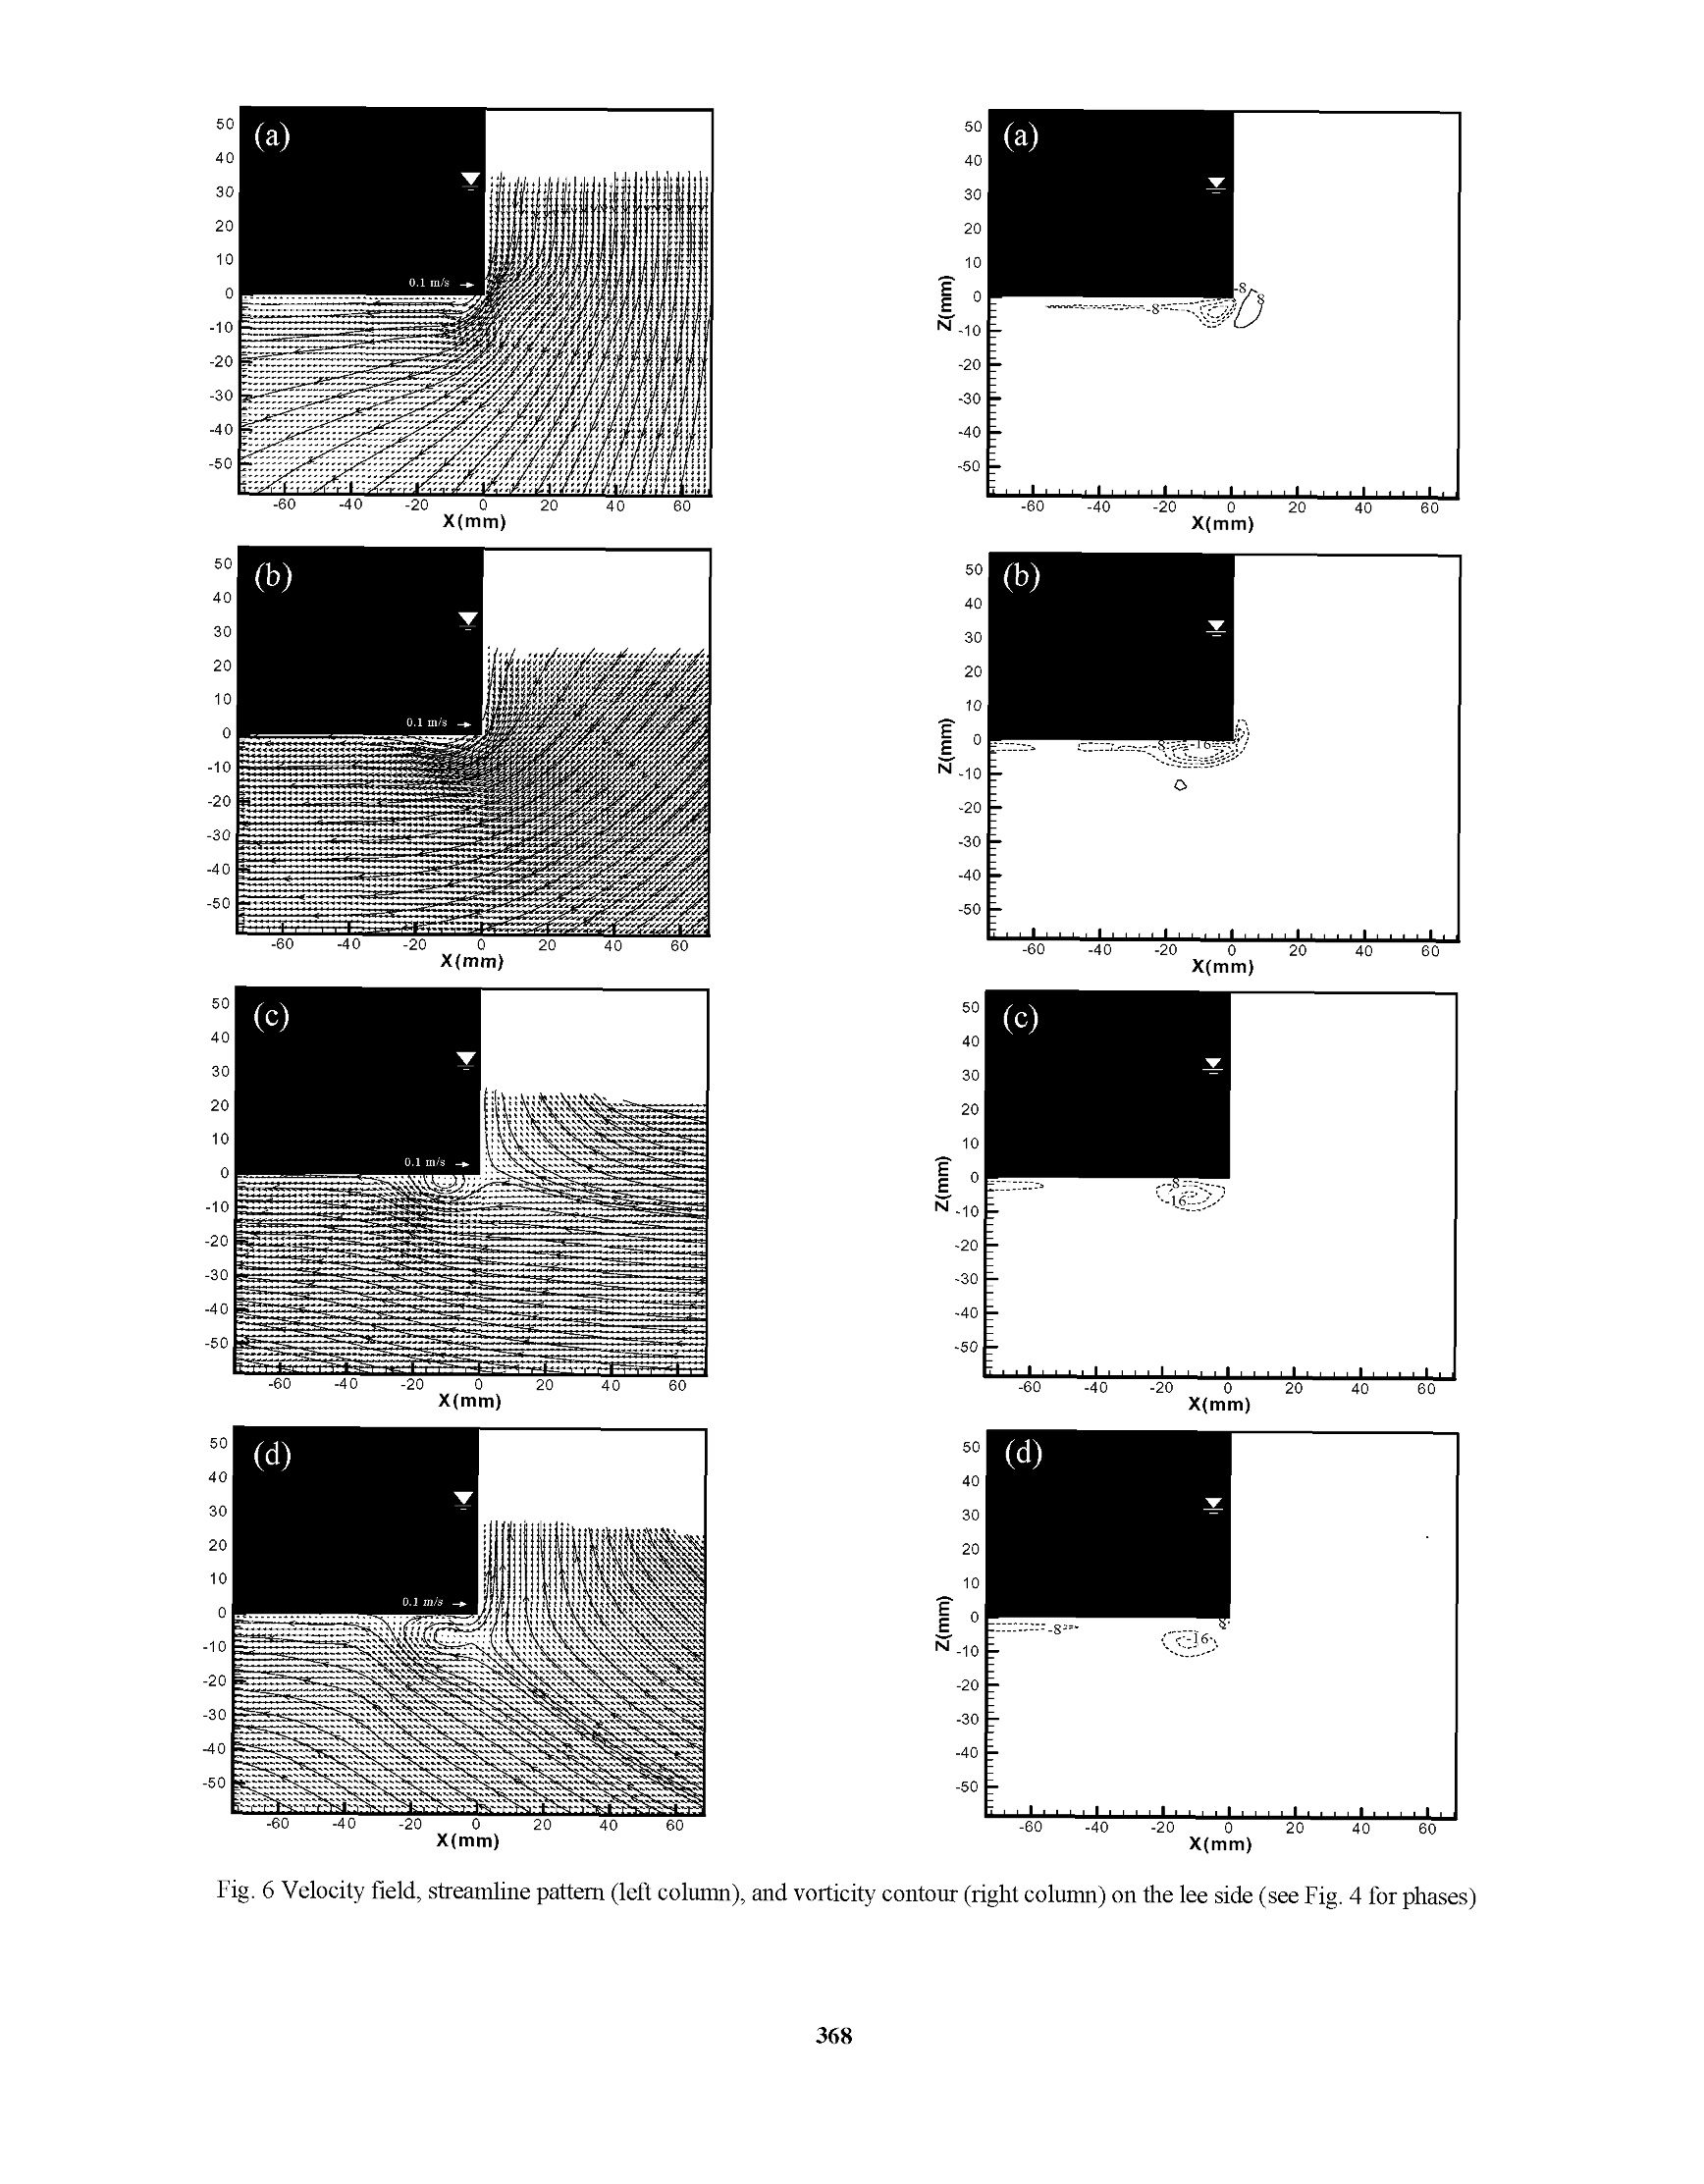
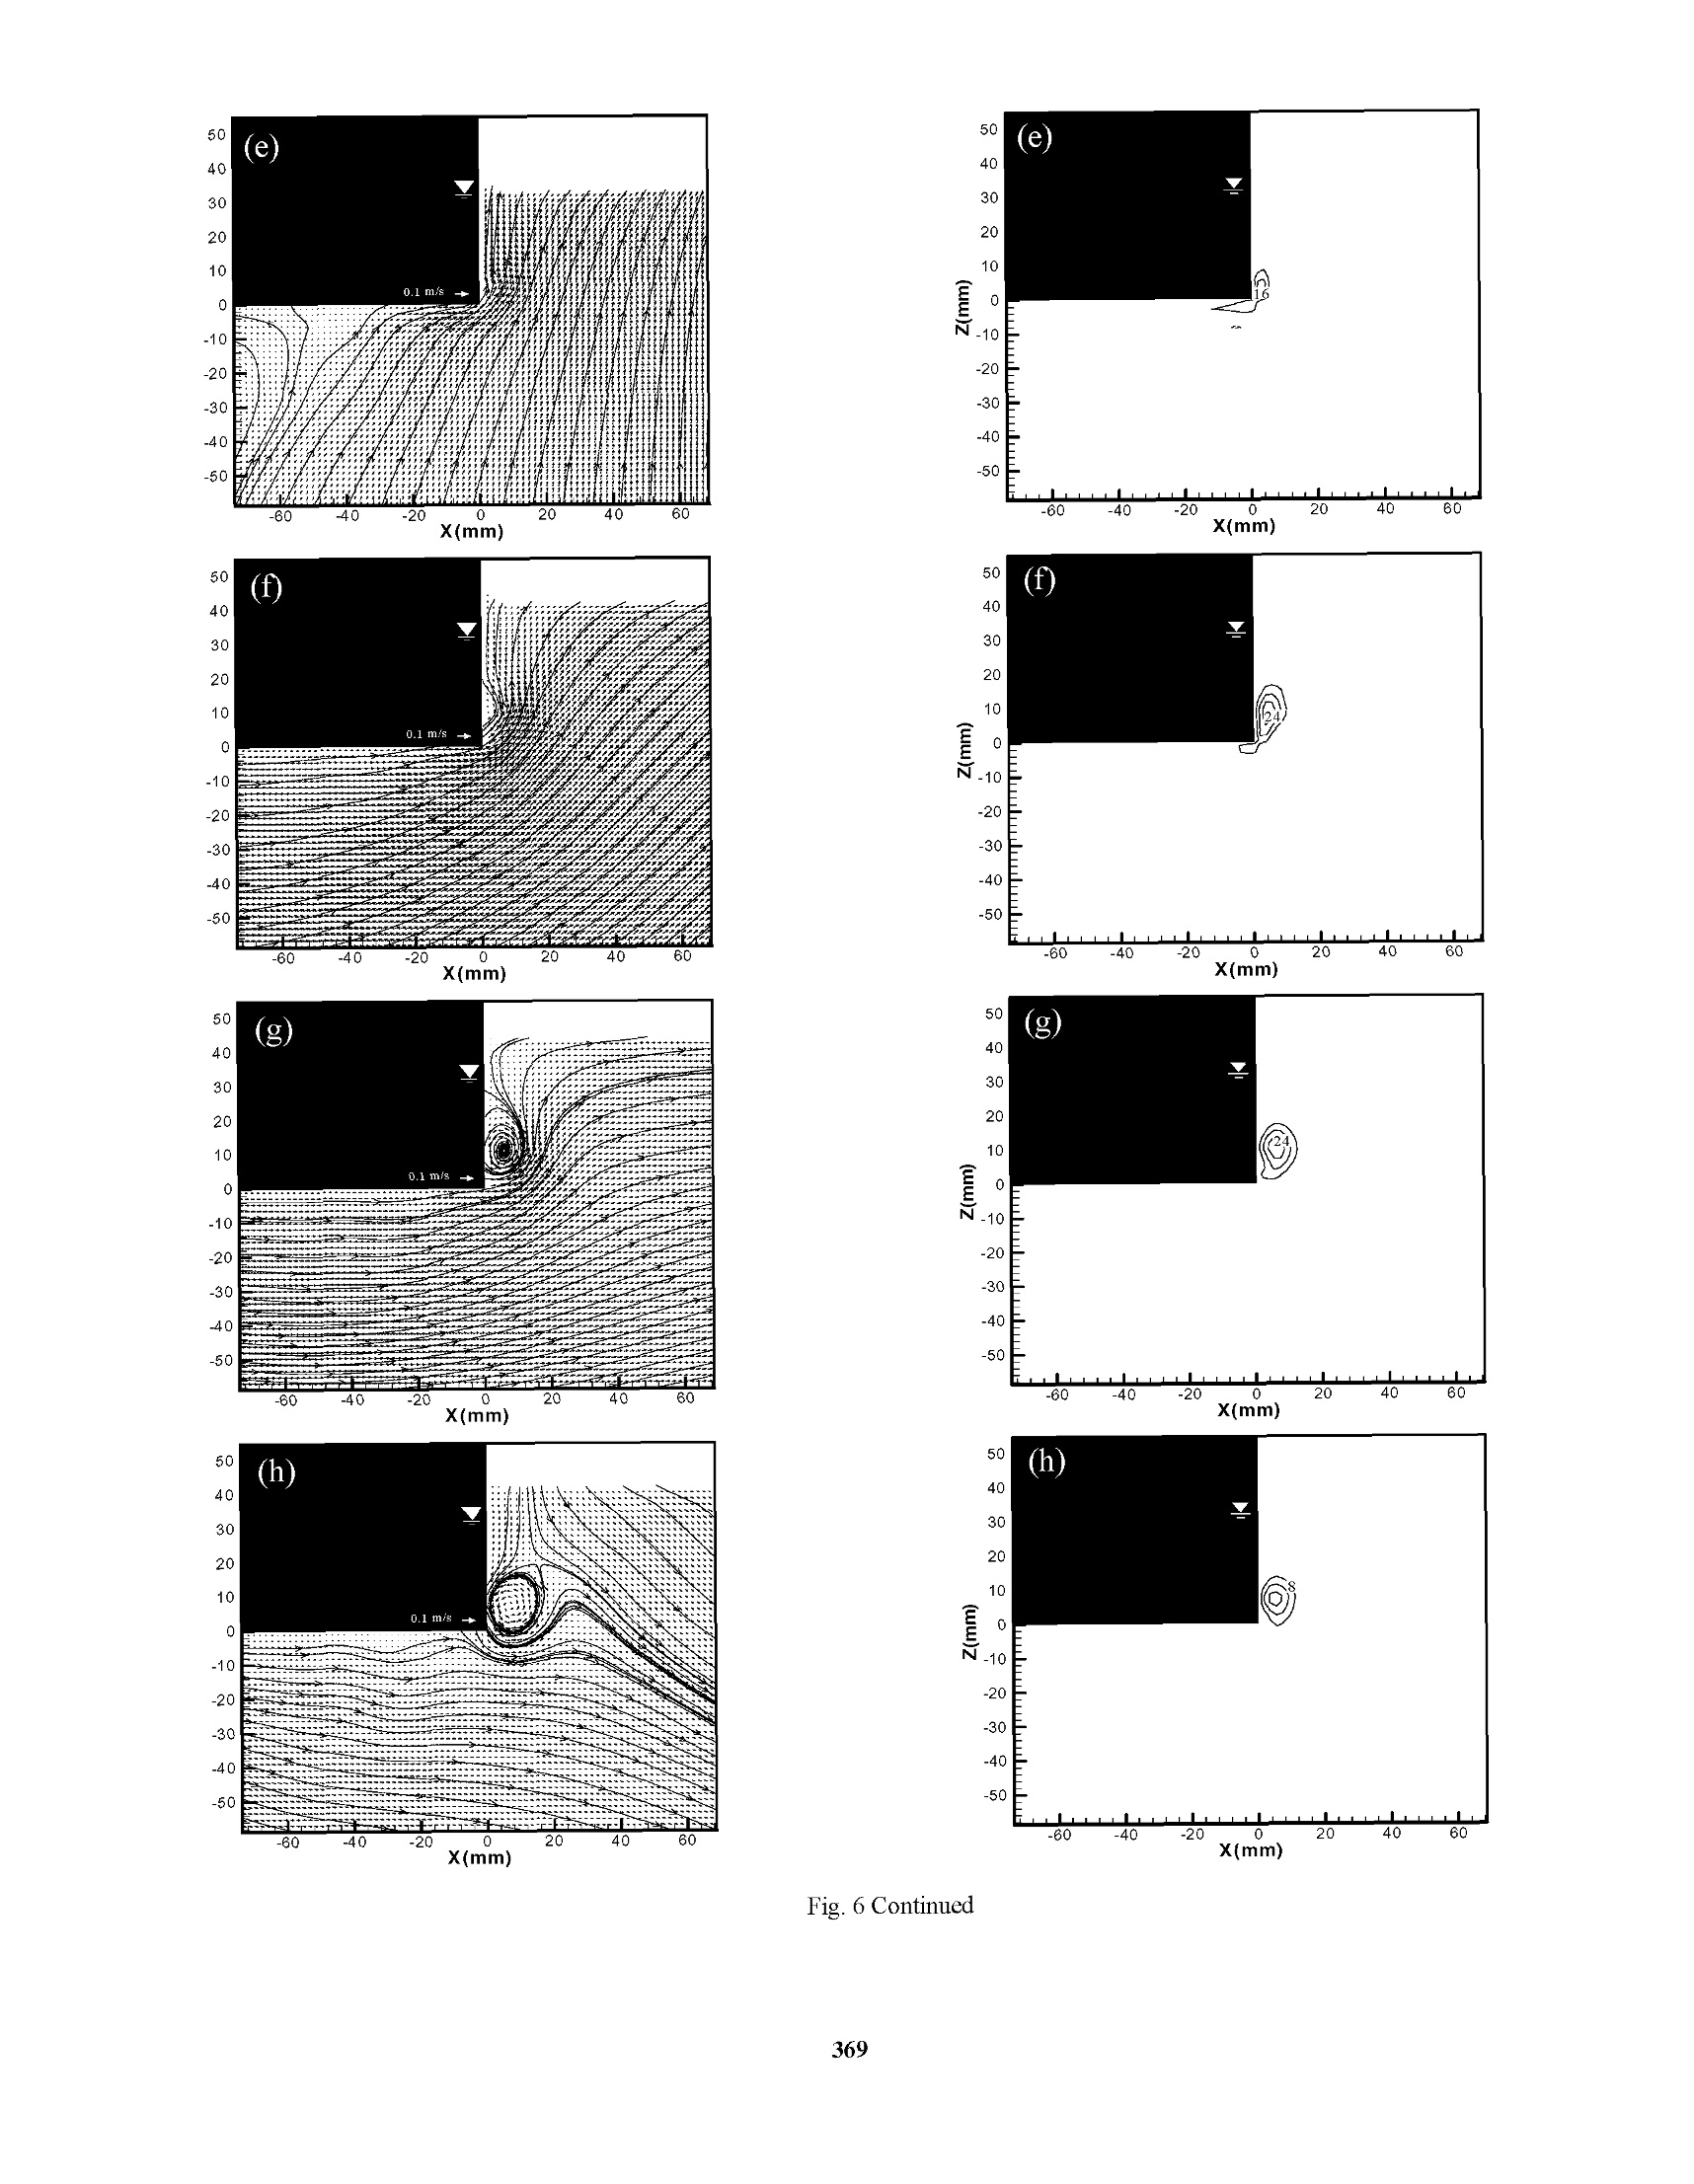
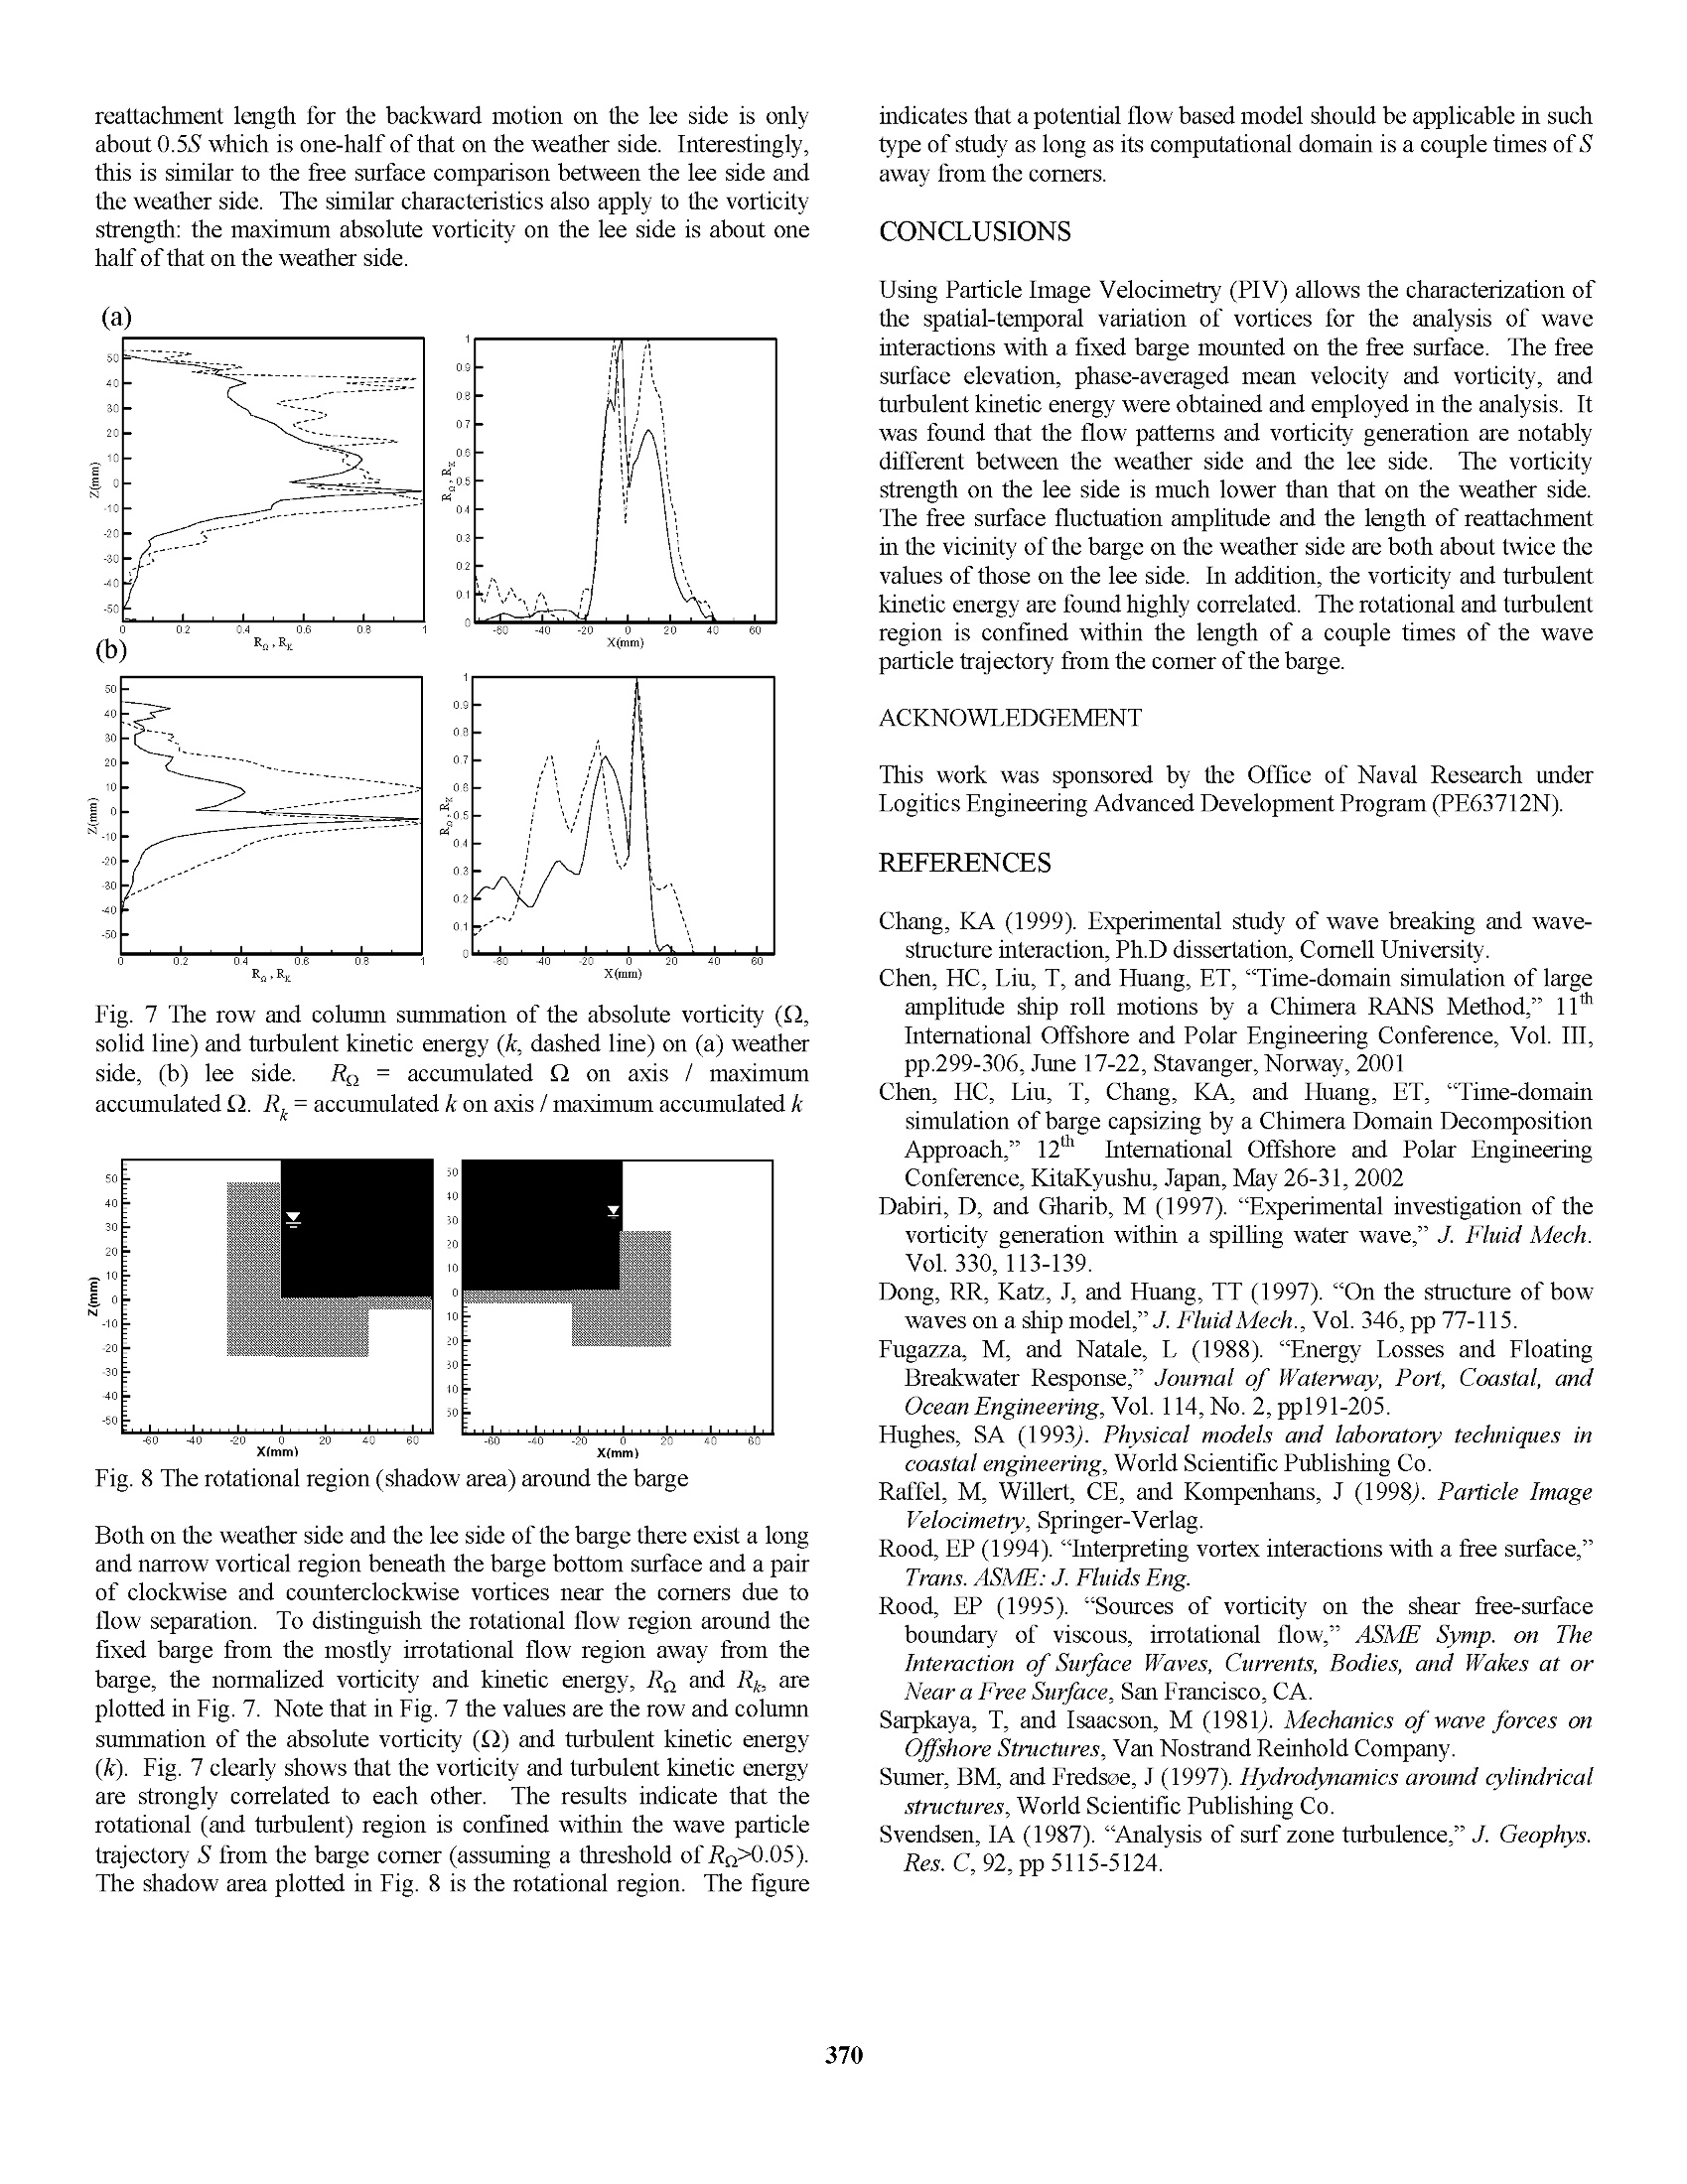
Proceedings of The Twelfth (2002) International Offshore and Polar Engineering ConferenceKitakyushu, Japan, May 26-31, 2002Copyright C 2002 by The International Society of Offshore and Polar EngineersISBN 1-880653-58-3 (Set); ISSN 1098-6189 (Set) Experimental Study on Wave Interactions with a Fixed Rectangular Barge in a Beam Sea Kwang Hyo Jung, Kuang-An Chang, and Hamn-Ching Chen Erick T. Huang Ocean Engineering Program, Department of Civil Engineering Naval Facilities Engineering Service Center ABSTRACT This paper presents an experimental study on wave interactions with arectangular barge in a beam sea condition. Regular waves with a waveperiod the same as the natural frequency of the barge were used in theexperiments due to the fact that the barge is prone to capsizing undersuch waves.The barge was fixed on the free surface and no waveovertopping was assumed. Particle Image Velocimetry (PIV) wasemployed to measure the full-field two-dimensional velocity. Since theflow is highly turbulent, the phase-averaging technique was used to theextract the mean flow and turbulence properties.The mean flowpattern, including velocity, vorticity, and streamline, was analyzed toquantify the mechanism of the interactions.The generation andevolution of vorticity and turbulence kinetic energy were demonstrated.The turbulent kinetic energy is found to highly correlate with thevorticity field KEY WORDS: Rectangular barge, particle image velocimetry;turbulence; water waves; ocean engineering INTRODUCTION Paiticle image Velocimetry (PIV) is anon-intrusive velocitymeasurement technique that allows one to acquire images from a flowand to extract the velocity information out of these images. Thetechniqueggenerally provides full field instantaneousspatialquantitative velocity information. The technique has been applied in avariety of fluid mechanics problems, including kinematics in the crestregion in the water wave study. It is known that a rectangular barge model is prone to capsize in a beamsea under regular waves with a wave period the same as the naturalperiod of the barge roll motion when the barge freely floats in a 2Dwave tank. The general trend to study ship motion forced by waves isto measure the corresponding motion of ship against incident waves.Measurements of detailed flow kinematics are rare. With the help ofPIV, the quantitative flow information and flow pattern as well as theship motion can all be captured. Therefore, PIV can play a role in theprediction of ship motion and the design for better stability.V.addition, throughspatialalvelocity measurement, computation vorticity is straightforward. This helps the understanding of vortexgeneration and evolution in the problem. Dong et al. (1997) studied theflow and wave structures near the bow of a ship model were studiedusing PIV. Moreover, the origination of vorticity within the wave andits relationship to the flow near the surface and shape of the wave wereaddressed by Rood (1994,1995) and Dabiri and Gharib (1997). On theother hand, Chen et al. (2001) developed a Reynolds-Averaged Navier-Stokes (RANS) numerical model to investigate the barge roll responsesunder large amplitude waves. Subsequently, Chen et al. (2002)simulated vortex structures and flow separation patterns when apontoon barge is partially submerged with the RANS method employedin conjunction with a domain decomposition approach. The purpose of this study is a preliminary investigation of the flowstructure around a fixed rectangular barge interacting with regularwaves.This is the first step in the study of interactions between thewaves and the rectangular barge motion for beT1tter understanding of thecapsizing mechanism.The present study can be extended to theanalysis of the flow characteristics in the vicinity of a floatingbreakwater. EXPERIMENTAL SET-UP AND CONDITION The experiments were performed in a glass walled wave tank that is 35m long, 0.9 m wide, and 1.2 m deep (see Fig.1). A 1:5.5 sloping beachis installed at the end of the tank. A layer of horsehair is placed on thebeach to absorb the wave energy and reduce the reflection. 35 unit: m The wavemaker is of dry back flap type. The flap is driven by asynchronous servo-motor controlled by a computer, and hydrostaticallybalanced using an automatic near constant force and a pneumaticcontrol system.Two double-wired resistant-type wave gauges wereused to measure the free surface elevation at 100 Hz. The signal fromthe wave gauges was converted to voltage and sent to a data acquisitionboard housed in a computer. The wave gauges were located at 4 cm infront and behind the barge to measure the wave elevation within thePIV field of views at both the weather side and lee side. The barge model was made of wood and built in the Froude numbersimilarity of a scale factor of 1/38.1, which is 0.9 m long (L), 0.2 mwide (B), and 0.064 m high (TB) with a 0.032 m draft (D) of one-half ofits height. The barge model was fixed at the position 20 m from thewavemaker. The wavemaker generated regular waves of 1.0 secondwave period (T) and 0.04 m wave height (H) at the 0.8 m water depth,giving a wave length (a) of 1.56m. The experiments were conductedclose to the deep-water condition of (h/a>0.5) and in the quasi-steady state, which was achieved after running the wavemaker forabout 15 minutes. The Reynolds number (Re) is believed to be the important parameterfor the generation and evolution of vortices in the wake around abottom mounted body in oscillatory flows (Chang,1999). It is definedas where Umax is the maximum water particle velocity, B is the bargewidth, and v is the kinematic viscosity. The present experiment has aReynolds number of 1.92×10. It is known that the flow pattern for asteady flow around a circular cylinder is not strongly dependent onReynolds number if Reynolds number is between 300 and 3×10(Sarpkaya and Isaacson, 1981; Sumer and Fredsoe, 1997). However,Reynolds number has significant influence on the vortex strength in theflow in the case of wave interactions with a rectangular obstacle fixedon the bottom (Chang,1999). It is expected that the similar effectapplies to the present study. PIV IMAGING TECHNIQUE Velocity measurements were performed using PIV and the PIV systemis shown in Fig. 2. Fig. 2 Schematic sketch of the experimental set-up Computer A: to control the wavemaker and trigger the PIV systemComputer B: to take data from wave gages Computer C: to control the laser and CCD camera The PIV illumination source is a ffrequency doubled dual-headNd:YAG laser. The laser has a maximum energy output of 400mJ/pulse in the 532 nm wavelength, a pulse duration of 10 ns, and a repetition rate of 10 Hz for each head so that 20 pulses are generatedper second. The light sheet optics is a combination of two sphericallenses and one cylindrical lens to generate a thin light sheet (about 1mm) from the 3-mm diameter laser beam. The camera is a digital CCDcamera with a 105mm f/1.8 micro lens set at f/2.8. The camera has a1280×1024 pixel resolution, 6.7 umx6.7 umpixel size, 12-bit dynamicrange, and 8 Hz maximum framing rate. The PIV system and the wavemaker were synchronized by computer Athat houses a data acquisition board and generates analog output DCvoltage (Fig. 2). The timing of laser pulses was synchronized with theCCD camera by computer B that houses another data acquisition boardfor analog output. The camera was operated at 4 Hz and 90 pairs ofimages were taken at each phase for eight different phases.S.Thedouble-frame/single-pulsedmethodwasusedfor PIV velocitycomputation. The time separation (At) between the 1st and 2d laserpulses was 3.0 ms to limit the maximum displacement to be less thanone-third of the width of the interrogation window (32x32 pixels).Two fields of view (FOV) were used to capture the vortex generationby the flow separation at each corner of barge. Fig. 3 shows the FOV.The interrogation window is of 32x32 pixels (3.6x3.6 mm’) with a 50%overlap between the adjacent windows. The size of the FOV is 14.2×11.3 cm at both the weather side and thelee side.The PIV seeding particle (Vestosint 2157) has a meandiameter of 57 um and a specific weight of 1.02. Fig. 3 The field of view The PIV velocity was computed using commercial software fromLaVision. In the process, the background noise was first subtractedbefore the evaluation.Fast Fourier transform was used for cross-correlation computation through two interrogation windows from a pairof images. The computation started initially with a large window sizeof 64x64 pixels and then reduced to a smaller size of 32×32 pixelsusing the result from the larger window for a better resolution. Oncethe velocity vectors were calculated, a median filter was applied toremove the spurious false vectors. The empty spaces were then filledwith interpolated vectors and smoothed using a 3×3 smoothing filter toreduce unrealistic changes in velocity. MEAN VELOCITY AND MEAN VORTICITY The velocity fields for the weather and lee sides of the fixed barge weretaken using PIV at the 8 different phases in the wave period. The fieldof view (FOV) was 14.2×11.3 cm, which gave a resolution of 0.11mm/pixel.1.The interrogation area was 32×32 pixels with a 50%overlap so the spatial resolution in velocity is about 1.8 mm. The mean velocity and turbulence intensity were obtained by phase-averaging 90 measurements at each of the eight different phases, i.e. where the symbol<> represents the ensemble average, uis the k-component velocity obtained from the thinstantaneous vvelocitymeasurement, and N is the total number of instantaneous velocity atthat phase. The vorticity estimated at point (i, j) based on thecirculation calculated using the eight neighboring points is as following Eq. 3 is equivalent to applying the central-differences scheme to asmoothed (3×3 kernel) velocity field. The uncertainty in the vorticityestimate.assuming uncorrelateddvelocity data, reduces toeq~0.61e, /Ax comparing to eg~e/Ax using central differencesor to e ~1.34e /Ax using Richardson extrapolation (Raffel et al.,1998). TURBULENT KINETIC ENERGY The instantaneous velocity was decomposed into the mean velocity andturbulent fluctuations using the Reynolds decomposition where prime denotes the turbulent fluctuations..Because only twovelocity components were measured, the turbulence intensity is definedas where u’ and w’ are the velocity fluctuations in x and z directions,respectively. The turbulent kinetic energy,k, is defined as The coefficient 1.33 is obtained from the assumption that the flowaround the barge is similar to a plane wake (Svendsen, 1987). EXPERIMENTAL RESULTS AND DISCUSSION The energy transmission and reflection were estimated from the waveelevation taken by wave gages under the assumption of an identicalpartition of the potential energy and kinetic energy. In the presentstudy, two wave gauges were used with one located at 10 m in front ofthe barge (10 m in front of the wavemaker) and another 2 m behind thebarge. The transmission coefficient, Kr, is defined as the ratio of thetransmitted wave height (Hr) to the incident wave height (H). For abreakwater, this coefficient represents the performance of thebreakwater..In this experiment (BI=0.125), the transmissioncoefficient was found to be 0.75 which is close to the value of 0.7 inFugazza and Natale (1988) To estimate the reflection coefficient, the wave elevation was measuredby moving the wave gauges along the tank at every 5 cm for a distanceof about one wavelength to find the values of maximum (Hmax) andminimum (Hmin) heights of the standing wave envelop (Hughes, 1993).The reflection coefficient, Kg, is then obtained using The reflection coefficient between the wavemaker and barge was found to be 0.49. Similarly, the reflection coefficient between the barge andhorsehair covered beach at the end of the tank was 0.066.Thetransmitted energy (Kr) is 0.56 and reflected energy (KR) is 0.24.Therefore, the fixed barge in this experiment dissipated about 20% ofthe wave energy during the interaction. Note that, unlike thetransmission coefficient measured before the refection from the beach.the reflection coefficientitwasmeasured under the quasi-steadycondition. Fig. 4 Wave elevation measurements taken at a distance of 4 cmfrom each side of the barge. The alphabets (a) to (h) represent thephases in Figs. 5-6 In the quasi-steady condition, the transmitted wave height on the leeside is only one half of the wave height measured on the weather side,as shown in Fig. 4. This gives notably different vortex patterns andassociated vorticity strength on the weather side and the lee side. Themean velocity and vorticity fields and streamline for each phase at boththe weather and lee sides of the barge are shown in Figs. 5-6,respectively.. The distances (Ax, Az) between the adjacent velocityvectors in the x and z directions are the same and equal to 1.8 mm (16pixels). The alphabets a to h in Fig. 4 correspond to the phases in Figs.5-6. Solid lines indicate counterclockwise (positive) vorticity whiledotted lines indicate clockwise (negative) vorticity. The contour linesstartsfrom -40 sforclockwiseevorticity and40s-1forcounterclockwise vorticity with an increment of -8 s and 8 s,respectively, between the contour lines in the figures. The clockwiseand counterclockwise vorticities are mainly created around the bargecorners due to flow separation.On the weather side, the flowseparation starts at the sidewall of the barge comer when the flow startsto reverse its direction (the free surface is roughly lever-up from thetrough) (Fig. 5(b)), and at the bottom of the barge corner when thevelocity starts to change to the downstream direction (free surfaceroughly level-down from the crest) (Fig. 5(f)).AAs expected, themovement of vorticity is strongly related to the wave elevation andvelocity around the fixed barge. From the streamline pattern andvorticity field one clearly sees the development and evolution of thevorticity, including the variation of the reattachment point on the bargesurface. On the lee side, the vorticity pattern and strength (the maximumabsolute vorticity) are quite different with that of the weather side.Unlike the lee side vortices, the location of the reattachment point onthe weather side moves farther upward on the barge sidewall (Figs.5(b-d)), and moves farther on the barge bottom in the direction of wavepropagation (Figs. 5(f-h) and 5(a)).For the forward motion, thevorticity keeps on developing while the reattachment length continuousto increase to about the length of the wave particle trajectory, S (~ 4cm), after the flow starts to separate at the corner. Note that the 50 (b) 40 30 20 10 -10 -20 -30 -40 -50 -60 -40 -20 20 40 X(mm) 50 (C) 40E 30 20 EEN 10 0 -16 ---- -110 -20 -30 -40 E -50 -20 40 -60 X(mm) Fig. 5 Velocity field, streamline pattern (left column), and vorticity contour (right column) on the weather side (see Fig. 4 for phases) (f) 卡 E 50 X(mm) X(mm) X(mm) X(mm) 营 -60 -40 -20 20 40 60X(mm) X(mm) X(mm) reattachment length for the backward motion on the lee side is onlyabout 0.5S which is one-half of that on the weather side. Interestingly,this is similar to the free surface comparison between the lee side andthe weather side. The similar characteristics also apply to the vorticitystrength: the maximum absolute vorticity on the lee side is about onehalf of that on the weather side. (a) Fig. 7 The row and column summation of the absolute vorticity (Q,solid line) and turbulent kinetic energy (k, dashed line) on (a) weatherside, (b) lee side. Re=accumulated on axis / maximumaccumulated Q. R.=accumulated k on axis / maximum accumulated k Fig. 8 The rotational region (shadow area) around the barge Both on the weather side and the lee side of the barge there exist a longand narrow vortical region beneath the barge bottom surface and a pairof clockwise and counterclockwise vortices near the corners due toflow separation. To distinguish the rotational flow region around thefixed barge from the mostly irrotational flow region away from thebarge, the normalized vorticity and kinetic energy, Ro and Ri, areplotted in Fig. 7. Note that in Fig. 7 the values are the row and columnsummation of the absolute vorticity (Q) and turbulent kinetic energy(k). Fig. 7 clearly shows that the vorticity and turbulent kinetic energyare strongly correlated to each other. The results indicate that therotational (and turbulent) region is confined within the wave particletrajectory S from the barge comer (assuming a threshold of Rg>0.05).The shadow area plotted in Fig. 8 is the rotational region. The figure indicates that a potential flow based model should be applicable in suchtype of study as long as its computational domain is a couple times of Saway from the corners. CONCLUSIONS Using Particle Image Velocimetry (PIV) allows the characterization ofthe spatial-temporal variation of vortices for the analysis of waveinteractions with a fixed barge mounted on the free surface. The freesurface elevation, phase-averaged mean velocity and vorticity, andturbulent kinetic energy were obtained and employed in the analysis. Itwas found that the flow patterns and vorticity generation are notablydifferent between the weather side and the lee side.The vorticitystrength on the lee side is much lower than that on the weather side.The free surface fluctuation amplitude and the length of reattachmentin the vicinity of the barge on the weather side are both about twice thevalues of those on the lee side. In addition, the vorticity and turbulentkinetic energy are found highly correlated. The rotational and turbulentregion is confined within the length of a couple times of the waveparticle trajectory from the corner of the barge. ACKNOWLEDGEMENT This work was sponsored by the Office of Naval Research underLogitics Engineering Advanced Development Program (PE63712N). REFERENCES Chang, KA (1999). Experimental study of wave breaking and wave-structure interaction, Ph.D dissertation,Cornell University. Chen, HC, Liu, T, and Huang, ET,“Time-domain simulation of largeamplitude ship roll motions by a Chimera RANS Method,”11"International Offshore and Polar Engineering Conference, Vol. III,pp.299-306, June 17-22, Stavanger, Norway, 2001 Chen, HC, Liu, T, Chang, KA, and Huang, ET, “Time-domainsimulation of barge capsizing by a Chimera Domain DecompositionApproach,”12 International Offshore and Polar EngineeringConference, KitaKyushu, Japan, May 26-31,2002 Dabiri, D, and Gharib, M (1997).“Experimental investigation of thevorticity generation within a spilling water wave,”J. Fluid Mech.Vol. 330.113-139. Dong, RR, Katz, J, and Huang, TT (1997).“On the structure of bowwaves on a ship model,”J. Fluid Mech., Vol. 346, pp77-115. Fugazza, M, and Natale, L(1988).“Energy Losses and FloatingBreakwater Response,” Journal of Waterway, Port, Coastal, andOcean Engineering, Vol. 114,No.2,pp191-205. Hughes, SA (1993). Physical models and laboratory techniques incoastal engineering, World Scientific Publishing Co. Raffel, M, Willert, CE, and Kompenhans, J (1998). Particle ImageVelocimetry, Springer-Verlag. Rood, EP (1994). “Interpreting vortex interactions with a free surface,"Trans.ASME:J. Fluids Eng. Rood, EP (1995). “Sources of vorticity on the shear free-surfaceboundary of viscous, irrotational flow,” ASME Symp. on TheInteraction of Surface Waves, Currents, Bodies, and Wakes at orNear a Free Surface, San Francisco, CA. Sarpkaya, T, and Isaacson, M (1981). Mechanics of wave forces onOffshore Structures, Van Nostrand Reinhold Company. Sumer, BM, and Fredsoe, J (1997). Hydrodynamics around cylindricalstructures, World Scientific Publishing Co. Svendsen, IA (1987).“Analysis of surf zone turbulence,”J. Geophys.Res. C, 92, pp 5115-5124.
确定
还剩6页未读,是否继续阅读?

产品配置单

北京欧兰科技发展有限公司为您提供《流体中速度场检测方案(粒子图像测速)》,该方案主要用于船舶中速度场检测,参考标准--,《流体中速度场检测方案(粒子图像测速)》用到的仪器有德国LaVision PIV/PLIF粒子成像测速场仪、Imager SX PIV相机
相关方案
更多
该厂商其他方案
更多