


方案详情
文
采德国LaVision公司的两相机2D3C立体PIV测量系统和集成一体化的4台相机构成的MiniShaker测试系统,对水下导管螺旋桨尾流流场进行了测量和理论分析。
方案详情

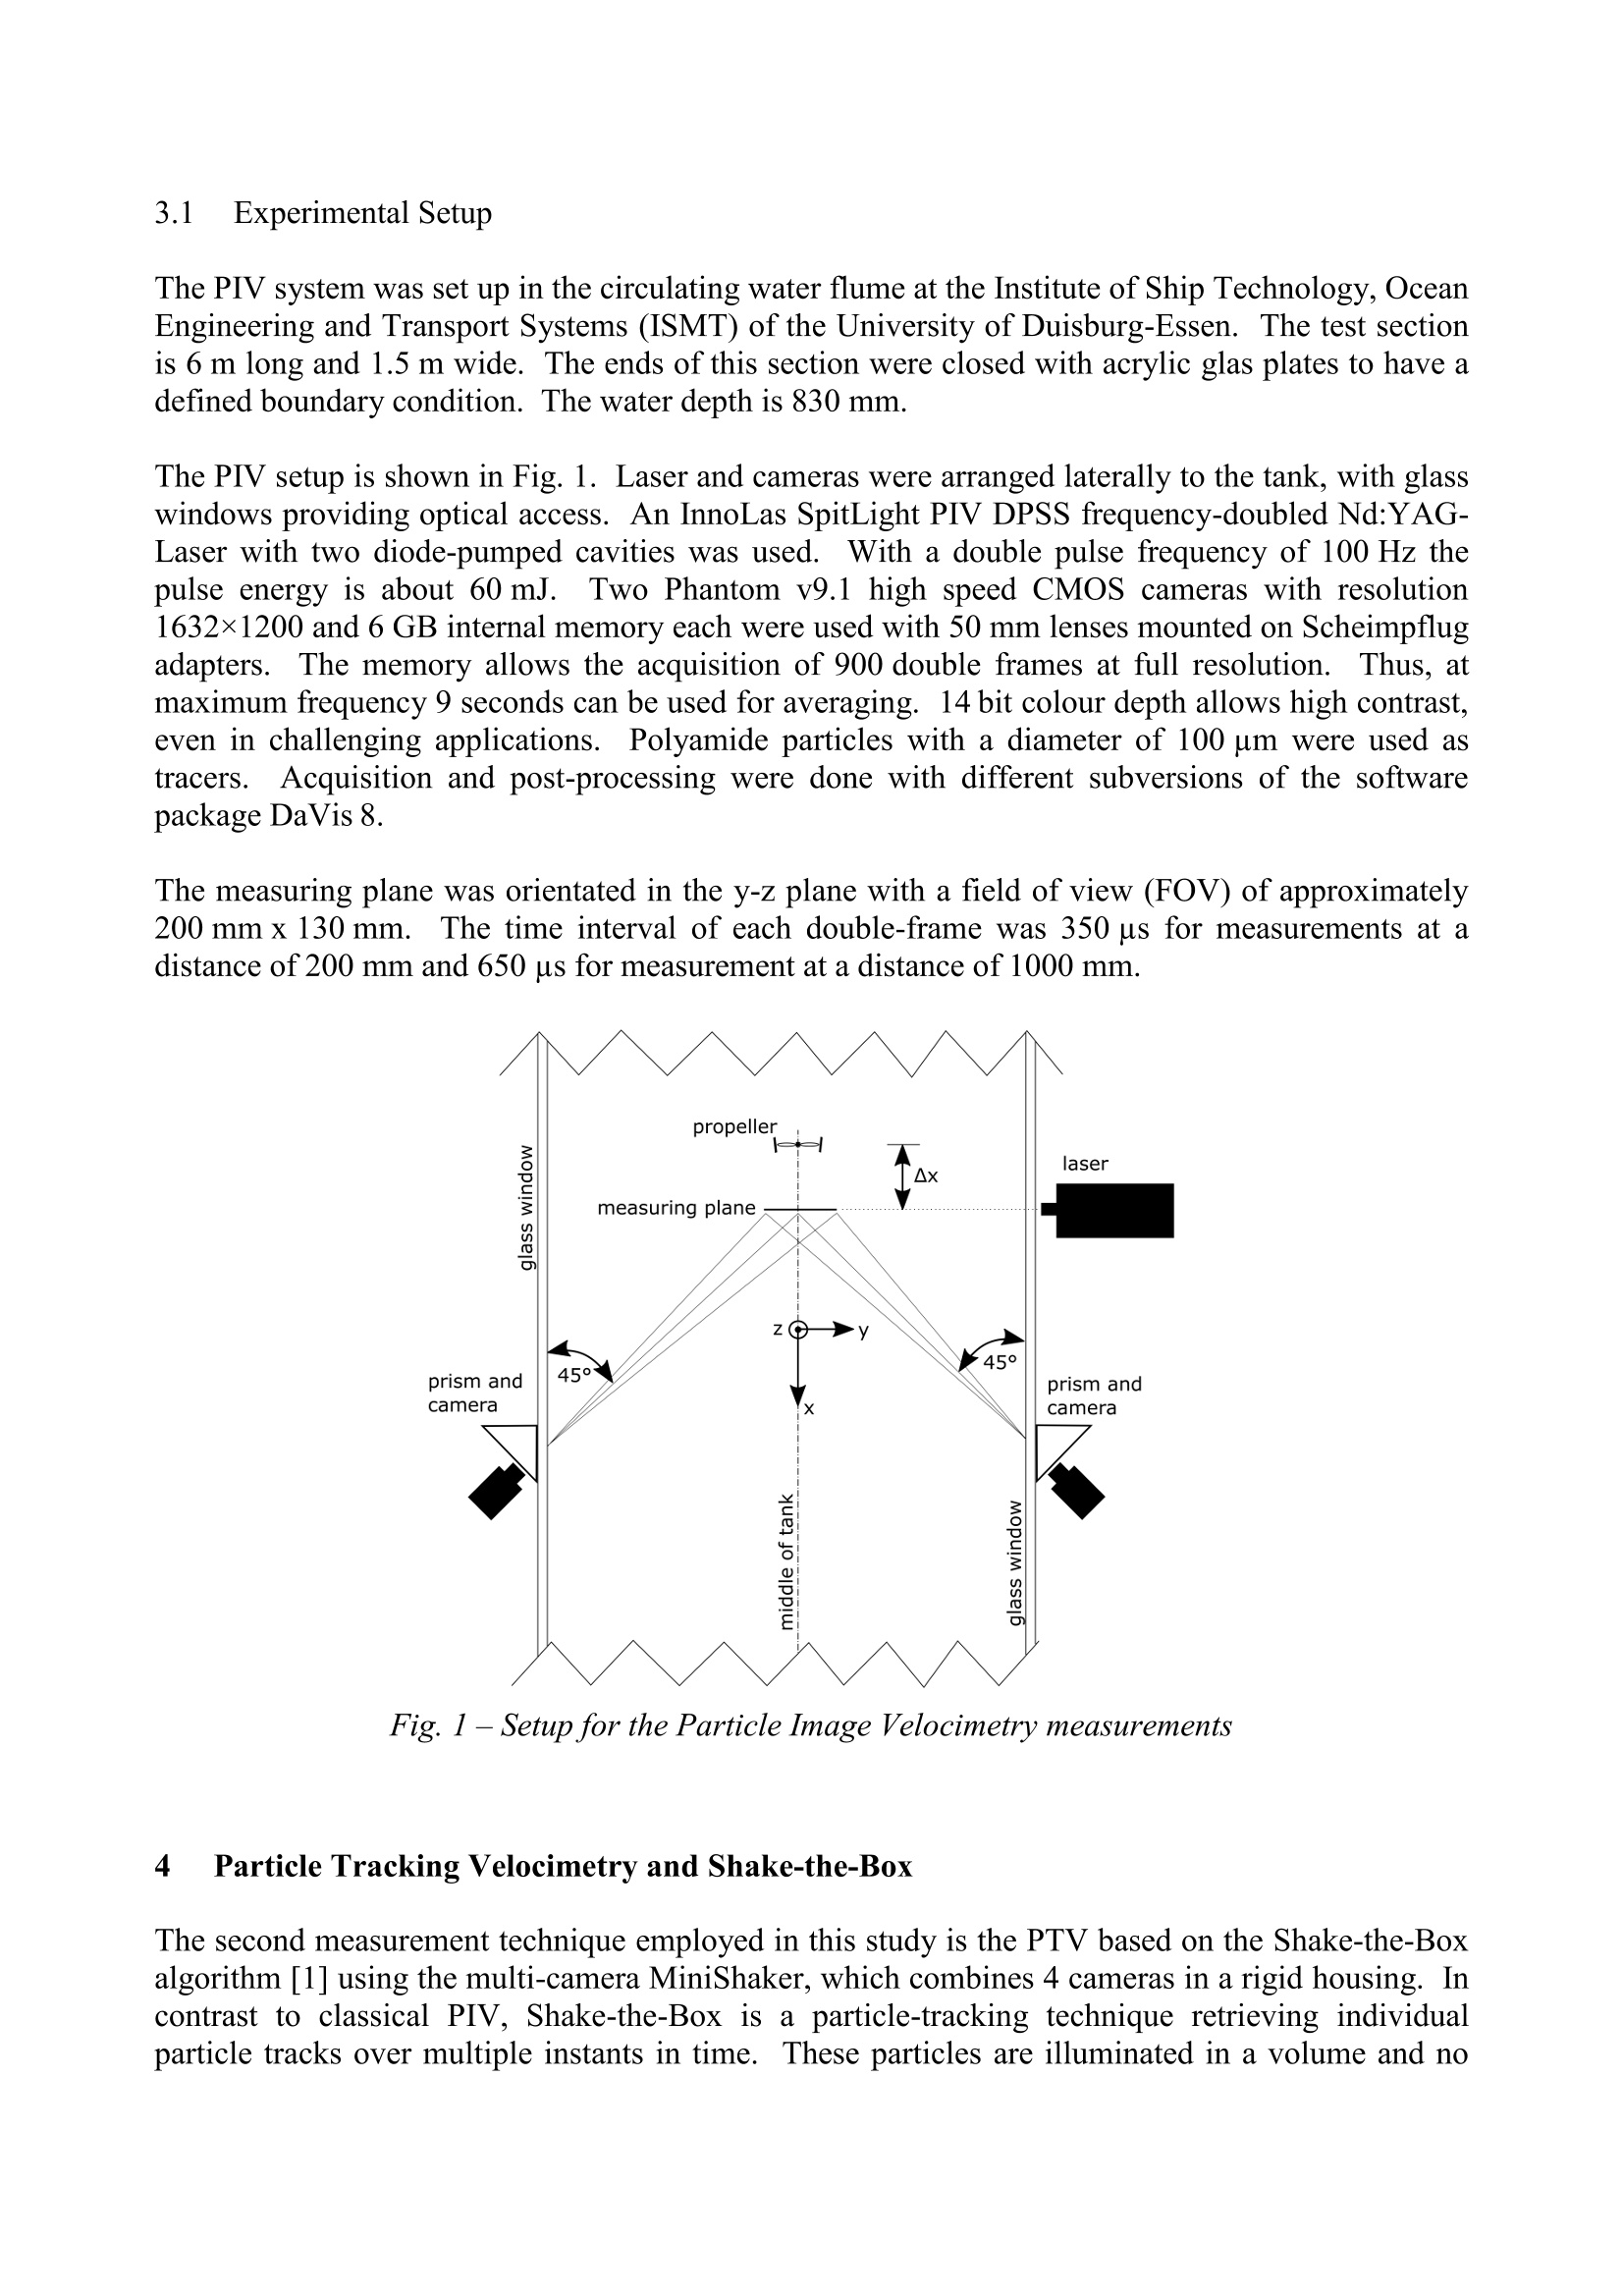
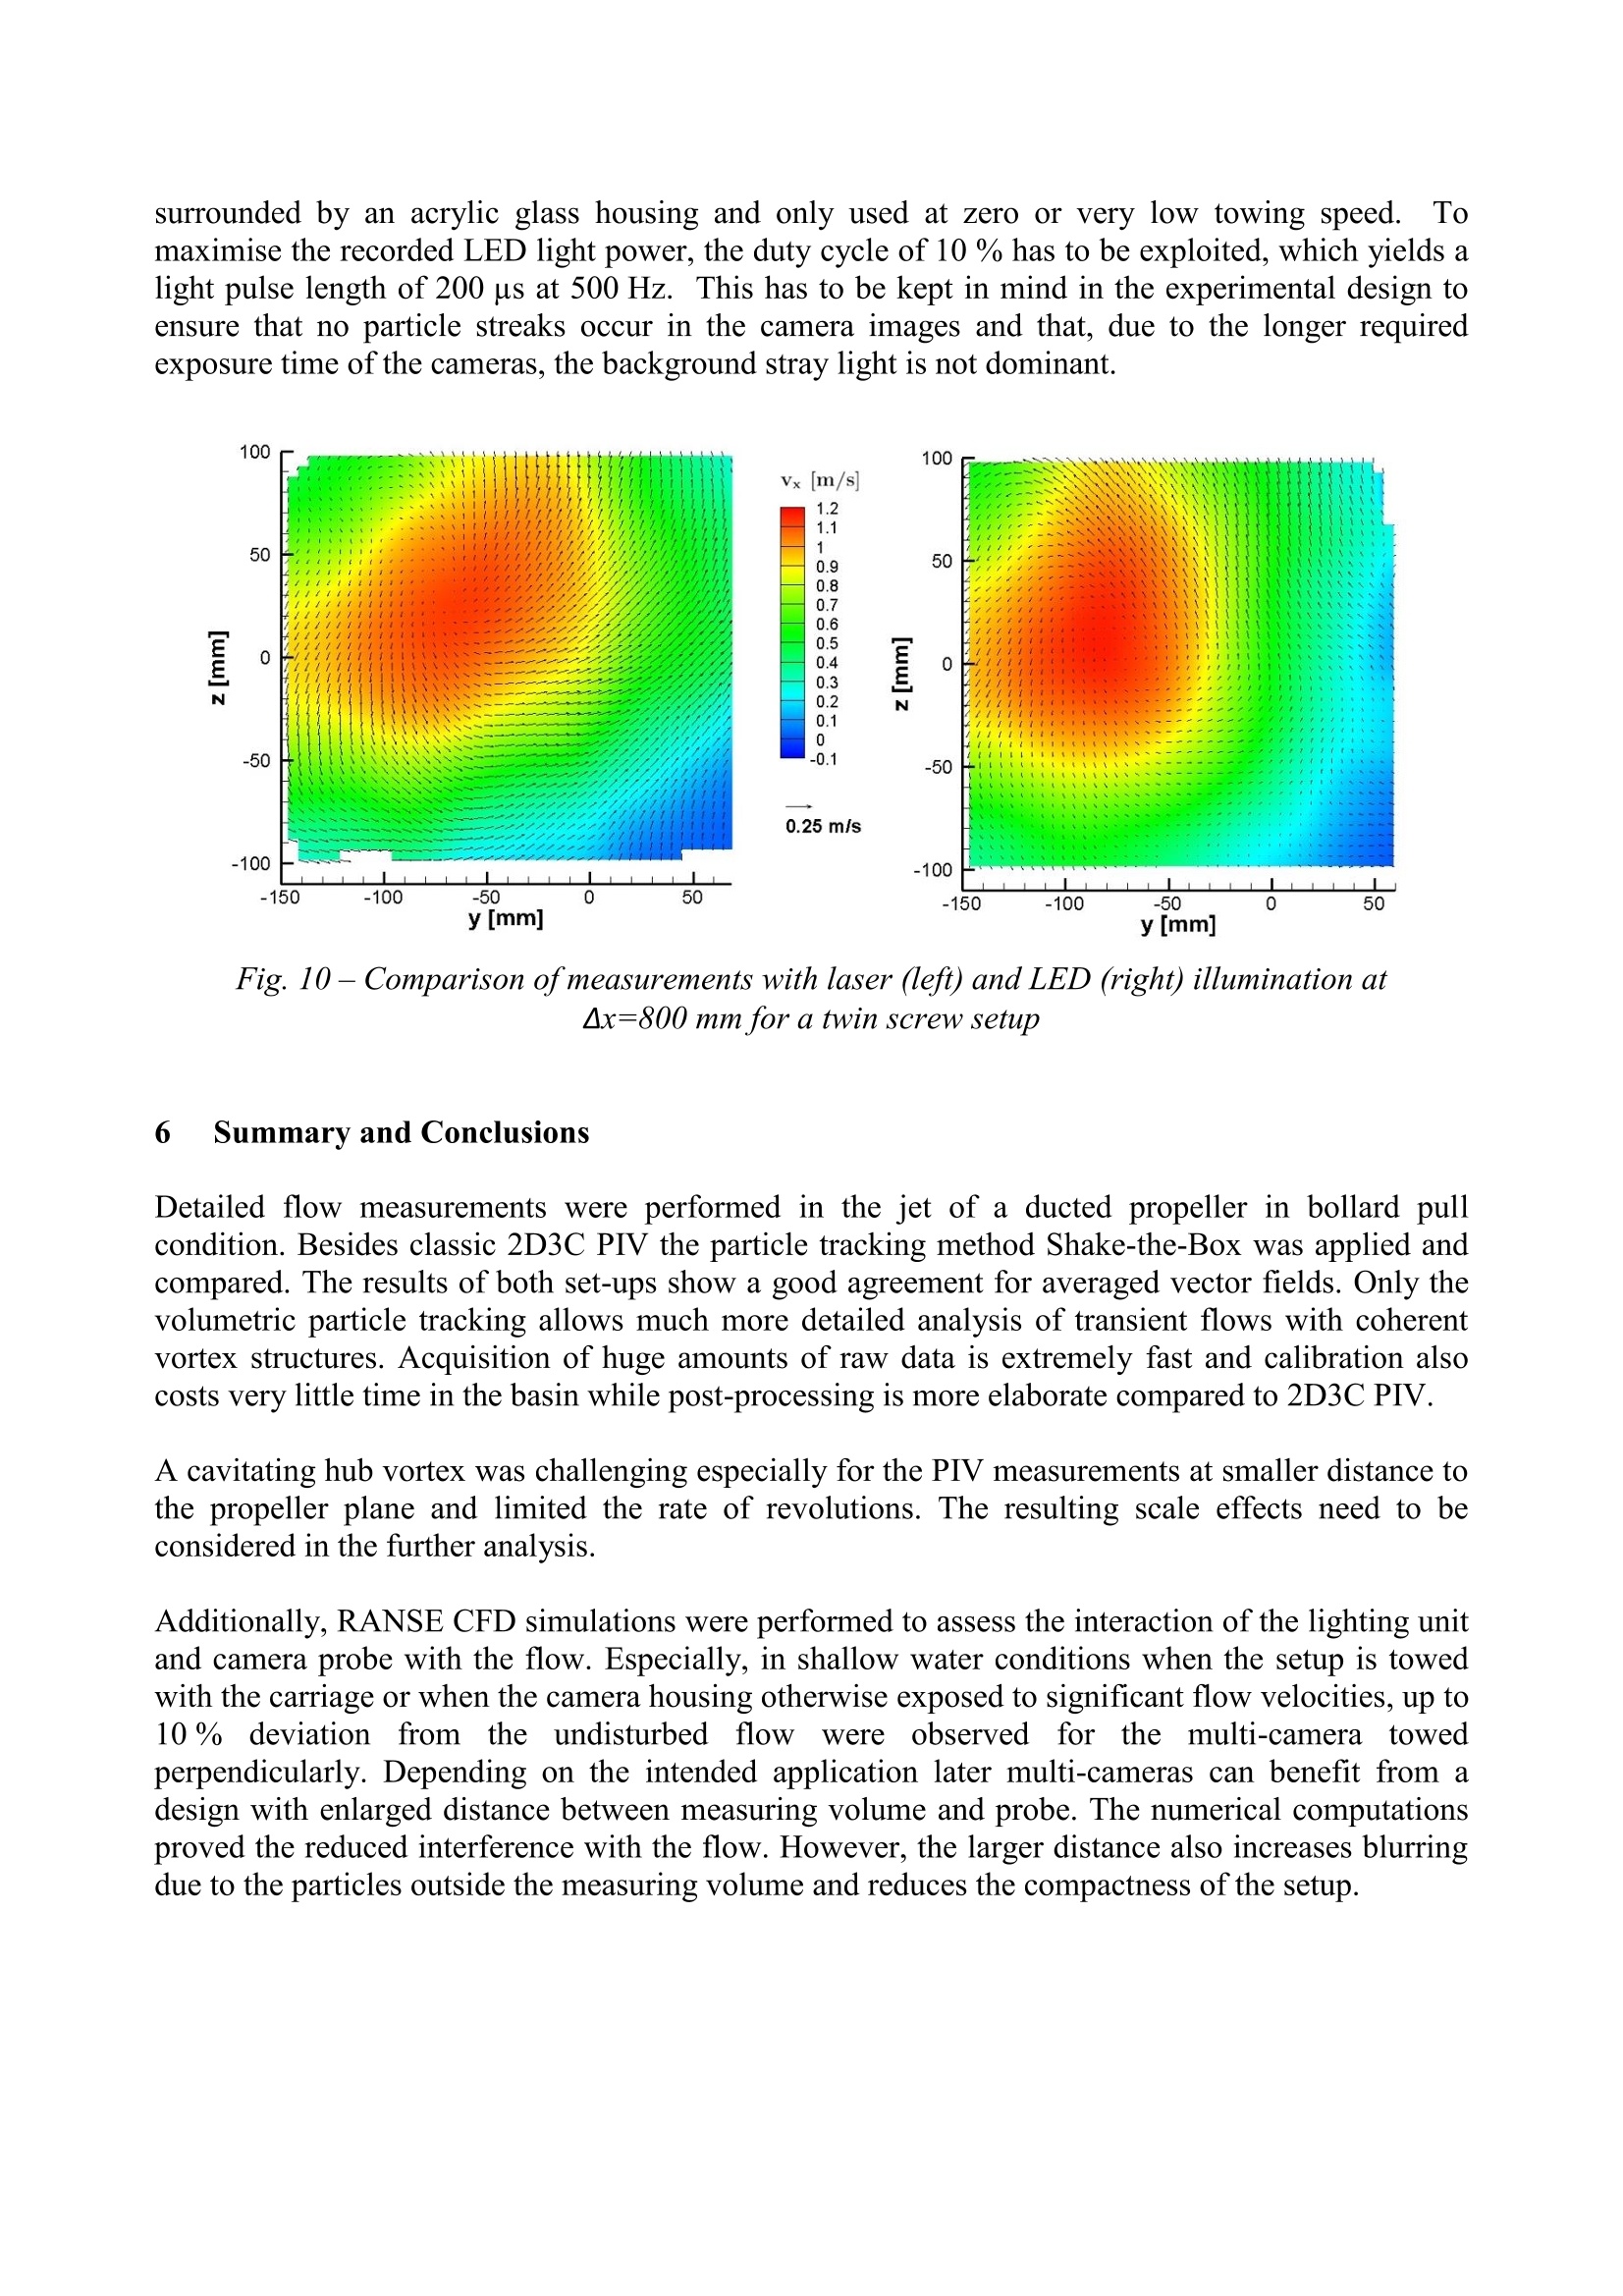
ResearchGateSee discussions, stats,and author profiles for this publication at: https://www.researchgate.net/publication/336318160 VOLUMETRIC FLOW MEASUREMENTS IN THE WAKE OF A DUCTED PROPELLERAll content following this page was uploaded by Benjamin Friedhoff on 08 October 2019The user has requested enhancement of the downloaded file. Volumetric Flow Measurements in the Wake of a Ducted Propeller Conference Paper· October 2019 CITATIONS0 READS24 7 authors, including: Benjamin Friedhoff DST-Development Centre for Ship Technology and Transport Systems 29 PUBLICATIONS 16 CITATIONS SEE PROFILE Some of the authors of this publication are also working on these related projects: Project . Bestimmung des effektiven Propellerzustroms fur die Binnenschifffahrt View project Felix Roettig, Development Centre for Ship Technology and Transport Systems, GermanyKatharina Wennemar, Development Centre for Ship Technology and Transport Systems,Germany Katja Hoyer, Development Centre for Ship Technology and Transport Systems, GermanyRadomir Beslac, LaVision GmbH, Germany Christina Hesseling, LaVision GmbH, Germany Tarek Beck, Federal Waterways Engineering and Research Institute (BAW), Germany Benjamin Friedhoff, Development Centre for Ship Technology and Transport Systems, Germany Understanding the interaction of ship, propulsor and waterway is ofutmost importance in inlandnavigation. Regulations and waterway maintenance rely on assumptions for the potential fordamage of banks and beds by the propeller wake. Scours for example occurring close to ports andlocks where ships need great thrust shall be avoided or repaired at an early stage. Computational Fluid Dynamics are becoming more and more mature and are already applied fornumerous flow phenomena.. 1Especially, in turbulent flows with coherent vortex structures there isstill a large demand for validation data and improved computational methods. 3C Particle Image Velocimetry is a powerful non-invasive laser-based method for the measurementof fluid flows. Here all three velocity components are measured simultaneously within a thin lightsheet resolving the flow in a 2D However, for many applicatio,plane..pians and the deeperunderstanding oftransient 3D flows it is desired to measure simultaneously in a volume. Previous3D particle tracking velocimetry systems suffered from a low resolution and difficulties with ahigher density oftracer particles. The novel system used here to measure the propeller wake behind ducted propellers tries toovercome these disadvantages with the tracking algorithm Shake-the-Box and a new hardwaredesign for straightforward and reliable calibration. The focus ofthis paper is on a comparison ofthe new volumetric flow measuring technology with conventional 3C Particle Image Velocimetry.The test case is the wake ofa ducted propeller in bollard pull condition. Introduction Bed and bank protection is part of the maintenance measures carried out on German inlandwaterways. Due to the fact that larger ships with stronger engines and propulsion systems are beingdeveloped the bed loads as well as the bed erosion will increase. Besides the wave loads and thenear field velocities induced by the ship speed the propeller jet is one of the main reasons for bed orbank erosion, especially in manoeuvring situations. FFor this reason the Federal WaterwaysEngineering and Research Institute (BAW) started a research project to investigate the river bed andbank erosion induced by the propeller jet applying numerical simulations. The aim of this project isto get a fully coupled CFD-DEM simulation including a moving ship, a rotating ducted propeller,realized by using a rotating object with the sliding interface method, and discrete particles torepresent the bed and bank structures. The first part is the validation of the numerical model with experimental results. Besides hullresistance and wave patterns the spread angle and the velocity distribution of the propeller jet is oneof the most interesting parts. This paper describes the model setup and the measurement n odsused to obtain the validation data for the CFD simulations of the propeller jet via Particle ImageVelocimetry (PIV). Besides the common 2D3C PIV setup a new full volumetric particle tracking (PTV-Particle Tracking Velocimetry) method was used. PTV allows 3D flow fields to be capturednot only in one plane, as it is the case with 2D3C PIV, but also to capture transient flows in ameasurement volume and to observe particle propagation over time while passing through themeasurement volume. 2 Test case Measurements in the wake of a ducted propeller in bollard pull conditions, i. e. zero advance speed,were performed with Particle Image Velocimetry and the novel measurement system MiniShakerusing Shake-the-Box (STB) for Lagrangian particle tracking [1]. To minimize flow interferencewith set-up and to allow optical access to the jet an open water test rig was inverted with thehousingupstream of the propulsor system. The tested 4-bladed propeller P189 is right-handed and has a simple shape without skew and rake, apitch to diameter ratio of 1.052, a diameter of 100 mm and an area ratio A:/Ao of 0.71.Thepropeller was operated in duct D356 with shape Wageningen 19A and an inner diameter of 102 mm.The immersion depth of the propeller shaft is 400 mm, which is the maximum allowed by the usedtest rig. The wake was measured in different distances from the propeller.The distance Ax is measuredfrom the middle of the hub without hub cap to the measuring plane.. Two distances are chosen forthe comparison of both methods, namely a distance of 200 mm and a distance of 1000 mm. Thecoordinate origin is positioned at the middle of the propeller hub without hub cap. The x-direction ispositive in stream direction, y-direction positive to starboard and z-direction positive upwards. 3 2D3C Particle Image Velocimetry Particle Imaging Velocimetry measures a flow field indirectly by retrieving the movement of tracerparticles in the fluid of interest from camera images. For measurements of the flow field in a thinplane, the tracer particles are illuminated by a laser light sheet. Cameras record the light scatteredby these particles. By recording two images oftwo laser shots in a short time interval dt, thedisplacement of the particles between these two instants in time can be seen. The camera imagesare subdivided into windows and the particle displacement in each window is evaluated by cross-correlating the intensity information in this window from both images. In a 2D3C PIV setup, twocameras view the light sheet from two different viewing directions. Together with the informationfrom a calibration relating the camera images to a world-coordinate system, these two cameraviewing directions and recordings at two instants in time yield the information required for ameasurement of all three velocity components in the illuminated plane. To retrieve volumetricinformation, individual planes can be measured subsequently and stitched to the flow fieldinformation in the volume of interest. However, the setup and alignment of the optical components can be quite a challenge. Especiallyfor measurements in shallow water conditions, the optical accessis often a limiting factor.Changing the setup is always related to new alignment and calibration. 3.1 Experimental Setup The PIV system was set up in the circulating water flume at the Institute of Ship Technology, OceanEngineering and Transport Systems (ISMT) of the University of Duisburg-Essen. The test sectionis 6 m long and 1.5 m wide. The ends of this section were closed with acrylic glas plates to have adefined boundary condition. The water depth is 830 mm. The PIV setup is shown in Fig. 1. Laser and cameras were arranged laterally to the tank, with glasswindows providing optical access. An InnoLas SpitLight PIV DPSS frequency-doubled Nd:YAG-Laser with two diode-pumped cavities was used.With a double pulse frequency of 100 Hz thepulse energy is about 60 mJ.. Two Phantom v9.1 high speed CMOS cameras with resolution1632×1200 and 6 GB internal memory each were used with 50 mm lenses mounted on Scheimpflugadapters..The memory allows the acquisition of 900 double frames at full resolution. Thus, atmaximum frequency 9 seconds can be used for averaging. 14 bit colour depth allows high contrast,even in challenging applications. Polyamide particles with a diameter of 100 um were t astracers..Acquisition and post-processing were done with different subversions of the softwarepackage DaVis 8. The measuring plane was orientated in the y-z plane with a field of view (FOV) of approximately200 mm x 130 mm..The time interval of each double-frame was 350 us for measurements at adistance of 200 mm and 650 us for measurement at a distance of 1000 mm. Fig. 1 - Setup for the Particle Image Velocimetry measurements Particle Tracking Velocimetry and Shake-the-Box The second measurement technique employed in this study is the PTV based on the Shake-the-Boxalgorithm [1] using the multi-camera MiniShaker, which combines 4 cameras in a rigid housing. Incontrast to classical PIV, Shake-the-Box is a particle-tracking technique retrieving individualparticle tracks over multiple instants in time.11m. These particles are illuminated in a volume and no longer in a light sheet. Hence, in the PTV measurement, an entire volume is measured instantly.For each time step the particle positions in the measurement volume are reconstructed from theparticle images by projection from the camera images to the measurement volume. For a greateraccuracy, each particle position is moved (“shaken) in 3D space to find the best match of thisparticle with all recorded camera images [2]. When a particle position is identified, the respectiveparticle images are subtracted from the camera images to generate a residual image for each camera.The subsequent particle search uses theses residuals to find not yet detected particles. Due to image aberrations, the same particle usually generates differently shaped particle images onthe cameras when it moves to different positions in the volume. This information is reflected by theoptical transfer function [3]. To optimize the shaking-process and the calculation of the residuals,the optical transfer function taking the specific measurement conditions into account is calculatedfrom the particle images prior to the 3D position detection and used as a look-up table. In a time-resolved STB measurement, which uses multiple recordings with a constant time-separationbetween individual images, also the temporal information of the particle movement is used. From aparticle track which is identified in the previous time steps, the current position of this particle isestimated based on a polynomial fit to the already identified track positions. The first step for theidentification of particle positions in the volume in the current time step is the search for particles inthe vicinity of the predicted current particle positions.This ensures a great speed up and particledetection reliability after the initialization phase. Volumetric measurements pose high requirements on the calibration quality, which means that theerror of the mapper between the world coordinate system and the camera images, referred to ascalibration, must be minimized [4]. This means that for the calibration process all cameras andlenses must be rigidly mounted. Images of a calibration plate positioned in the sample volume arerecorded, and the position and mounting of the cameras is kept for the particle recordings. Even temperature changes can worsen the calibration quality. To generate reliable measurements,in the current study, two measures were taken to ensure a sufficient calibration quality: First, thehardware was optimized for underwater measurements; second, the calibration quality was refinedbased on the measurement data. By placing all four cameras and required optics in a rigid housinga relative movement of the cameras to each other is prevented.. The cameras are aligned andfocused to a fixed distance prior to their mounting in the housing minimizing the number of flexiblecomponents and the user effort for camera alignment in the measurement environment. Due to therigid mounting to a single element, this measurement system will be referred to as multi-camera inthe following. With the system positioned in the tank, a pinhole calibration was performed based on recordings ofa velalibration plate with known 3D marker distances, which was positioned themeasurement volume. This yielded the initial calibration function relating world space and cameraimages. This calibration was refined based on particle recordings by volume self-calibration. Forthis purpose, particle positions are identified in 3D space based on the initial calibration function.Back-projections of these identified particle positions to the camera images yield a disparitybetween the original particle image position and the back projected position for each camera image.This disparity reflects the error of the calibration function, which is corrected accordingly [5][6].This iterative volume self-calibration process corrects minor calibration errors based on the currentmeasurement, which means that even small errors, for instance due to temperature effectsmisaligning the optical components slightly, can be corrected between the initial calibration and theactual measurement. 4.1 Experimental Setup Measurements with the PTV system have been performed in the shallow water basin of theDevelopment Centre for Ship Technology and Transport Systems (DST). The basin is 200 m longand 9.8 m wide. The setup was installed in the centre of the basin. Two different setups of themulti-camera were tested. First, the camera was mounted parallel to the propeller jet; second, thecamera was mounted perpendicular to the propeller jet. Both setups are shown in Fig. 2. For thelaser illumination a separate unit was used which delivered the laser light via an optical fibre to theoptics installed under the water surface expanding the laser light approximately in the shape of arectangular pyramid.The laser is a Nd:YLF laser with two cavities emitting at 527 nm.1.Themaximum repetition rate for single shots is 10 kHz... The maximum energy is 30 mJ at 1 kHz. Inthis case only one cavity was used with a repetition rate of 511 Hz and energy of approximately17.5 mJ. In case of the perpendicular setup the multi-camera was oriented so that the reference planecorresponded to the measuring plane of the PIV setup. For the parallel setup, the reference planewas in line with the propeller shaft and jet. The multi-camera was calibrated in the first instance forthis plane and laser illumination was optimised accordingly. The total measurement volume has asize of approximately 300 mm x 220 mm x 150 mm where the longest dimension is parallel to thein-line-arrangement of the cameras in the probe (y-axis in Fig. 2 left, x-axis in Fig. 2 right).220 mm refers to the orientation from the bottom of the basin to the water surface (z-axis in Fig. 2)and 150 mm refers to the dimension pointing away from the cameras (x-axis in Fig. 2 left, y-axis inFig. 2 right). The images of all four cameras have to overlap in the measurement volume.Therefore, the volume has a shape of truncated rectangular pyramid not of a cuboid. Images wererecorded with a frame rate of 511 Hz for about 20 s. Fig. 2 - Setup for the Particle Tracking Velocimetry measurements. Left: with multi-cameraperpendicular to flow direction. Right: with multi-camera parallel to flow direction. 5 Results 5.1 Influence of the camera housing and lighting unit for moving systems Discussions about the advantages and disadvantages from a moving over a stationary system are anon-going topic for flow measurements. The influence of the towed system on the flowmeasurement is often regarded as critical. Therefore, both setups were towed alone to measure thevelocity and to calculate the difference from the carriage velocity. TThheessee uunniifform flow tests wereperformed for both setups at two different water depths. Thus, there are four test cases to evaluatethe influence of the whole system on the measured flow. First measurements at water depth of 1000 mm with a carriage speed of 1 m/s were performed forthe parallel and perpendicular setup. Further, measurements for both setups were carried out at awater depth of 312 mm, with a carriage speed of 0.972 m/s, corresponding to a typical water depthand velocity combination for shallow water tests. At deep water and the parallel setup the measured velocity corresponds very well to the carriagespeed, for large parts of the measuring volume. Only on the edge farther away from the camera, adeviation of 2-3 % can be seen (Fig. 3 a). For the same water depth and carriage speed, but with themulti-camera perpendicular to the flow, the carriage velocity can only be measured in a smallvolume. Close to the lighting unit, a deviation up to 6% is measured (Fig. 3 c). At smaller water depth, the influence of the multi-camera and lighting unit for the parallel setup iscomparable to the influence in deep water. Except a deviation of 2-3 % at the edge of the measuringvolume in y-direction, the measured velocity corresponds to the carriage speed (Fig. 3 b). For theperpendicular setup the influence is more prominent at smaller water depth. The highest measuredvelocity is 4% smaller than the reference speed, in large parts of the measuring volume thedeviation reaches even up to 10 % (Fig. 3 d). To conclude, for the above mentioned conditions, the parallel setup can be used with low risk ofsignificant interference with the measured flow. The perpendicular setup might be used in towedapplications at deep water only and depending on the further experimental setup and conditions.Nevertheless, it is still usable for stationary measurements to optimise the orientation of themeasuring volume. At shallow water the perpendicular setup is not recommended for towingconditions, but only for stationary measurements. However, this result might differ for other waterdepth and velocity combinations, thus uniform flow measurements depending on water depth andvelocity are recommended for each new experiment. Fig. 3-Uniform flow tests - Influence ofmulti-camera and lighting unit at different water depthsfor parallel and perpendicular setup. Shown is the relative velocity with same scale for all plots.a) parallel setup, 1000 mm water depth, 1 m/s b) parallel setup, 321 mm water depth, 0.972 m/sc) perpendicular setup, 1000 mm water depth, 1 m/s d) perpendicular setup, 312 mm, 0.972 m/s 5.2 Comparison parallel and perpendicular setup A comparison of the parallel and perpendicular setup is not only reasonable for the moving system,but also for a static setup. The setup is often limited by the surrounding space and mountingpossibilities or the further experimental setup. Therefore, measurements at the same distance andthe same test conditions are compared in Fig. 4 for the parallel and perpendicular setup. First of all, it can be mentioned, that the results show a good agreement for the total velocity in alldirections and also for the shape of the jet. Further, Fig. 4 shows how much information can beobtained from one measurement.The 3D-plot belongs to a measurement parallel to the jet, whereexemplarily three slices are shown. The x-z-plane is the reference plane for this setup and is usuallythe plane with the best results, since calibration and illumination have been optimised for thisposition. However, the accuracy in the y-z-plane is not significantly impaired. As described above,the extension of the measurement volume is about twice along the in-line arrangement of thecameras in the probe compared to the extension pointing in the camera viewing direction. Hence, areorientation of the probe to the parallel arrangement comes with the drawback of a reduced field ofview in the y-z-plane whereas the length of the volume along the x-axis is increased. This can beseen in Fig. 4 on the bottom left. For 2D3C PIV measurements the choice of the setup orientation is usually depending on thedominant velocity component and the optical access. The out of plane component is usually not asprecise as the in plane components.This consideration has not to be taken into account forvolumetric PTV measurements. A slightly higher uncertainty can be expected in camera viewingdirection. A comparison of the results obtained from the perpendicular and from the parallelarrangement in the y-z-planes shown in Fig. 4 makes clear that this uncertainty is not decisive forthe current measurement. Hence the setup can be chosen under the aspects of best optical accessand minimised influence on the measured flow. Fig. 4- Comparison of PTV measurements with the parallel and perpendicular setup. a) 3D viewfrom parallel measurements with three different planes (shown in detail in b)-d)) b) y-z-plane forparallel setup at a distance of200 mm. c) y-z-plane for parallel setup at a distance of150 mm.d) x-y-plane for parallel setup atz=0. e) y-z plane from perpendicular measurements at a distanceof 200 mm. f) y-z-plane from perpendicular measurements at a distance of150 mm. 5.3 Comparison of PIV and PTV results Fig. 5 shows the comparison of PIV and PTV measurements. The PTV measurements wereperformed with the perpendicular setup.Comparing the time averaged flow fields of bothmeasurements the results show a good agreement regarding all three velocity components. Fig. 5-Comparison ofPIV (left) and PTV(right) measurements at Ax=200 mm and a propellerrate of 17 Hz. Black line indicates data taken for line profile (Fig. 6) For a more detailed comparison, a line plot has been extracted from both results. Fig. 6 shows thevelocity in x-direction (vx) along the indicated line in Fig. 5. Both curves show a good agreementaccording to the shape of the jet and the total velocity. PIV 200 mm PTV 200 mm Fig. 6-Line profiles of the velocity for measurements at a distance of 200 mm and propeller rate of17 Hz (black lines), taken from Fig.5, for PIV (solid) and PTV (dashed) measurements; And lineprofiles of the velocity for measurements at △x=1000 mm (blue lines) and propeller rate of 17 Hzfor PIV (solid) and PTV (dashed) measurements. Fig. 6 also shows the comparison of line profiles of PIV and PTV measurements at a distanceAx=1000 mm and a propeller rate of 17 Hz. The results agree yrqeuei t(e well, but differences are visible.The differences in the far field are most probably due to the different setups implying differentboundary conditions. Further, with decreasing velocity, the flow is more vulnerable for externalinfluences and low frequency unsteadiness. 5.4 Time-averaged and time-resolved volumetric measurements To extend the measurement range from planar to volumetric data two methods are presented in thisstudy. With the stereoscopic system (2D3C PIV), multiple planes can be recorded and subsequentlystitched to a volume. This method has the inherent disadvantages that it is very time-consumingand limited to the analysis of temporally averaged flow fields. Furthermore, it has to be ensuredthat a sufficient quantity of the particles stay in the light sheet between the two laser shots to yield areliable cross correlation result.Therefore, the PIV At, i.e. the time between the two laserilluminations, in relation to the out-of-plane velocity component has to be set carefully. Using the multi-camera approach with volumetric illumination yields data in an entire volumeinstantly without the necessity of stitching. Here, Shake-the-Box particle tracking is employed.The particle seeding density is smaller than for planar PIV limiting the spatial resolution. Being aparticle tracking technique, the spatial resolution can be increased by accumulating the informationfrom multiple time steps [7]. The results of a Shake-the-Box evaluation are converted to a volumetric grid, where the sub volumeelements are called voxel (vox). Fig. 7 shows a result of a Shake-the-Box evaluation after thetransformation of the particle tracks from 10 000 time steps to a 3D grid. The volume filled withparticle tracks is binned to a grid of 323vox (window size with 75 % overlap, i. e. the final gridresolution is 8 vox. For each track with minimum length of 11 time steps, a polynomial of 2ndorderand length 11 is fitted to retrieve velocity and acceleration information from this track. Dependingon the distance of the track to a bin, the respective values contribute to the final value in this bin.For a bin to be regarded as valid, at least one tracked particle has to be present in this bin. For abetter visibility, in Fig. 7 vertically every 4" vector and horizontally every 2"d vector is displayed,and between two shown x-z-vector planes 24 planes are omitted. The isosurfaces represent sectionsof constant velocity. Fig. 7 - Shake-the-Box result measured in parallel setup configuration for ▲x=50-270 mm at 23 Hz binned to a regular grid of118x87x61 vectors on a grid of 8 vox resolution. 10 000recordings are temporally averaged. Horizontally every 2"“vvector and vertically every 4"vectorare displayed. Between the x-z-vector planes 24 planes are not displayed. Left: volumetricrepresentation, right: projection to the y-z-plane. Retrieving an entire volume instantly paves the way towards the measurement of instantaneous 3Dflow fields. Hence, of the time-resolved measurement data over 10 000 time steps, only a singlesnapshot is converted to grid-based data in a similar way as described above with the difference thatthe final grid resolution was reduced to 16 vox, i. e. 643vox with 75%overlap are used for each bin.To improve the quality of the resulting velocity field further, the temporal-resolution was exploitedby pseudo-Lagrangian tracking [8]. The result is shown in Fig. 8. Fig.8- Shake-the-Box result measured in parallel setup configuration for Ax=50-270 mmat23 Hz binned to a regular grid of 59x44x31 vectors with 16 vox resolution. The result for a singletime step is shown where vertically every 2" vector is displayed. Between the y-z-vector planes15 planes are not displayed. Left: volumetric representation, right: projection to the y-z-plane. The general rotation and the overall swirl of the propeller jet can be observed in the time-averagedas well as the time-resolved analysis. Even though the spatial resolution is smaller for the time-resolved case, as fewer particles contribute to the result, it is clear that this technique can give measurement access to transient phenomena, e.g. to tip vortices. Still, no tip vortex is clearlyvisible here, which is probably related to the duct and the propeller’s high area ratio yielding no tipvortex induced to the wake field. An aspect which shall be considered in future studies becomes clear when time-resolved andtemporally averaged results are compared. For a high spatial resolution without data gaps in themeasured flow field, a measurement over multiple time steps increasing the number of particletracks contributing to the result is very advantageous. Here, the flow situation of a propeller wakeoffers the possibility to record phase constant measurements repeating the flow situation for a bladeposition multiple times and accumulating the data over multiple measurements triggered at thisblade position, see e. g. Felliet al. [9]. In this way, the smoothing over all blade positions yieldingthe smooth cones in Fig. 7 could be avoided, whereas the spatial resolution of the flow field couldstill be increased by accumulating the information in particle tracks recorded in multiplemeasurements. Therefore,phase-constant measurements shall be used in future studies. 5.5 Laser light compared to high-power LED illumination for volumetric PTV measurements A promising option is the use of a LED light source instead of the laser. The used LED light sourceis a blue LaVision LED-Flashlight 300 with area cross section of 300 x 100 mm’ and an electricalpower of 300 W. The LED can be operated in a pulsed-overdrive mode, which allows the raise ofthe LED current above the maximum continuous current of the LED. Using the pulsed overdrivemode with a duty cycle of 10 % at 511 Hz, each light pulse emits the energy of approximately56 mJ. Measurements with both light sources have been performed for a twin screw setup similar to thesetup mentioned above, where a pair of the same propeller and duct were used. The propellers wererotating inwards over the top. In contrast to the laser, the LED illuminated the volume of interestfrom the top, where it was immersed into the water surrounded by an acrylic glass housing (Fig. 9).Due to the housing and the available space above the waterline at the carriage, the illuminatedvolume was reduced in positive y-direction for the LED tests setup. Fig. 10 shows the averagedvelocity fields behind the starboard propeller with the perpendicular setup. Fig.9- Side view of the setup with the use ofLED light source Both measurements are in good agreement with each other.. The LED light source has theadvantage that no laser safety measures have to be taken. Depending on the setup and light access,the LED light source is a good and easy alternative option. However, up to now there is nnostreamlined water tight housing available. Thus, the LED source can only be partly immersed e. g. surrounded by an acrylic glass housing and only used at zero or very low towing speed.Tomaximise the recorded LED light power, the duty cycle of 10 % has to be exploited, which yields alight pulse length of 200 us at 500 Hz. This has to be kept in mind in the experimental design toensure that no particle streaks occur in the camera images and that, due to the longer requiredexposure time of the cameras, the background stray light is not dominant. Fig. 10-Comparison ofmeasurements with laser (left) and LED (right) illumination atAx=800 mm for a twin screw setup 6 Summary and Conclusions Detailed flow measurements were performed in the jet of a ducted propeller in bollard pullcondition. Besides classic 2D3C PIV the particle tracking method Shake-the-Box was applied andcompared. The results of both set-ups show a good agreement for averaged vector fields. Only thevolumetric particle tracking allows much more detailed analysis of transient flows with coherentvortex structures. Acquisition of huge amounts of raw data is extremely fast and calibration alsocosts very little time in the basin while post-processing is more elaborate compared to 2D3C PIV. A cavitating hub vortex was challenging especially for the PIV measurements at smaller distance tothe propeller plane and limited the rate of revolutions. The resulting scale effects need to beconsidered in the further analysis. Additionally, RANSE CFD simulations were performed to assess the interaction of the lighting unitand camera probe with the flow. Especially, in shallow water conditions when the setup is towedwith the carriage or when the camera housing otherwise exposed to significant flow velocities, up to10 % deviation from the undisturbed flow were observed for the multi-camera1towedperpendicularly. Depending on the intended application later multi-cameras can benefit from adesign with enlarged distance between measuring volume and probe. The numerical computationsproved the reduced interference with the flow. However, the larger distance also increases blurringdue to the particles outside the measuring volume and reduces the compactness of the setup. 7 References [1] D. Schanz, S. Gesemann and A. Schroder,“Shake-The-Box: Lagrangian particle tracking athigh particle image densities,” Exp. Fluids, pp. 57-70, 2016. [2] B. Wieneke,“Iterative reconstruction of volumetric particle distribution,” Meas. Sci. Technol.,vol. 24, no. 2, p. 024008,2013. ( [3] D. Schanz, S. Gesemann, A. Schroder, B . W ieneke a n d M. No v ara,“No n -uniform opti c al transfer functions in n particl e imaging: calibration and application to tomographicreconstruction,”Meas. S c i. Technol., vol. 24, no.2, p. 024009, 2013. ) [4] G. E. Elsinga, F. Scarano, B. Wieneke and B. W. v. Oudheusden,“Tomographic particle imagevelocimetry,”Exp. Fluids, vol. 41, no. 6, pp. 933-947, 2006. ( [5] B. Wieneke,“Volume self-calibration for 3D particle image velocimetry,”Exp. Fluids, vol. 45,no.4,pp.549-556,2008. ) [6] B. Wieneke, “Improvements for volume self-calibration,” Meas. Sci. Technol. 29, vol. 29, no. 8,p. 084002,2018. ( [7] C. J. Kahler, S. Scharnowski an d C. Cie r pka, “On t he resolution limit o f digital particle imagevelocimetry,”Experiments i n Fluids, vol. 52, no. 6, pp. 1629-1639,2012. ) [8]P. L. van Gent, D. Michaelis, B. W. van Oudheusden, P.-E. Weiss,R. de Kat, A. Laskari, Y. J.Jeon, L. David, D. Schanz, F. Huhn, S. Gesemann, M. Novara, C. McPhaden,N. J.Neeteson, D.E. Rival, J. F. G. Schneiders and F. F. J. Schrijer,“Comparative assessment of pressure fieldreconstructions from particle image velocimetry measurements andILagrangianparticletracking,”Exp Fluids, vol. 58, no. 33,2017. ( [9] M.Felli, M. F alchi a nd F. P ereira, “ Investigation of the Flow Field a round a Propeller-RudderConfiguration: On-Surface Pressure Measurements andd Velocity-Pressure-Phase-LockedCorrelations,” i n Second International Symposium on Marine Propulsors (smp' 1 1), Hamburg, 2011. ) Vi Understanding the interaction of ship, propulsor and waterway is of utmost importance in inland navigation. Regulations and waterway maintenance rely on assumptions for the potential for damage of banks and beds by the propeller wake. Scours for example occurring close to ports and locks where ships need great thrust shall be avoided or repaired at an early stage.Computational Fluid Dynamics are becoming more and more mature and are already applied for numerous flow phenomena. Especially, in turbulent flows with coherent vortex structures there is still a large demand for validation data and improved computational methods.3C Particle Image Velocimetry is a powerful non-invasive laser-based method for the measurement of fluid flows. Here all three velocity components are measured simultaneously within a thin light sheet resolving the flow in a 2D plane. However, for many applications and the deeper understanding of transient 3D flows it is desired to measure simultaneously in a volume. Previous 3D particle tracking velocimetry systems suffered from a low resolution and difficulties with a higher density of tracer particles.The novel system used here to measure the propeller wake behind ducted propellers tries to overcome these disadvantages with the tracking algorithm Shake-the-Box and a new hardware design for straightforward and reliable calibration. The focus of this paper is on a comparison of the new volumetric flow measuring technology with conventional 3C Particle Image Velocimetry. The test case is the wake of a ducted propeller in bollard pull condition.
确定


还剩13页未读,是否继续阅读?

产品配置单

北京欧兰科技发展有限公司为您提供《导管螺旋桨推进器中3D3C速度矢量场检测方案(粒子图像测速)》,该方案主要用于其他中3D3C速度矢量场检测,参考标准--,《导管螺旋桨推进器中3D3C速度矢量场检测方案(粒子图像测速)》用到的仪器有LaVision 体式粒子跟踪测速系统(4D-PTV)、LaVision DaVis 智能成像软件平台
相关方案
更多
该厂商其他方案
更多