


☆双向各三束光片照明,360°全方位成像;
☆光片参数可变,适用于各种样品;
☆简单易用的样品腔,可对活体动物和透明组织进行成像;
☆可在水溶性缓冲液和透明溶剂中成像,并对不用溶剂进行折射率修正;
☆水平方向光路的动态聚焦,带来佳的分辨率;
☆超大工作距离,支持大样品体积10 x 10 x 10mm;
☆放大倍率可在1.26x至12.6x调整。
方案详情

Resource CelResource Tridimensional Visualization and Analysis of EarlyHuman Development Graphical Abstract Highlights VWe used 3DISCO/iDISCO+clearing methods to start buildinga 3D human cell atlas A collection of high-resolution images of whole humanembryos and fetal organs An interactive online resource and 3D digital database ofhuman development Unknown features of human development revealed incleared and immunostained embryos Tridimensional Visualization and Analysisof Early Human Development Morgane Belle,1 David Godefroy, Gerard Couly,Samuel A. Malone,2,3Francis Collier,4,5 Paolo Giacobini,2,3,4and Alain Chedotal1,6,* 1Sorbonne Universites, UPMC Univ Paris 06, INSERM, CNRS, Institut de la Vision, 17 Rue Moreau, 75012 Paris, France 2UMR-S 1172, JPArc - Centre de Recherche Jean-Pierre AUBERT Neurosciences et Cancer, University of Lille, Lille 59000, France 3INSERM, UMR-S 1172, Laboratory of Development and Plasticity of the Neuroendocrine Brain, Lille 59000, France 4FHU 1,000 Days for Health, School of Medicine, University of Lille, Lille 5900, France 5Gynaecology Service, Hospital Jeanne de Flandres, CHU Lille, Lille 59000, France 6Lead Contact *Correspondence: alain.chedotal@inserm.fr Generating a precise cellular and molecular cartog-raphy of the human embryo is essential to our under-standing of the mechanisms of organogenesis innormal and pathological conditions. Here, we havecombined whole-mount immunostaining, 3DISCOclearing, and light-sheet imaging to start building a3D cellular map of the human development duringthe first trimester of gestation. We provide high-res-olution 3D images of the developing peripheral ner-vous, muscular, vascular, cardiopulmonary, and uro-genital systems. We found that the adult-like patternof skin innervation is established before the end ofthe first trimester, showing important intra- and in-ter-individual variations in nerve branches. We alsopresent evidence for a differential vascularization ofthe male and female genital tracts concomitant withsex determination. This work paves the way for acellular and molecular reference atlas of human cells,which will be of paramount importance to under-standing human development in health and disease. INTRODUCTION For centuries, the intricacies of human development have re-mained an enigma and its study unexplored due to sociocultural,religious, and moral reasons (Morgan, 2009). In the second halfof the twentieth century, a growing interest in experimentalembryology and technological developments (King and King,1986) led to the first scientific descriptions of human embryodevelopment (His, 1881; Keibel and Elze, 1908). In the middleof the 20*h century, Franklin Mall and colleagues at the CarnegieInstitute collected, sectioned, and stained thousands of humanembryos and fetuses (Morgan, 2009). Wax reconstructions and3D embryo models were generated (Norman, 1923) to definestages of human embryogenesis, still in use today (Keibel andMall, 1910;O'Rahilly and Muller,1987). Similar collections of hu-man embryos were initiated in other countries (Blechschmidt, 1977; Fujimoto, 2001). These data still appear in all moderntextbooks and atlases of embryogenesis and developmentalbiology. More recently, histological sections were digitizedand reconstructed in 3D (de Bakker et al., 2016). Immunohisto-chemical studies have also been performed but lack the 3D in-formation, which is essential to understanding organogenesis.Ex vivo 3D images of paraformaldehyde (PFA)-fixed humanembryos were recently obtained by using magnetic resonanceimaging or phase-contrast X-ray radiographic computed to-mography; however, the resolution is still far from being at thecellular level (Kanahashi et al.,2016;Yamada et al.,2010). Here, we have performed whole-mount immunostaining on 36human embryos and fetuses ranging from 6 to 14 weeks of gesta-tion with over 70 antibodies, most of which had never been usedin humans (see STAR Methods and Table S1). We have generated3D images of human embryos at an unprecedented cellular res-olution. This work offers a unique opportunity to start building amolecular and cellular atlas for the study of human development.The possible applications of this new method in the field ofembryology are countless. They open new avenues for the studyof molecular mechanisms regulating the development of humanembryos in physiological and pathological conditions. RESULTS AND DISCUSSION Development of the Human Peripheral Nervous SystemWe used a protocol for whole-mount immunostaining and3DISCO clearing to analyze the development of human embryos Figure 1. 3D Analysis of Peripheral NervousSystem Development in Human EmbryosAll panels are LSFM images of solvent-clearedembryos and fetuses. (A) Surface shading image (left) and Prph labelingof peripheral nerves (right) at GW7. (B)Overlay of the surface shading image (gray) andPrph labeling (green) at GW8. (C) High-magnification images of Prph+ innerva-tion at GW8. The middle and right panels areoverlays of the surface contrast image (gray) andPrph labeling (green). (D) GW9.5 thumb labeled for Prph and Tag-1. Thetwo markers co-localize but the thinnest branches(arrowheads) are better labeled with Tag-1. (E) Dorsal view of a GW9.5 hand double labeled forChAT (motor axons) and Prph (sensory axons),showing the lack of co-localization. (F) Dorsal view of a GW9 foot labeled for ChAT andTag-1. The two markers are not co-expressed. (G) Right view of the head and cranial nerves atGW7 (Prph staining). On the right panel, cranialnerves are segmented and highlighted with spe-cific pseudo-colors. Abbreviations: N, nostrils; M, mouth; V2(maxillary)and V3 (mandibular), second and third branches ofthe trigeminal nerve. Scale bars, 1,000 um in (A) and (G), 2,000 um in (B),500 um in (C), 300 um in (D), 200 um in (E), and150 um in (F). See also Figure S1. naddition, themethanol treatmentneeded for iDISCO+ is not compatiblewith some antibodies. Last, the sizereduction after 3DISCO allowed wholeembryos to be imaged via LSFM andPrph+ peripheral nerves to be visualizedfrom the brainstem and spinal cord totheir distal extremities (Figures 1A-1Cand S1A and S1B and Movie S1). We next tested specific markers of sen-sory and motor axons, focusing primarilyon the innervation of the developing feet (first 8 weeks of gestation) and fetuses (from 8.5 to 14 weeks,see STAR Methods). We first studied the development of the pe-ripheral nervous system (PNS) using antibodies against theneuron-specific intermediate filament protein peripherin (Prph),which in rodents is expressed by sensory and autonomic axons(Parysek et al., 1988). In human fetuses, Prph labels auditory andvomeronasal nerves (Casoni et al., 2016; Locher et al., 2013). We first used embryos at gestation week 6 (GW6) (or, Carnegiestage CS17, n=1; see STAR Methods for stage determination),GW7 (CS19,n=2), GW7.5 (CS21,n=1),and GW8 (CS23,n=3).As previously reported for mice (Belle et al., 2014;Renier et al.,2014), tissue-shrinkage was observed (20%-40% of its originalsize) and remained homogeneous throughout the embryo. Thisshrinkage can be avoided using iDISCO+ (Renier et al., 2016),however, the cleared embryos produced by this method aremore fragile and their fluorescence less stable than with 3DISCO. and hands from GW6-GW12. Motor and sensory axons wererespectively labeled with antibodies against choline acetyltransferase (ChAT; n= 14 cases) and transient adhesion glyco-protein-1(Tag-1/Contactin 2; n=22 cases) (Karagogeos et al.,1997). Double staining for Prph and Tag-1 (n = 14) confirmedthat both markers overlapped in peripheral nerves, althoughfrom GW9, the thinnest axonal branches were better seen withTag-1 (Figure 1D). In contrast, there was no overlap betweenChAT+ and Prph+(Figure 1E; n=6) or ChAT+ and Tag-1+(Fig-ures 1F and S1C; n =7) immunoreactive axons. Motor nerveroots were not immunoreactive for Prph (data not shown), sug-gesting that in humans, Prph is differentially expressed betweenspinal cord and cranial motor axons. 3D virtual dissection of organ innervation with Imaris segmen-tation plugins was performed to trace, artificially color, andreconstruct individual nerve fascicles (STAR Methods). This B GW11 Figure 2. 3D Analysis of the Innervation ofthe Developing Human Hand and FootAll panels are LSFM images of solvent-clearedembryos and fetuses. (A) Images (dorsal view) illustrating the segmenta-tion process of individual sensory nerves in a GW8hand labeled for Prph.Raw LSFM images (left) andindividual segmentation and 3D rendering of theradial (blue), median (magenta), and ulnar (green)nerves (right panels) are shown. (B) Time series illustrating the developing inner-vation of the right hand from GW7-GW11 at asimilar scale. The musculocutaneous nerve (ar-rows) transiently extends into the hand. (C and D) Segmentation of the sensory (Tag-1, green) and motor (ChAT, red) nerves in a GW9 foot(C) and GW8.5 hand (D). (C) Dorsal views (upper panels) and right side views(lower panels). (D) Trajectory (dorsal view) of individual motor andsensory axons (lower panel). Scale bars, 700 pm in (A), 400 um in (B), 500 umin (C), 200 um in (D). See also Figure S2. (Figures 2C and 2D and S1C and MovieS2) to determine where and how the twotypes of nerves diverge. We next compared the nerve branchingpatterns in 11 hands and found, in all indi-viduals analyzed, striking heterogeneitybetween the left and right hands. At allages, the median nerve was the mostsimilar (Figure S2A and data not shown),whereas noticeable differences in thenumber and length of branches existedbetween the left and right ulnar or radialnerves (Figures S2A and S2B and MovieS2). The low number of cases analyzeddid not allow for the detection of anycorrelation with hand laterality. Interest-ingly, unlike in adults, the musculocuta- method was applied to GW7 (CS19;n=2)and GW8 (CS23;n=1;Figure 1G) cranial nerves (Figures 1G and S1A and Movie S1).Fetuses older than GW8, too large for our LSFM microscope,were dissected prior to processing in order to image limbs andother large organs. Segmentation-based tracing was used to reconstruct the sen-sory innervation of the hand from GW6 to GW11.5. The humanhand contains the ulnar (or cubital), median, and radial nerves,which innervate different hand areas in a pattern highlyconserved between individuals (Unver Dogan et al., 2010). Sensory nerves and their branches in the hands of 14 embryosand fetuses were reconstructed in 3D using Prph (GW7-GW11,n= 11) or Tag-1 (GW6-GW9.5, n=3) immunostaining (Figures2A and 2B and S1D) and used to create a developmental time-lapse of sensory innervation in the human hand (Figure 2B andMovie S2). Furthermore, we reconstructed the motor (ChAT+)and sensory (Tag-1+) innervation of two GW8.5 and GW9 fetuses neaous nerve extended into the hand, at least until GW11(Figure 2B). The adult cutaneous innervation is topographically organizedwith each of the three nerves innervating non-overlapping skinterritories. To determine how this map is established, wepseudo-colored the domains overlying Tag-1+ axons in handsat GW6, GW8.5, and GW11.5 (Figure S2C and Movie S2). AtGW8.5, most of the hand surface was already covered withnerves whose topography appeared mature by GW11.5. Themiddle and index fingers are particularly interesting given thattheir dorsal surfaces are shared by several nerves. The mediannerve, which normally only arborizes ventrally, projects tothe dorsal side of these fingers. At GW6, the median nerve hadnot yet reached the tip of the index on the palmar (ventral) sidebut started to branch dorsally, ahead of the radial nerve, be-tween future phalanges (Figure S2D). By GW8, the median nervereached the tip of the index finger ventrally and started to cover the dorsal and distal part, whereas the radial nerve only inner-vated the caudal part of the dorsal side of the index finger.This pattern was unchanged at later ages (Figure S2D). Our protocol allows 3D visualization of the development of theperipheral innervation of early human fetal stages (first trimesterof life) at a high level of precision and detail and has revealedseveral unknown features of the development of limb innerva-tion. First, an adult-like pattern of the domains of the skincovered by each nerve is already established during the lateembryonic-early fetal period. However, within each domain,the pattern of nerve branching can be highly divergent not onlybetween individuals but also within the same individual. This isparticularly striking at the level of the hands, where the arboriza-tion of the ulnar and radial nerves significantly differ between theright and left hands. This suggests that the development of thePNS innervation is, at least to some extent, stochastic and notprofoundly influenced by specific guidance cues distributed inthe developing limbs and extremities (Hassan and Hiesinger,2015). Moreover, in digits that are shared by multiple nervesthere is no significant overlap of the branches originating fromthe different nerves. Our data infer that median nerves growfaster and start invading the dorsal part of some digits prior tothe other nerves and that this may prevent them from enteringthese territories. Finally, significant remodeling of the sensoryinnervation occurs. The length of human embryogenesis, ascompared to that of rodents, will facilitate the analysis of tissueremodeling during development. Next, we further validated our method by testing a large pal-ette of antibodies against proteins expressed by many celltypesin developing mouse and human embryos (STAR Methods). 3D Analysis of Human Muscle Development via LSFM The current knowledge of skeletal and head muscle develop-ment in humans is based on histological studies conducted dur-ing the first half of the twentieth century (Gasser, 1967; Gilbert,1957) and immunostaining with a few muscle cell markers (Abeet al., 2010; De la Cuadra-Blanco et al., 2013). The distributionof muscle cell progenitors in the embryo, however, has neverbeen reported. The transcription factor (TF) Pax7, is a musclestem cell marker and key initiator of myogenesis in jawed verte-brates (Bryson-Richardson and Currie, 2008). We observedPax7 immunoreactive nuclei homogenously distributed withineach developing muscle of GW9.5 and GW10.5 arms and legs(Figures 3A and 3B and Movie S3;n=1). As expected, all devel-oping Pax7+ muscles were contacted by ChAT+motor branches(Figure 3B). GW9 leg and arm (n =1) were also triple-immuno-stained for ChAT, Tag-1, and myogenin (Myog), a myogenicTF expressed by differentiating myoblasts (Bryson-Richardsonand Currie, 2008) (Figure 3C and Movie S3). This immunostainingshows that clusters of Myog expressing cells are found at theextremities of each motor nerve branch. Doublecortin (Dcx) is an X-linked gene that encodes a micro-tubule-associated protein (Gleeson et al., 1998; des Porteset al., 1998). Mutations in DCX impede neuronal migration andcause lissencephaly. Dcx may also influence the developmentof the neuromuscular junction in humans (Bourgeois et al.,2015). Dcx immunostaining on limbs at GW8 (n = 1), GW9.5(n=1),GW10(n=1), GW10.5(n=1), and GW13.5 (n=1)showed that developing muscles express Dcx (Figure 3D and data notshown). Sensory nerves were also immunoreactive for Dcx (Fig-ure 3D). Myosin heavy chain (MHC) was previously detected inskeletal, heart, and craniofacial muscles from human fetuses(Abe et al., 2010).Here, we studied the distribution of MHC+muscles throughout the body at GW8-GW14 (Figure 3E andMovie S3; n=9 cases). All muscles in the upper half of a GW8embryo (n= 1) were labeled and identified with an unprece-dented resolution (Figure 3E and Movie S3). Whole-mountMHC muscle staining was also performed on GW11 and GW14arms and legs (Figures S3B and S3C). Developing musclesand motor innervation could be simultaneously visualizedfollowing MHC/ChAT double immunostaining (Figure 3F andnot shown), and importantly, the muscles within each handand foot of a GW9.5 fetus could be segmented (Figures 3F andS3A and S3D and Movie S3). Moreover, the shape of the devel-oping bones, which appear as black areas on optical sections,could also be extracted and visualized in 3D (Figure S3D). 3D Analysis of the Vasculature in Human Embryos Existing data based on the filling of large arteries and veins (Mall,1905), 3D reconstructions of histological sections (de Bakkeret al., 2016), and vascular corrosion casting (Zawilinski et al.,2001) provide an incomplete view of the early development ofhuman vasculature. In chicks and mice, blood vessels arisefrom endothelial cell progenitors (angioblasts), which aggregateto form a dense vascular meshwork covering the embryo, apro-cess known as vasculogenesis (Chung and Ferrara, 2011). Func-tional continuity occurs later through the remodeling of this initialendothelial network. As the embryo grows, new vessels sproutfrom existing ones, in a process called angiogenesis. Here, wefirst performed whole-mount labeling with antibodies againstplasmalemma vesicle-associated protein (Plvap; also knownas PV-1 or PAL-E), a transmembrane glycoprotein expressedby fenestrated microvascular endothelial cells (Elima et al.,2005). Whole embryos at GW8 (n=2) or various organs fromGW9.5-GW14 fetuses (n =8) were labeled and imaged withLSFM. At GW8, an extremely dense Plvap+ vascular networkof endothelial cells extended throughout the body (Figure 4Aand Movie S4), except in developing bones and corneas (Fig-ure 4B and Movie S4). This supports the existence of a phaseof vasculogenesis preceding angiogenesis in human embryos.Among other endothelial cell markers tested, collagen IV also la-bels capillaries, but less efficiently than Plvap (Figure 4C). The 3Dorganization of developing arteries on GW9-GW14 organs (n=6fetuses) were assessed with immunostaining for smooth-mus-cle-specific a-actin (SMA) (Figure 4D and Movie S4). Mammalian lymphatic vasculature development is docu-mented for several species (Yang and Oliver, 2014), but notmuch is known about human lymphangiogenesis (Sabin, 1909).The lymphatic system is crucial for immune response and under-standing its development might allow us to gain some insightsinto some human diseases. To start investigating lymphangio-genesis in human fetuses, we next labeled the gastrointestinaltract of a GW14 fetus with antibodies against the glycoproteinpodoplanin, a lymphatic cell marker (Breiteneder-Geleff et al.,1999; Schuster et al., 2015), and found many isolated podopla-nin+ cells covering the gut and stomach (Figure 4E). Lymphatic Figure 3. 3D Analysis of Muscle Develop-ment in Human Embryos All panels are LSFM images of solvent-clearedembryos and fetuses. (A) Lateral view of the right foot (left panel) anddorsal view of the right hand (right panel) of aGW9.5 fetus labeled for Pax7. (B) Plantar view of a GW10.5 foot labeled for Pax7(blue) and ChAT (Red). (C) Dorsal view of a GW9 foot labeled for Myog,ChAT, and Tag-1. Myog+ nuclei cluster at the tip ofChAT+ motor branches (arrowheads). (D) Dorsal view of a GW9.5 foot double-labeledfor Doublecortin (Dcx) and ChAT. Dcx is found inmuscles (asterisks) and sensory nerves (arrows)but not in ChAT+ motor axons (arrowheads). (E) Images from a GW8 embryo immunolabeled forMHC and Tag-1. Front view (left). High-magnifi-cation view of the oculomotor muscles (uppermiddle panel). The dotted lines mark the bordersof the muscles where the light sheet is weakenedby the pigmented epithelium. Lateral view (lowermiddle panel) of muscles and sensory nerves. Theright panel shows muscles and sensory nerves inthe left arm. (F) GW9.5 hand labeled for MHC and ChATshowing muscles and motor innervation. Muscleswere individually segmented and pseudo colored(see Figure S3A for muscle names), and devel-oping bone contours are visualized (see methods).Abbreviations: SR, superior rectus; LR, lateralrectus; IR, inferior rectus; MR, medial rectus; IO,inferior oblique; SO, superior oblique; Om, oculo-motor muscles; Dia, diaphragm; Bi, biceps; Tri,triceps. Scale bars, 300 um in (A) and (D), 500 um in(B) and(E), 200 um in (C), 400 um in (F). See also Figure S3. 2007). We observed a similar result in human lungs where allterminal bronchial buds were Sox9+ (Figures 5A-5D, 5H, andS4A and Movie S5), whereas Sox2 was expressed in a comple-mentary pattern (Figures S4A and S4D). Strikingly, doublestaining for Sox9 and Dcx, which was not yet reported to bepresent in the lung epithelium, showed that Dcx was also ex-pressed in the proximal epithelial portion of each airway (Fig-ures 5A and 5B). We also visualized in 3D the vasculature ofthe lung with Plvap (Figures 5A-5C and S4B). The small capil-lary plexuses in the lung mesenchyme wrapping around termi-nal buds at GW8 are not isolated but form a continuousnetwork with the larger vessels (Figures 5A-5C and S4B),thereby supporting an angiogenesis mode of lung vasculariza-tion as observed in mice (Parera et al., 2005). The complete reconstruction of the mouse airway lineage re-vealed that the branching pattern is highly stereotyped withnew branches budding according to 3 modes: domain branch-ing (daughter branches form in a row) and planar and orthogonalbifurcation budding (Metzger et al., 2008). We performed such alineage analysis in human wholelungs by using the segmentation B Plyap Plvap CollV No Eye * Mo Figure 4. 3D Analysis of the DevelopingVascular System in Human Embryo All panels are LSFM images of solvent-clearedembryos and fetuses. (A and B) GW8 embryo immunolabeled for Plvap, amarker of endothelial cells. Plvap+cells form a verydense network throughout the embryo. The rightpanels in (A) illustrate the right arm and hand. (B) The left panel is a z projection of 1,400 umthrough the left leg. The vascular network pene-trates all tissues except the developing bones(asterisks). Theright panel is at the level of the face.Note the absence of vessels on the developingcornea (arrowhead). (C) Vessels labeled with collagen Ⅳ at the surfaceof the ribs in a GW11 fetus. (D) Arteries in the right leg/knee and foot of aGW11.5 fetus immunolabeled for MyoSM (left) orSMA (right). The right panel shows the result of thesegmentation and individual colorization of themain arteries of the foot (dorsal view). (E) Image at the level of the digestive tract of aGW14 fetus labeled for podoplanin, a marker oflymphatic cells. Podoplanin cells are found abovethe stomach (Sto) and gut. The right panel showsthat podoplanin+ cells have not yet developed intovessels. Abbreviations: No, nostrils; Mo, mouth; Fem, Fem- orale arteria; Sup Lat Gen, arteria superiori lateralis genus; Pop, arteria popliteal; Pan, pancreas. Scale bars, 1,500 um in the left panel of (A), 500 umin the right and middle panels (A) and in (B), (D),and the left panel of (E), 200 um in (C), and 50 umin the right panel of (E). vagus axons extended to the most distalportion of the airway branches (FiguresS4C and S4D). Preliminary results indi-cate that the development of the vascula-ture of the human heart and its innervation(using immunostaining for Tyrosine hy- of Sox9/Dcx (or Sox9/Sox2) bronchioles (Figures 5D and 5E andMovie S5). We observed three branching modes in humans(Figure 5E), similar to the mouse, but with some evidence ofasymmetric bifurcations (Figure 5E). We next performed immu-nolabeling for smooth muscle markers SMA and myosin smoothmuscle (MyoSM). In both cases, smooth muscles surroundingthe bronchi and the proximal part of airway epithelial tubuleswere labeled (Figures 5F and 5G and S4A). The absence ofsmooth muscles on distal buds was confirmed by using Sox9immunostaining (Figure 5H). Incidentally, smooth muscle stain-ing also allowed to visualization of lung arteries and arterioles(Figures 5F and 5G and Movie S5). The lung is primarily innervated by sympathetic and parasym-pathetic axons traveling through the vagus nerve. Parasympa-thetic ganglia also contribute to the innervation of the tracheaand main bronchi (Aven and Ai, 2013). Due to the complexityof the airway tree, understanding its innervation can only beachieved in 3D. We visualized lung innervation by using immuno-staining against Prph, Tag-1, and BIlI-tubulin. Immunoreactive droxylase) can also be studied with this 3D method (Figures 5land 5K and S4E and Movie S5). 3D Analysis of Urogenital System Development in Human Embryos In adult mammals, the urogenital system is comprised ofthe kidneys, urinary tracts, gonads, and reproductive ducts.Before GW7-GW8, the human gonadal ridges are undifferen-tiated. Genital ducts appear morphologically similar in bothsexes with two paired structures: the Wolffian ducts (WDs),which are derived from the mesonephros, and the Mullerianducts (MDs), whose differentiation is induced and guidedby the WD. A major reorganization of the genital tracts accom-panies sex determination (Jacob et al., 2012;Orvis andBehringer, 2007). In males, MDs regress under the influenceof an anti-Mullerian hormone produced by the testes. Infemales, the WDs degenerate and the MDs transform intothe female reproductive ducts (Georgas et al., 2015; O'Rahilly,1983). Figure 5. 3D Analysis of the Developing Cardiopulmonary System in Human Embryos All panels are LSFM images of solvent-cleared fetuses. (A-E) Left lung from a GW9.5 fetus immunostained for Sox9,Dcx,and Plvap. Sox9 is expressed in the distal bud of the epithelial tubules, whereas Dcx is found intheir proximal part. The entire lung vasculature can be labeled with Plvap. (B) Optical section (250 um z projection) showing one lung epithelial tubule. (C) Illustrates the capillary network (red) at the level of Sox9+ terminal buds (blue). (D and E) 3D Analysis of airway branching. One lung lobe (green and blue) is isolated with Imaris (right panel),and in (D) a single bronchus is isolated (appearingin red). (E) Higher magnification images of the isolated bronchus viewed under two different angles. The rightmost panels illustrate three types of branching patterns. (F) GW9.5 lungs stained for myosin smooth muscle (MyoSM). The two main bronchi (arrowheads) and their ramifications are seen. (G) SMA staining revealing the pattern of airway smooth muscle branching in a GW11.5 left lung. Muscles around arteries (arrowheads) and proximal airways(arrows) are seen. (H) GW10 lung branches. The terminal buds are labeled with Sox9. SMA+ smooth muscles (yellow) are only found around the proximal portion (Sox9-) of thetubules. (I-K) LSFM images of the developing heart. Knowledge of urogenital system development is primarilybased on histological and electron microscopy analysis (Fritschet al., 2012; Hashimoto, 2003) and has not yet been studied at acellular and molecular level in humans, unlike in mice (Georgaset al., 2015; Little et al., 2007). We studied the development ofthe human urogenital system by using antibodies against Pax2TF. Pax2 mRNA was previously detected in the mesonephrosand WD at GW6-GW7 (Tellier et al., 2000). We used embryosand fetuses of either sex, including 11 males (GW8-GW14) and9 females (GW7-GW14). All major components of the urogenitalsystem were visualized in 3D (Figures 6, 7, and S5 and Movie S6)and individually segmented. In the youngest male embryo(GW8), the caudal tip of the MD was in close contact with theWD but had not yet fully elongated (Figures 6A and 6B), andmesonephric tubules stemming from the WD covered the testisprimordium. Kidneys still occupied a ventral position adjacentto the genital ridges (Figure 6A). At GW9.5 (n=1), the MD furtherelongated along the WD but did not yet join (Figures 6C and 6D).In GW10 male fetuses (n =2), the two MD were fused andextended medially between the two WD up to the urogenital si-nus. However, in both cases, the MD started to fragment dorsally(Figures 6E and 6F and Figure S5A), and this remnant of thefused MD might give rise to the prostatic utricle. At older ages,such as GW14 (n = 1), the mesonephric nephrons of the WDhave regressed while the epididymis ducts and vas deferenshave emerged (Figure 6G). As previously reported (Jacobet al., 2012), an apical MD remnant is still present next to therete testis by GW14 (Figures 6G and 6J and Movie S6). Sox9 isessential to testes differentiation in males, and its mRNA was firstdetected around CS19-CS21 (GW7-GW7.5) (Hanley et al.,2000). Using whole-mount immunostaining for Sox9 on GW10,GW11, GW13.5, and GW14 fetuses (n= 1 for each), we visual-ized the 3D organization of the testes cords, containing Sox9+Sertoli cells (Figure 6H and 6J, Movie S6, and data not shown).We also stained GW10.5-GW13 female fetuses with Pax2(n =6) and followed in 3D the reorganization of the urogenitaltract (Figures 7 and S5). In our youngest female fetus (GW10.5)the MD have already fused to form the uterovaginal canal (Fig-ure 7A). The WD were still continuous but mesonephric tubulesbegan to regress. At GW11.5, the regression of the meso-nephros and WD was more pronounced and the length of thetwo MD increased (Figure 7B). At GW13, the distal part of theWD had dissolved whereas its cranial part transformed intothe Fallopian tubes (Figures 7C and S5B and Movie S6). Thevascularization of the developing gonads is thought to play arole in their maturation (Brennan et al., 2002; Coveney et al.,2008). We performed double staining for Pax2 and Plvap to studythe interaction between the vasculature and the genital tracts.Interestingly, at GW8 and GW10, the developing testes andWD were embedded in a dense capillary meshwork but the MD was avascular (Figures 7D and 7E). In contrast, in aGW10.5 female fetus, both the MD and the WD were vascular-ized and a dense vascular network ensheathed the MD byGW13 (Figures 7F and 7G and Movie S6). While we could notstudy younger female embryos, these results suggest that MDangiogenesis may be sex dependent. This differential vasculari-zation of the developing MD in males and females at GW10suggest that their regression in males, which starts around thisstage, could be linked to or facilitated by the lack of vasculariza-tion. By contrast, the WD are vascularized in both sexes.Interestingly, the distal fused part of the Mullerian ducts doesnot seem to regress and likely gives rise to the prostatic utricle,as previously proposed (Jacob et al., 2012). Information on the early development of human nephrons isscarce (Ludwig and Landmann, 2005). Staining of GW10-GW13.5 kidneys (n=5) showed that Pax2 and Sox9 are both ex-pressed in the epithelium of the ureteric tree (Figure S6). Pax2,together with another TF, Six2, was also found in nephron pre-cursors of the cap mesenchyme surrounding the ureteric tipsin the nephrogenic zone of the developing kidney (O'Brienet al., 2016). Staining of the endothelial cells with Plvap revealedthe presence of developing glomeruli and their morphology(Figure S6D). Transcription Factors: New Tools to Study HumanEmbryology During development, cell differentiation toward specific lineagesis controlled by a cascade of transcription factors. We used an-tibodies against 19 transcription factors to follow the develop-ment of multiple organs. In mouse and human embryos, Sox10 is expressed by oligo-dendrocytes, neural crest cells, and some of their derivatives(Betters et al.,2010; Bondurand et al., 1998). SOX10 mutationscause various diseases such as neurocristopathies, melanoma,and peripheral demyelinating neuropathies (Bondurand andSham, 2013). Here, we performed double immunostaining forSox10 and Prph on limbs from five fetuses, at GW9-GW12.Sox10+ cells were widely distributed throughout the PNS, atthe level of the dorsal root ganglia and all along Prph-labelednerves and branches (Figure S7A and Movie S7). TheseSox10+ cells most likely correspond to Schwann cell precursors,which in the mouse migrate along PNS axons (Espinosa-Medinaet al., 2014). In the developing tongue, taste bud primordia and papillaehave been identified at GW9-GW10 by using electron micro-scopy (Hersch and Ganchrow, 1980). No markers of developinghuman taste buds are known. In order to visualize tonguepapillae, we performed immuno-labeling with antibodies againstProx1 and Sox2, both of which control mouse taste bud differen-tiation (Nakayama et al., 2015; Okubo et al., 2006). Both Prox1 (l) GW10 heart vasculature stained with anti-SMA antibodies. ( (J-K) Evolution of the dopaminergic innervation ( TH, t yrosine hydroxylase) o f heart between GW10.5 (J) and GW 1 4 (K). The right panel in ( K) illustrates t hesympathetic innervation (green) on large vessels of the heart ( red). See also Figure S4E . ) ( Abbreviations: R C , ri g ht coronary artery; LC , left coronary art e ry, IV, interventricular artery. ) ( Scale bars, 500 um in (A), (D, left panel),(G, lef t panel), (l), and (J), 1 5 0 um in ( B), (C), (G, right panel),and (K, r ight panel), 200 um in (D, right panel), 50 um in (E),300 um in (F), 1 00 um in (H), and 1,000 um in (K, left panel). ) ( See also Figures S4 and S7. ) Abbreviations: Kid, kidney; MD, Mullerian duct; PU, prostatic utricle; WD, Wolffian duct; 8, male.Scale bars, 400 um in (A), (B), 500 um in (C) and (E), 100 um in (D) and (H, right panel), 300 pim in (F), (G), (H, left and middle panels) and (l), and 350 um in(J).See also Figure S5 and Figure S6. Figure 6. 3D Analysis of the Urogenital Sys-tem Development in Male EmbryosAll panels are LSFM images of solvent-clearedembryos and fetuses. (A and B) GW8 embryo stained for Pax2. RawLSFM image (left) and 3D rendering image (right).The middle panel shows the segmentation andpseudocolorization of the kidney and ureters (yel-low), Mullerian ducts (magenta, MD), and Wolffianducts (cyan, WD; the mesonephric tubules areindicated by an arrowhead). (B) High magnification of the MD/WD junction(arrow). (C and D) Segmented (left) and 3D (right) images ofthe GW9.5 urogenital system labeled with Pax2.(D)The apical tip has enlarged (arrow). The distal tipsof the MD (arrowheads in C and D) have extendedalong the WD (compare with A) but have not yetfused. (E) Segmented (left) and 3D (right) images of theGW10 urogenital system labeled with Pax2. TheMDhave fused distally (arrow) and began to frag-ment (arrowheads). (F) More advanced stage of MD regression andfragmentation (arrowhead) in a second GW10fetus. (G) 3D image of the GW14 urogenital systemlabeled with Pax2.A short fragment O1the Mullerian duct persists (arrowhead) andthe vas deferens (VD) appears more developed(arrow). (H) GW10 testis (Te) labeled with Pax2 (red) andSox9 (green). Sox9+ Sertoli cells are seen in thedeveloping testis cords (arrowheads). (l) Single optical section (2 um z projection)through a GW10 fetus testis labeled for Pax2,Sox9, and Plvap (endothelial cells). The arrow in-dicates the rete testis. (J) GW14 testis labeled for Sox9 and Pax2segmented.The Mullerian (magenta) and Wolffian(cyan) ducts (Pax2+) have been segmented andpseudocolored. and Sox2 were detected in lingual papillae (including circum-vallate papillae) covering the surface of the tongue (Figure S7Band S7C and Movie S7) in a similar pattern, suggesting thatthey are co-expressed in taste bud precursors, as observedin mice. Whole-mount immunostaining for Sox2, which is known to beexpressed by many types of cell progenitors (Sarkar and Ho-chedlinger, 2013), was also performed on other tissues fromGW9.5, GW10, and GW12 fetuses. Strikingly, Sox2 expressionwas detected at the tip of each digit, in a narrow ring of cells lin-ing the edge of the developing nails (Figure S7D and Movie S7).This indicates that Sox2 is a marker of fingernail stem cells in hu-man fetuses, suggesting a role for this TF in nail development.Sox2 was also highly expressed in the ventricular zone of thedeveloping brain (Figure S7E). Finally, we focused on the diges-tive system, which was collected in embryos and fetuses fromGW7 to GW14 (n =13). Staining with Sox9 clearly revealed the3D organization of the developing villi of the gut epithelium where stem cells express this TF (Figure S7F and Movie S7) (Bastideet al., 2007). The enteric nervous system (ENS) has recentlybeen the focus of many studies in part because of its frequentinvolvement in several genetic diseases (Heanue and Pachnis,2007). ENS neurons are derived from neural crest cells, whichcolonize the gut around GW4. Double labeling for Phox2b(paired-like homeobox 2b) and Prph revealed the dense networkof ENS neurons, which formed interconnected clusters coveringthe surface of the gut (Figure S7G and Movie S7). Prph stainingalso revealed the parasympathetic innervation of the digestivesystem (Figure S7G). CONCLUSION Here, we have combined immunolabeling with whole-body andwhole-organ 3D imaging to provide a new comprehensive andunbiased method to study the early development of multiplehuman biological systems. APax2 Figure 7. Comparative 3D Analysis of theUrogenital System Development in Femaleand Male Embryos All panels are LSFM images of solvent-clearedembryos and fetuses. (A) Original LSFM image (left), segmented/color-ized (middle) and 3D (right) images of the urogenitalsystem in a GW10.5 female fetus labeled withPax2. The Wolffian ducts (cyan) are continuousand the Mullerian (magenta) ducts have fused. (B) Genital system of a GW11.5 female fetusstained with Pax2 after segmentation and 3Drendering. The arrow indicates the developinguterus and upper vagina. The Wolffian ducts startto regress (arrowheads). (C) Genital system of a GW13 female fetus stainedwith Pax2 after segmentation and 3D rendering.The size of the future uterus has increased and theWolffian ducts have significantly regressed (ar-rowheads). The right panel is a high magnificationat the level of the apical part of the Mullerian ductshowing the developing fimbriae of the oviduct(arrow). (D and E) Vasculature of the developing gonads.(D) GW8 testis labeled for Pax2 and Plvap. Adense Plvap+ capillary network covers all thetestis (arrow on the left) and the Wolffian duct(WD). By contrast, the Mullerian duct (MD) is notvascularized (arrowheads). The right panel is anoptical section (1.2 um) through the right testisand MD. (E) At GW10, the MD is still devoid of capillaries inmale.(F, G) GW10.5 and GW13 ovaries labeled forPax2 and Plvap. A dense vascular network coversthe ovary (Ov). Unlike in males, both the Mullerian and Wolffian ducts are densely vascularized.Abbreviations:?, female; 3, male; MD, Mullerianducts; WD, Wolffian ducts; OV, ovary.Scale bars, 500 um in (A), (B), and (C, left panel),270 um in (C, right panel), 100 um in (D, middle and right panels), 160 um in (D, left panel), 200 umin (E)-(G). See also Figure S5 and Figure S6. Non-invasive medical imaging of embryos and fetuses in uterohas made remarkable progress. This includes 3D and 4D obstet-rical ultrasonography that can generate holographic images of theembryo (Baken et al., 2015; Pooh et al.,2011) but mostly providesinformation about surface features and cavities, as well as 3D po-wer Doppler, which visualizes the embryo vasculature (Weisstan-ner et al., 2015). In addition, in utero magnetic resonance imagingprovides a good appreciation of the developing CNS in the fetus(Weisstanner et al., 2015) and diffusion tensor imaging (DTI) trac-tography is now used as a prenatal diagnostic of callosal dysgen-esis as early as GW20 (Jakab et al., 2015). While thesetechniquesrepresent valuable tools to visualize the gross anatomy of thefetus, they lack in resolution and are insufficient to resolve the mo-lecular signature of individual cells or to know their organizationwithin organs. Recently, whole-organ histology and 3D-recon-struction analysis based on the digital alignment of embryo sec-tions has been performed (de Bakker et al., 2016), but it isextremely time consuming. Our method, which |preserves the 3D organization of the organs while achieving a great cellular res-olution, is rapid, highly reproducible, and should provide clinicianswith a reliable spatial framework for the correlation of in utero andpostmortem 3D images of embryos and fetuses. The simplicity of this method, its robustness (for example, wecould label endothelial cells in a fresh frozen GW5 embryo keptfor 11 years at -80°C, unpublished data), and its sensitivity willfacilitate its transfer to human embryology laboratories. Its usefor the analysis of embryos and fetuses with genetic diseasesand malformations will improve our understanding of their etiology.Currently, the main limitations of our method are the availabilityof human embryos, the number of antibody combinations(amaximum of four at this time), the compatibility of the antibodieswith our protocol (Table S1) and the storage of large size light-sheet image datasets.Nevertheless, the spectrum of future inves-tigations and applications of this method in the field ofembryologyand fetology are countless. For instance, defining how many cellsgive rise to an individual organ and understanding how cell numbers are regulated during development is essential to under-standing the process of organogenesis. Here, we show thatwhole-mount immunostaining with transcription factors and pro-liferation markers (KI67 and H3P) expressed in specific cell types(such as stem cells and muscle precursors) can be efficientlycarried out in cleared embryos and fetal organs. This opens thepossibility to obtain the number of cells expressing these factors,as well as map their localization in the body and estimate the rateof cell proliferation during the first trimester of human gestation-acritical period for various diseases in which tissue growth isperturbed. The recent surge of Zika virus infection and reportsof its deleterious effects in the brain (Oliveira Melo et al., 2016)has demonstrated how incomplete our understanding of humanembryo development is and how little we know about themechanisms through which pathogens, toxins, and mutationsimpact embryogenesis. Our work shows that it should bepossible in the near future to build a reference 3D atlas of thedeveloping human. As a first step in this direction, all our 3Ddatasets are made available on a dedicated website (https://transparent-human-embryo.com/) that will also serve as a repos-itory for additional embryology 3D data generated from our labo-ratory and others. This reference 3D atlas of the developing humanand specific organs and systems not only represents a powerfuleducational online tool for researchers, educators, and studentsworldwide, but will allow 3D printing of anatomical models fordidactic purposes in health sciences education programs. STAR★METHODS Detailed methods are provided in the online version of this paperand include the following: KEY RESOURCES TABLE CONTACT FOR REAGENT AND RESOURCE SHARING EXPERIMENTAL MODEL AND SUBJECT DETAILS METHOD DETAILS o Tissue Collection and Processing o Sex determination O Bleaching 0 Whole-Mount Immunostaining O Agarose Embedding O Tissue Clearing O Methanol clearing o 3D Imaging and Image Processing o Image Processing 01DATA AND SOFTWARE AVAILABILITY ADDITIONAL RESOURCES SUPPLEMENTAL INFORMATION Supplemental Information includes seven figures, one table, and seven moviesand can be found with this article online at http://dx.doi.org/10.1016/j.cell.2017.03.008. An audio PaperClip is available at http://dx.doi.org/10.1016/j.cell.2017.03.008#mmc9. AUTHOR CONTRIBUTIONS S.A.M., P.G., and F.C. collected, staged, and fixed the embryos and fetuses.M.B. and S.A.M. did the clearing and immunostaining. M.B. and D.G. per- formed the LSFM acquisitions and Imaris data processing. A.C. and M.B.did the figures. A.C., M.B., D.G., and G.C. analyzed the data. A.C. and P.G.wrote the manuscript. All authors corrected the manuscript. ACKNOWLEDGMENTS We thank the midwives of the Gynaecology Department, Jeanne de FlandresHospital of Lille (Centre d'Orthogenie), France, for their assistance and sup-port. We also thank Robin Vigouroux, Reha Erzurumlu, and Peter Kozulin forcorrecting the manuscript, Yorick Gitton and Stephane Fouquet (Institut dela Vision,Imaging Facility) for their help with the database, and OlivierPourquie, Domna Karagogeos, William Stallcup, Carmen Birchmeier, andJean-Francois Brunet for kindly providing some antibodies.Myog and Pax7antibodies were obtained from the Developmental Studies Hybridoma Bank.We are also grateful to Olivier Pourquie, Jose Sahel, Constantino Sotelo,and Nicole Le Douarin for helpful discussions. This work was supported bythe Institut National de la Sante et de la Recherche Medicale (INSERM), France(grant number U1172), Agence Nationale de la Recherche (ANR), France(ANR-14-CE12-0015-01 to P.G., ANR-14-CE13-0004-01 to A.C.). It wasperformed in the frame of the LABEX LIFESENSES (reference ANR-10-LABX-65) supported by French state funds managed by the ANR within the In-vestissements d'Avenir programme under reference ANR-11-IDEX-0004-02. Received: November 18. 2016 Revised: February 23, 2017 Accepted: March 3, 2017 Published: March 23, 2017 REFERENCES Abe, S., Rhee, S.K., Osonoi, M.,Nakamura, T., Cho, B.H., Murakami, G., andlde, Y. (2010). Expression of intermediate filaments at muscle insertions inhuman fetuses. J. Anat. 217, 167-173. ( A ven, L ., and Ai, X. (2013). Mechanisms of re s piratory i n nervation d u ri n g em-bryonic develo p ment. Organogenesis 9, 194-19 8 . ) ( B aken, L. , v an Gruting, I . M.A. , Steeger s ,E.A.P . ,v a n der Spek,P.J., Exalto, N., a nd K o ning,A.H.J . (2 0 15). De s i gn and validation o f a 3D vir t u al r e a l ity desktop s ystem for sonographic length an d v olume measurements in e a rly pregnancy evaluation. J. Cli n. U l trasound 43 , 164 - 170 . ) ( B astide, P . , Darido, C., Pa n nequin, J . , K i st , R., Robine , S., Marty - Double,C.,Bibeau, F . , Scherer,G . , J oub e rt, D., H o l lan d e, F ., e t al . (2007).Sox9 reg ula tes c ell p roliferation and is require d for Paneth cell diff e rentiatio n i n the intes t inal epithelium. J. Cel l Biol. 178,635- 6 48. ) ( B elle, M . , G odefroy, D . , D o m inici, C. , H e i t z-Marchaland, C., Z eli n a, P., H e l l al, F ., Bradke , F. , and C hedotal, A. (2014).A simp l e metho d f o r 3D ana l ysis of im-munolabeled a x onal t r acts i n a transparent nervous system. C e ll R e p. 9 , 1 191-1201. ) ( B etters, E. , L iu, Y. , Kjaeldgaard , A . , Sundstrom, E . , a nd G a rcia-C a stro, M.I.(201 0 ). An a lysis of early h u man n e ural c rest d evelopment. D e v . B i ol. 3 44, 578-592 . ) ( B lechschmidt, E . (1977) . T he Beginnings of H uman L i fe ( New Y o rk , NY : Spri n ger N ew York). ) ( B ondurand,N. , and Sham, M.H. (2 013). Th e role of SOX10 d u ring enteric ne r -vous system development. Dev. Biol. 382, 330-343. ) ( B ondurand, N., K o betz, A., P i ngault, V., Lemort, N ., E ncha-Razavi, F . , C ouly,G., Goeric h ,D.E. , Wegner, M . , Abitbol, M. , and Goossens, M.(1 9 98). Expres-sion of the SOX10 gene during human d evelop me nt. F E BS Lett.432, 1 6 8-172. ) Bourgeois, F., Messeant, J.,Kordeli, E., Petit, J.M., Delers, P., Bahi-Buisson,N., Bernard,V., Sigoillot, S.M., Gitiaux, C., Stouffer,M., et al. (2015). A criticaland previously unsuspected role for doublecortin at the neuromuscular junc-tion in mouse and human. Neuromuscul. Disord. 25,461-473. Breiteneder-Geleff, S., Soleiman, A.,Kowalski,H., Horvat,R., Amann, G., Krie-huber, E., Diem, K., Weninger, W., Tschachler,E., Alitalo, K., and Kerjaschki, D.(1999). Angiosarcomas express mixed endothelial phenotypes of blood and lymphatic capillaries: podoplanin as a specific marker for lymphatic endothe-lium. Am. J. Pathol. 154, 385-394. Brennan,J., Karl, J., and Capel, B. (2002). Divergent vascular mechanismsdownstream of Sry establish the arterial system in the XY gonad. Dev. Biol.244,418-428. Bryson-Richardson, R.J., and Currie, P.D. (2008). The genetics of vertebratemyogenesis. Nat. Rev. Genet. 9,632-646. Casoni, F.,Malone, S.A., Belle, M., Luzzati,F., Collier, F., Allet, C.,Hrabovszky,E., Rasika, S., Prevot, V., Chedotal, A., et al. (2016).Development of the neu-rons controlling fertility in humans: New insights from 3D imaging and trans-parent fetal brains. Dev. 143. Chung, A.S., and Ferrara, N. (2011). Developmental and pathological angio-genesis. Annu. Rev. Cell Dev. Biol.27, 563-584. ( Covene y, D . , C ool,J . , Oliv e r, T., a n d Capel, B .(2008). Four-dimensional anal-ysis of vascularizatio n dur in g primary devel o pme n t o f an organ, the gonad. Proc. Natl. Acad. Sci. USA 1 05, 721 2 -7217. ) ( de Bakker, B . S., de Jo n g, K. H ., H a g oort, J., d e Bree, K. , Besselink , C . T ., de K anter, F . E.C., V e ldh u is, T. , Ba i s, B. , Sc h i ldmeij e r, R., R uij t er, J.M . , et a l. (2016). An i nteractive three-dimensional digital at l as and quan ti tat i ve databaseof human development. S cience 354, a ag0053. ) ( De l a Cuadra- B lanco, C. , Peces- P ena, M .D., Car v allo-de M o raes, L .O. , H er- rera-Lara, M.E . , and M e r ida-Velasco, J.R. (2 013 ). Develop m ent o f t he p latysma m uscle a nd the superficia l musculoaponeurotic system (humanspecimens at 8 -17 weeks of development). S c ientificWorldJ o urnal 2013, 716962. ) ( de s P o rt e s,V., Francis, F . , Pinard,J.M. , Desgue rre , I. , M o utard, M.L. , Sn o eck,l ., Meiners, L. C ., Capron, F . , Cusmai,R., R icci, S., et a l. ( 1998). doublecortin i s t he major gene causing X-linked subcortical l amin a r heterotopia (SCLH). H um. Mol. Genet. 7, 1063-1070. ) ( Dodt, H .U. , L eischner, U. , Schierloh, A., Jahrling, N. , Mauch, C .P . , D eininger,K., Deussin g, J . M ., E der, M . , Z ieglgansberger, W . , a n d Be c ker, K. ( 2007). Ul - t ramicroscopy: t h ree-dimension a l vi s ualization o f neuronal n e t works in t he whole mouse b r ain. Nat. M e thods 4, 331 - 336. ) ( Elima, K ., H entt i nen, T . , I rjala, H ., Salmi , M., and Health, N.P. ( 2005). Molecular i denti f ication of PA L -E, a widely u sed endothelia l c ell m arker. H e matology 106, 1 -24 . ) ( Erturk, A., Mauch,C. P ., H e l lal, F ., F o rstner, F . , Keck,T., B e c ker, K., J a hrling,N. , Steffens, H. , R ichter, M. , H u bener, M . , e t al. ( 2011). Three-dimension a l im-agi n g o f t he unsectioned adult spinal cord t o assess axon r e generation and g lial responses after i n jury. Na t . Med . 18 , 166-171 . ) ( E sp i nosa-Medina, l., Outin, E . , Picard, C.A., Chettouh, Z., Dy mecki , S. , Consa- l ez, G.G., Coppola, E., and B r unet, J. F. (2014). N e urodevelopment. Parasym- p athetic gangli a d erive from Schwann cell precursors. Sc i ence 345, 87- 9 0. ) ( Fritsc h , H., R ichter, E., and Adam, N.(2012). M olecular c h aracteristics and al-terations during earl y development of the human vagina. J . A nat. 2 20, 363-37 1 . ) ( Fuj i moto,T . (2001) . Nishimura's collection of human embryos and related pub - li cations . Congeni t . Anom. ( Kyoto) 41, 67-71. ) ( Galambos, C., and deMello,D.E.(2007). Molecular mechanisms of pulmonary vascular development. P e diatr. Dev. P athol. 1 0, 1 -17. ) ( Gasser, R .F . ( 1967). The develo p ment o f the facial muscl e s i n man. A m . J. Anat. 120,357-375. ) ( Georgas, K . M . , Armstrong, J . , Keast, J.R . , L arkins, C.E., McHugh, K . M .,Southard-Smit h , E .M., C ohn, M . J., B a tou r ina, E ., D a n, H., S ch n eider, K., e t al . (2015) . An illustrat e d anato m ical ontology of the developing mo u se lowerurogenital trac t . Deve lo pment 142, 1893-1908. ) ( Gilbert , P.W. ( 1 957) . The Origin and D evelop me nt of the Human Extr i nsicOcular M uscles.Contrib. E mbryol.36, 59-78. ) ( Gleeson, J . G., Allen , K . M., F o x,J. W . , Lamperti, E.D. , B er k o vic, S., S cheffer, l.,Cooper, E.C., D o byns, W.B. , M i n nerath, S. R ., Ro s s, M. E ., an d Walsh, C.A .( 1998). D oublecortin, a brain - specific gene mutated i n human X - lin k ed lissen-cep h aly and double c o rt e x syndrome, en c odes a put a tive signaling p r otein . Cell 92, 63-72. ) Hanley,N.A., Hagan, D.M., Clement-Jones, M., Ball, S.G., Strachan,T., Salas-Cortes, L., McElreavey, K., Lindsay, S., Robson, S., Bullen, P., et al. (2000).SRY, SOX9, and DAX1 expression patterns during human sex determinationand gonadal development. Mech. Dev. 91, 403-407. ( H ashimoto,R. ( 2 0 03).Dev e lopment of the human Muller i an duct in the sexuallyu n differentiated stage. Anat. Rec.A Discov. M ol. Cell. E vol. Biol. 272, 514 - 519. ) ( Ha ssan, B .A., a nd Hiesinger, P .R. (2015). Beyon d M olecular C odes: S i mpl eR ules to W ire C ompl e x Brains. Cell 1 6 3, 2 8 5-291. ) ( H eanue, T . A. , and P achnis, V. (2007) . Enteri c nervous system development a nd Hirschsprung's disease: advances in ge n e t ic a n d stem cell st u dies. Na t . R ev. Neurosci. 8,466-479. ) ( H ersch , M., a nd Ganchrow, D.(1 9 80). Scanni n g electron microscopy of devel-opin g p apillae on the ton g ue of h uman embryos and fetuses. C hem.Senses 5, 331-341 . ) ( H i s, W. (188 1 ) . Anatomie menschli c her Embryonen ( Leipzig: V ogel). ) ( Jacob, M. , Y usuf, F., and Jacob, H . J .(2012). Development, Differ e ntiation and D erivatives of the Wolffian an d Mullerian Ducts. I n T h e Human Embryo , S. Ya-mada, ed.(InTech), p p. 143-166. ) ( Jakab, A ., K a sprian,G. , Sc h wartz, E., Gr u b er, G.M., Mitt e r, C., Pr a y e r, D.,Schopf, V., and L angs, G . (20 1 5). Disrupted developmental organization ofthe structura l connectome i n fetuses with co rp us callosum agenesis. Neuro-im age 111, 277-288. ) ( K anahashi , T ., Y amada, S. , T a n aka, M . , Hir o se, A., U w a be, C., Kos e , K., Y o - neyama, A . , Takeda, T., and T a kakuwa , T. ( 2016). A N o v el Strategy t o R ev e althe Lat e nt Abnormali t ies i n Human Embr y onic Stages f r om a L a rg e EmbryoCollection. Anat. Rec. ( Hoboken) 299, 8 - 24 . ) ( Ka ragoge o s, D . , P o urquie, C ., K yriakopoulou, K . , T avian , M ., S tallcup, W., P eault, B., and P ourqu i e, O . ( 1997). Expression of the cell adhesion proteinsBEN/SC1/DM-GRASP and TA G -1 defin e s early steps of axonogen e sis in t h e h um a n s pinal c ord. J. Comp . N eurol.379, 4 15-427. ) ( Ke ibel, F . , a n d Elze, C . (1908) . Normentafeln zur E n twi ck lungsgeschichte d e rWirbeltie r e. Achtes H e ft. Des Mensch e n (Jena: Verlag v on Gusta v Fischer). ) ( K eibel, F ., a nd Mall , F. P.(19 1 0).Ma n ual of human embryology, Volume 1 (Ph i l-adelphi a ,London: Lippincott). ) ( King, D .F ., and King,L. A. (1986). A brief h i stori c al note on s t aini n g by hematox-ylin and eosin. Am. J . D ermatopa th ol. 8, 168. ) ( L i ttle, M.H . , Brennan, J. , Georg as , K . , Davie s ,J. A ., Da v idson, D.R . , B al d ock,R . A., Beverdam, A . , B e rtram, J . F . , C apel,B. , C h iu, H.S. , e t a l . (2007). A high-resolution anatomical o ntology of the developing murine g enitourina r y trac t .Gene Expr. P atterns 7, 680-699. ) ( L ocher, H ., F r ij n s, J. H . M ., v an I p eren, L . , de G r oot, J . C.M.J., Hu i sman, M.A. , and C huva de S o usa Lo p es, S.M. ( 20 13). N euro s ensory d e velopme n t and cell fate determinat i on i n the human cochlea. N e ural Dev. 8,20. ) ( L udwig, K.S., and Land m ann, L . ( 2005). Early development of the humanmesonephros. Ana t . Embryol. ( Ber l .) 209 , 439-447 . ) ( M aeda,Y. , D a v e, V., and Whitsett,J.A. (2007). Tr a nscriptional co n trol of l u n gmorphogenesis. P h ysiol. R e v.87, 219-244. ) ( M all , F.P. ( 1905). On t he develop m ent o f t he b l ood-vessels o f the b r ain in t hehuman embryo. A m . J . Anat. 4 , 1-18. ) ( Metzger, R .J., Klein, O. D ., Martin, G.R., and Krasnow, M .A. ( 2 008). T h ebranching programme of mouse lung development. N a ture 45 3 , 7 4 5-750. ) ( Morgan, L . M. ( 2 009). I cons of Life: A Cultural H istory of Hum a n Embryos (B e r -kel e y:U n iversity of California P r ess). ) ( Nakayama,A.,M i ura, H. , O oki, M., and Harada, S. (2015) . During development i ntense Sox2 expression m a rks not only Prox1-ex p ressing ta st e bu d cell b u talso p er ig emmal cell lineages. C ell T issue Res. 359, 7 4 3-753. ) ( Norman, J . R . (1 9 2 3).M e t h ods and techniqu e of reconstructio n . J. R . Microsc. Soc.43,37-56 . ) O'Brien, L.L., Guo, Q., Lee, Y., Tran, T., Benazet, J.-D., Whitney, P.H., Valouev,A., and McMahon,A.P. (2016). Differential regulation of mouse and humannephron progenitors by the Six family of transcriptional regulators. Develop-ment 143,595-608. O'Rahilly, R. (1983). The timing and sequence of events in the development ofthe human reproductive system during the embryonic period proper. Anat.Embryol. (Berl.) 166, 247-261. O'Rahilly, R., and Muller, F. (1987). Developmental stages in human embryos.Carnegie Inst. Washingt. Publ.,637. Okubo, T., Pevny, L.H., and Hogan, B.L.M. (2006). Sox2 is required for devel-opment of taste bud sensory cells. Genes Dev. 20, 2654-2659. Oliveira Melo, A.S.,Malinger, G., Ximenes, R.,Szejnfeld, P.O., Alves Sampaio,S., and Bispo de Filippis, A.M. (2016). Zika virus intrauterine infection causesfetal brain abnormality and microcephaly: tip of the iceberg?Ultrasound Ob-stet. Gynecol. 47, 6-7. ( O rvis, G.D. , and B ehringer, R.R. ( 2007). Cellular mech a nisms o f Mullerian d u c t f ormation i n the mouse. Dev. B iol . 306, 493-504. ) ( P an, C. , C ai, R. , Quacquarelli, F.P. , Ghasemigharagoz, A. , Lourbopoulos, A .,Ma t ryba, P . , P l esnila, N . , D i chgans, M., H e l l a l , F . , an d Ert u r k, A. ( 20 1 6 ).Shrinkage-mediated i m aging of e n t i r e organs and o r ganisms using u D I S CO. Nat. Methods. 13,859-867. ) ( P arera, M .C . , v an D o oren, M. , v a n Kempen, M., de K r ijg e r, R., G ro s ve l d, F.,Tibboel, D ., a nd R o ttier, R . (2005). D istal a ngiogenesis: a new concept forlung v ascular morphogenesis. A m . J . P h ysiol. L u n g C e ll. M ol. P hysiol. 288, L141 - L149. ) ( P ar y sek, L.M., Chisholm, R . L. , L e y, C .A., a nd Goldman,R.D. (19 8 8). A t yp e l lI intermediate f ilament gene is expressed i n mature n eu r ons. N euron 1 , 395-401 . ) ( P ooh, R.K., S h i ota, K . , and Kurjak, A. (201 1 ) . Imag i ng of t he human e mbryowith m agnetic resonance i m aging microscopy and high-resolut i on t r a nsvagi- n al 3-d i mensional s onography: h uman em b ryology in the 21st centur y . Am . J. Obstet. Gynecol . 204,77.e1- 7 7.e16 . ) ( R en i er, N . , Wu, Z. , S imon, D.J., Y a ng, J . , A r iel, P . , a nd Te s sie r -Lavigne , M. ( 2014). i D ISCO: a simple, r apid m ethod t o i m munolabel large tissue sa m ples f or volume imaging. C ell 1 59, 8 96-9 1 0. ) Renier, N., Adams, E.L., Kirst, C., Wu, Z., Azevedo, R., Kohl, J., Autry,A.E., Ka-diri,L.,Umadevi Venkataraju, K., Zhou, Y., et al. (2016).Mapping of Brain Ac-tivity by Automated Volume Analysis of Immediate Early Genes. Cell 165,1789-1802. Richardson, D.S., and Lichtman, J.W. (2015). Clarifying Tissue Clearing. Cell162,246-257. ( Rockich, B.E., Hrycaj, S.M. , Shih, H.P . , Nagy , M.S. , Ferguson , M . A.H. , Kopp , J .L., S ander, M ., Welli k , D.M., and S pence, J . R. ( 2013). S ox9 p l ays m u ltipleroles in the l ung epit h el i um du r i n g b ranching morphog e nesis. Pr o c. Na t l . Acad. Sci. USA 1 10, E4456-E4464. ) ( Sabin,F.R . (1909). The lymphatic system in human e mbryos,with a consider-ation of the morpholog y o f the s ys tem a s a whole. A m . J. A n at. 9 , 43-9 1 . ) ( S ark a r,A., and Hochedlinge r , K. ( 2013). The s ox family o f tra n scription fac t ors:versatile r egulators of stem and progenitor cell fate. Ce l l S t em Cell 12, 1 5-30. ) ( S chuster, C., M ildne r , M., B otta, A ., N eme c , L . , Rogojanu , R. , Be e r, L., Fia l a, C ., Eppe l,W., Ba u er, W., P etzelbauer, P., a n d Elbe-Burger, A .(2015). D ev elop-ment of Blood andL y m p hatic Endothelial Cells in Embryonic and Fetal Human S kin. Am. J. P athol. 185, 2563-2574. ) ( Sparrow, M.P., Weichselbaum, M., and McCray,P. B .(1999). Develo pme nt of t he i n ne r vation and a i r way smooth muscle in human fet a l lu n g. A m . J. Re s pir. Cell Mol. Biol. 20 , 550-560. ) ( T ellier, A.L., Amiel, J . , Delezo i de, A.L., Audollent , S ., Auge, J., E s nault, D . , E n - cha-Razavi, F ., Munnich, A., Lyonnet, S ., Vekemans, M ., a nd Attie-Bitach , T .(2000). Expression of the PAX2 gene in human embryos and exclusion in theCHARGE syndrome. Am. J. Me d. G e net. 9 3,85-88. ) ( U nver Dogan, N . , Uysal,l.l., Karabulut,A . K., S e ker, M . , a nd Zi y lan,T. ( 2 0 10). C ommu n ications between the palmar digital b ranches of the m edian and u l nar n erves:A study in human fetuses and a rev i e w of the li t e rature. Clin. Anat. 23, 234-241. ) ( Weisstanner, C., K asprian, G., Gruber, G.M., B rugger, P .C., and P rayer, D . ( 201 5 ). MRI of the Fetal Brain. C li n . Neuroradiol. 2 5(Suppl 2), 189-196 . ) ( Yamada , S., S amtani, R .R., Lee, E .S., L ockett, E. , Uwabe, C. , S hiota, K. , An- derson, S .A., a n d L o , C . W. ( 20 10). De v elopment a l atl a s of t h e earl y firs t trimester human embryo. D ev. D yn .239, 1585- 1 595. ) ( Yang, Y . , a n d Oliver, G . (2014) . Development of the mammalian l y mphatic v asculature. J. C lin. Invest. 124, 888-897. ) ( Zawilinski, J. , Litwi n , J . A .,Nowogrodzka-Zagorska, M . , Gorczyca, J., a nd M io-donski, A .J. (2001). Vascular system of the human spin a l co r d in t h e pr e natal p eriod: a dye injection and c orrosion casting study. A nn. Anat. 1 8 3, 331-340. ) CONTACT FOR REAGENT AND RESOURCE SHARING Further information and requests for resources and reagents should be directed to and will be fulfilled by the Lead Contact, Dr AlainChedotal (alain.chedotal@inserm.fr). All data have been deposited in https://transparent-human-embryo.com/ and access to the high-resolution movies and imagestacks is regulated via an MTA agreement available online. EXPERIMENTAL MODEL AND SUBJECT DETAILS METHOD DETAILS Tissue Collection and Processing For embryos younger than 8 gestation weeks (GW), the developmental age was assessed using the Carnegie stages (CS)(O'Rahillyand Muller, 1987). Gestation weeks of each embryo or fetus studied were estimated based on the information about: 1) menstrualweeks, 2) morphology, 3) length (crown-rump), 4) craniofacial structures, and 5) position of the tongue. Embryos and fetuses,were fixed by immersion in 4% PFA at 4°C for 1 to 5 days depending on size. For fetuses between GW9-14, tissues were dissectedafter fixation and post-fixed in 4% PFA at 4C overnight. Embryos and fetuses, did not present any malformations. Sex determination Sex determination was obtained by isolating DNA from extracted tissues using lysis buffer containing 0.1mg/ml proteinase K, 5MSodium Chloride, 20% Sodium dodecyl sulfate, 1M Tris, pH 8.0 solution in water and stored at 54°C overnight. DNA was precipitatedwith isopropanol (1:1) and re-suspended in RNase/DNase-free water for 3 hr at 65°C. A PCR was performed in a thermocycler (Bio-rad) using the following steps: 94°C for 3 min and 35 cycles of 94°C for 1 min; 56°C for 30 s; 72°C for 30 s and 72°C for 5 min. Forgenotyping the following primers were used: SRY sense 5'-AGCGATGATTACAGTCCAGC-3'and antisense 5-CCTACAGCTTTGTCCAGTGG-3';FGF16 sense 5'-CGGGAGGGATACAGGACTAAAC-3'and antisense 5'-CTGTAGGTAGCATCTGTGGC-3'. Only20embryos could be assessed, as prior tissue processing prevented DNA extraction for other cases. Bleaching To remove pigmentation and reduce signal-to-noise ratio related to hematomas, the tissue bleaching was carried out (Renier et al.,2014). The samples were dehydrated for 1hr at RT in ascending concentrations of methanol in 1XPBS (50%,80%,100%). The sam-ples were then treated overnight at 4°C with a 6% hydrogen peroxide solution in 100% methanol. The following day, samples werere-hydrated for 1hr at RT in descending concentrations of methanol (100% twice,80%,50%) and washed in 1XPBS during 1hr. Sam-ples were kept at 4°C for further processing. Whole-Mount Immunostaining Samples were permeabilized and blocked by rotation at 70 rpm in 1XPBS containing 0.2% gelatin (Prolabo),and 0.5% Triton X-100(Sigma-Aldrich) (PBSGT) at RT (Belle et al., 2014). For immunostaining, samples were transferred to a solution containing 0.1%saponin (10ug/mL) in PBSGT together with the primary antibodies (listed in the Key Resource Table and in Table S1) and placedat 37°C (Benchmark, Incu-Shaker Mini), with rotation at 70 rpm, for 7 to 14 days depending on tissue size and density. This was fol-lowed by six washes of 30 min in PBSGT at RT. Next, secondary antibodies (listed in the Key Resource Table) were diluted in asolution containing 0.1% saponin (10ug/mL) in PBSGT and passed through a 0.22 um filter. Samples were incubated at 37°C (Bench-mark, Incu-Shaker Mini) in the secondary antibody solution overnight or for 2 days depending on sample size and density. After sixwashes of 30 min in PBSGT at RT, samples were stored in the dark at 4°C in until tissue clearing. The protocol was similar for singleand multiple labeling. Agarose Embedding As previously described (Belle et al., 2014; Renier et al., 2014) small samples were embedded in agarose prior to clearing and pro-cessing with the LSFM. To embed samples, 1.5% agarose (Roth) was prepared in TAE 1X (Invitrogen). Tissue Clearing 3DISCO For all tissue clearing, a modified 3DISCO clearing protocol was used. All incubation steps were performed in dark conditions at RT ina fume hood, on a tube rotator (SB3, Stuart) at 14 rpm, using a 15 mL centrifuge tube (TPP, Dutscher). Samples were first dehydratedin ascending concentrations (50%,80%, and 100%) of tetrahydrofuran (THF; anhydrous, containing 250 ppm butylated hydroxyto-luene inhibitor, Sigma-Aldrich) diluted in H2O. The initial 50% THF bath was done overnight while the 80% and 100% THF incubationswere left for 1.5 hr each. Samples next underwent a delipidation step of 30 min in dichloromethane (DCM; Sigma-Aldrich) followed byan overnight clearing step in dibenzyl ether (DBE; Sigma-Aldrich). The next day, samples were stored in individual light-absorbingglass vials (Rotilabo, Roth) at RT. In these conditions, samples could be stored and imaged for up to 9 months without any significantfluorescence loss. Methanol clearing For large tissues, methanol clearing was used to achieve higher transparency using a modification from the iDISCO+protocol (Renieret al., 2016). Whole embryos (≤GW8) and tissues (>GW8) were dehydrated in methanol/1XPBS series (n=7): 20%,40%,60%,80%,100% x2 for 1 hr each at RT on a tube rotator (SB3, Stuart) at 14 rpm, using a 15 mL centrifuge tube (TPP, Dutscher) covered withaluminum foil to avoid contact with light. Then samples were incubate overnight in 2/3 DCM/ 1/3 Methanol. After 30 min in 100%DCM, samples were transferred to DBE. 3D Imaging and Image Processing 3D imaging was performed as previously described. Acquisitions were performed by using an ultramicroscope l (LaVision BioTec)with the ImspectorPro software (LaVision BioTec). The light sheet was generated by a laser (wavelength 488,561 or 640nm, CoherentSapphire Laser, LaVision BioTec) and focused using two cylindrical lenses. Two adjustable protective lenses were applied for smalland large working distances. A binocular stereomicroscope (MXV10,Olympus) with a 2xobjective (MVPLAPO,Olympus) was used atdifferent magnifications (0.63x, 0.8x, 1x, 1.25x, 1.6×,2x,2.5x,3.2x,4x,5x,and 6.3x). The corresponding zoom factors and numericalapertures are available at http://lavisionbiotec.com/ultramicroscope-ii-specifications.html. Samples were placed in an imaging reservoir made of 100% quartz (LaVision BioTec) filled with DBE and illuminated from the sideby the laser light. A PCO Edge SCMOS CCD camera (2,560×2,160 pixel size, LaVision BioTec) was used to acquire images. The stepsize between each image was fixed at 1 and 2 um. All tiff images are generated in 16-bit. For large samples, a platform was createdusing PDMS (Sylgard) fixed to a sample holder from LaVision. Image Processing Images, 3D volume, and movies were generated using Imaris x64 software (version 8.0.1, Bitplane). Stack images were first con-verted to imaris file (.ims) using ImarisFileConverter and 3D reconstruction was performed using the“volume rendering”function.To facilitate image processing, images were converted to an 8-bit format. To obtain opaque visualizations, the normal shadingview was applied. Optical slices were obtained using the“orthoslicer”tool. To isolate a specific region of the tissue, the surfacetool was used and the mask option was selected. For isolation of smaller structures, i.e., nerve segmentation, the surface toolwas manually applied and each nerve was subsequently pseudo-colored. For the hand, the foot, and the urogenital system, nervesand organs were initially segmented manually and visualized in 3D using the 3D rendering tool. In order to visualize bone structures in3D, skin is artificially removed by segmentation and the contrast is modified using normal shading view. 3D pictures and movies weregenerated using the“snapshot”and“animation”tools. Movie reconstruction with .tiff series are done with ImageJ (1.50e, Java1.8.0_60, 64-bit), titles and transitions addition have been done with iMovie (version 10.1.1). DATA AND SOFTWARE AVAILABILITY Figure S1. Peripheral Innervation of the Tongue and Hand of 3DISCO-Cleared Embryos, Related to Figure 1 All panels are images acquired by light sheet fluorescence microscopy (LSFM) of 3DISCO-cleared embryos and fetuses. (A) GW7 embryo stained for Prph. The left panel is a segmentation of the four nerves innervating the tongue (right side). The trigeminal nerve (V3, mandibularsubdivision) and the chorda tympani of the facial nerve (VIIb or Wrisberg nerve) contribute to the lingual nerve. The two other nerves are the glossopharyngian (IX)and hypoglossus (XII). The right panel is a ventral view of the tongue. (B) Dorsal views of the tongue in a GW9.5 fetus labeled for Prph (left) and ChAT(right). (C) Dorsal view of the left hand at GW8.5 labeled for Tag-1 (sensory nerves) and ChAT (motor nerves). All nerves (ulnar, median, and radial) are shown on the upperpanels. The lower panels represent the ulnar, the median, and the radial nerves of the hand individually. The ulnar and the median nerves are comprised of bothsensory and motor axons. (D) LSFM images of a GW11 right hand labeled for Prph after segmentation and pseudocolorization. The median (magenta), radial (blue), and ulnar (green) nervesare shown together. From left to right, images correspond to a counterclockwise rotation of an angle indicated on the panels from the dorsal view position onthe left. Scale bars, 500 um in A (left panel), 300 um in A (right panel) and B, 200 um in C. Figure S2. Development of Sensory Nerve Branches in the Human Hand, Related to Figure 2 (A and B) LSFM images after segmentation and 3D rendering of the innervation of GW6-GW9.5 embryos (dorsal views). The upper panels are mirror images of left hand nerves and the lower panels show right hands from the same individuals. Red arrowheads indicate branches found uniquely in one of the hands.(A) At GW6, the median nerve branches (magenta) are very similar in both the right and the left hand whereas the radial (blue) and ulnar (green) nerves have distinctbranching patterns between the left/right hands. (B) Radial nerves at GW7, GW8, and GW9.5. Some branches are only found in either the left or right hands. ( ( C) Dorsal and palmar 3D views of GW6, GW8.5, and GW11.5 right hands in which the surface of the skin overlaying the radial (blue), ulnar (green), and medi a n(magenta) nerves have been pseudo-colored. ) ( (D) Side views illustratin g the development of the innervation of the medial (magenta) and radial (blue) nerves in th e right index finger at GW6, GW8, GW9, a n d GW11. Short arrows indicate the dorsal branches of the median nerve that extend ahead of the radial nerve and arrowheads the border between, the radial andmedial nerves. ) Scale bars, 200 um in C (left), 300 um in C (middle), and 1,000 um in C (right). Plantar interossei Figure S3. Segmentation of the Musculature in Human Embryos, Related to Figure 3 All panels are LSFM images of 3DISCO-cleared embryos and fetuses. (A) Palmar view of the left hand in a GW9.5 fetus labeled for MHC. Each panel shows the segmentation of individual muscles or group of muscles. (B) Dorsal view of the right foot of a GW11 fetus labeled with antibodies against MHC and Tag-1.Muscles (magenta) and sensory nerves (green) can be seen. (C) Dorsal view of the muscles of the right hand of a GW14 embryo labeled for MHC. (D) Dorsal and plantar views of the right foot of a GW9.5 fetus labeled for MHC. All muscles have been individually segmented, pseudo-colored and bonescontours were extracted from LSFM images. Abbreviations: I-V, toes. Scale bars, 400 um in A,B, 1000 um in C, 500 um in D. Sox2 Sox2Sox9 Sox2 Sox9 Right Lung Heart Figure S4. Development of the Cardiopulmonary System in Human Embryos, Related to Figure 5 All panels are LSFM images of solvent-cleared embryos and fetuses. (A) Left lung from a GW14 fetus immunostained for Sox2, Sox9 and SMA. Sox2 is expressed along the airway tubules except in the distal buds which only expressSox9. SMA+ smooth muscles ensheathe the Sox2+ epithelium (arrowheads) but not the Sox9+ buds. The right panel is an optical section (3 um z projection).(B)Vasculature of the lungs from a GW8 embryo labeled for Plvap. (C) Innervation of the lungs from a GW9.5 fetus labeled with anti-Prph. The vagus nerves (arrows) send branches along the lung airways. The lungs and theirinnervation have been segmented and pseudo-colored in green. (D) Innervation of the airway branches in a GW14 fetus, visualized with immuno-histochemistry with anti-BIlI tubulin and anti-Sox2. BIII-tubulin+ axons extendalong the Sox2+ epithelial tubules to the level of the distal epithelial buds (not labeled with Sox2). (E) Dopaminergic (TH) innervation of the heart of a GW14 fetus. The large vessels are labeled with anti-SMA (see also Figure 6K). Scale bars, 1,000 um in A and C (left panels), 200 um in A (middle panels), 100 um in A (right panel), 400 um in B, 300 um in C (right panel) and D, 1,200 um inE. A Figure S5. Development of the Mullerian and Wolffian Ducts in Male and Female Human Embryos, Related to Figure 6 and Figure 7All panels are LSFM images of the genital tracts of solvent-cleared embryos and fetuses labeled with Pax2 antibody, segmented and pseudocolored.All imagesare at the same magnification. (A) In males the Mullerian duct (MD) extends ventrally along the Wolffian duct (WD) and fuses with the opposite MD around GW9.5. The MDs then degenerateexcept the fused domain that will become the prostatic utricle. (B) In females, the MDs fuse to form the uterus and vagina and the WDs regress. Scale bars, 400 um in A and B. Figure S6. LSFM of the Developing Human Kidney, Related to Figure 7 All panels are LSFM images of 3DISCO-cleared fetuses. (A and B) GW11.5 kidney labeled for Sox9, Pax2 and MyoSM. Sox9 and Pax2 are expressed in the developing kidney (Kid) but are absent from the suprarenalgland (SG). MyoSM labels arteries vascularizing the kidney. (B) Is a single optical section (1 um) through the cortex. Sox9 and Pax2 are expressed in the distal part of the ureteric buds (arrowheads). Pax2 is also expressed inthe cap mesenchyme and developing nephrons (arrow). (C)A GW11 kidney labeled for Pax2 and Six2. Both TFs are expressed in developing cap mesenchyme surrounding ureteric tips and renal vesicles (arrowheads).(D) Single optical section (2 um) through the kidney of a GW13.5 fetus labeled for Plvap, Six2, and Pax2. Six2 and Pax2 are co-expressed in the cap mesenchyme(arrowheads) but Pax2 is also expressed in tubules. Plvap staining shows the dense renal capillary network and glomeruli primordia (arrows). Scale bars, 500 um in A,50 um in B, 180 um in C, and 70 um in D. ( Figure S7. Transcription Factor Expression i n Human Embryos, Related to Fi gure 5 ) All panels are LSFM images of solvent-cleared embryos and fetuses. ( (A) GW9 and GW12 fetuses labeled for Sox10 and Prph. The left and middle panels illustrate Sox10+ cells at the level of the spinal cord (Sc) and dorsal root ganglia(Drg). The right panel shows Sox10 cells (including Schwann ce l l precursors) migrating along sensory nerves in th e foot. ) ( (B) Tongue of a GW9.5 fetus labeled for Prox1 a nd Tag-1. Prox1 is e xpressed b y taste bud cell precursors and Tag-1 by s e nsory axons. ) ( (C) Tongue of a GW10 fetus labeled with Sox2 antibodies. The patt e rn of developing Sox2+ taste buds is seen. ) ( (D) Sox2 and P r ph immunostaining of the index of aGW12 embryo . Sox2 is found in a narrow ring of cells (arrowheads) at the base of the presumptive finger nails(Prph stains sensory nerves). The right image is a higher magnification of t he Sox2 cells. ) ( ( E) Sox2 s t aining of a G W 9 hindbrain. Sox2 is hig h l y expressed in progenitors of the ventricular zone lini n g the Ivth ventricle (IV) and cerebellum (Cer).(F) Sox9 immunostaining of the intestine of a GW11.5 embryo labeled for Sox9 . Sox9 is highly expressed in the epithelium of the developing villi. The up p er right ) ( panel is a high mag of intestinal villi. The bottom right p a nel is a 3.5 um z projection. ) ( (G) Whole-mount staining for Phox2b and Prph o n a G W13 gut. The d e nse network of Phox2b im m unoreactive enteric neurons is shown and th e ir P r ph+connections. The va g us ner v e innervating the gut is also seen (arrow). ) ( Scale bars, 150 um in A, 80 um in B,500 um in C, E, F (left panel), 300 um in D (left panels), 50 um in D (right panel), 100 um in F (right panels), 800 um in G (left panel,200 um in G (middle panel), 70 um in G (r i ght p a nels). ) Belle et al., Cell elPressCrossMark March C Elsevier Inc.http://dx.doi.org/j.cell. Cell March C Elsevier Inc. CrossMark LaVision BioTec 光片照明显微镜 1. 最新文献简述——Tridimensional Visualization and Analysis of Early Human Development 虽然经过几个世纪的研究,人类的生长于发育过程中仍遗留有很多的未解之谜。人类胚胎发育的研究始于20世纪,一般以观察胚胎的组织图像的方式来研究如器官发生的机制等,传统的方式如切片一直使用至今。现今,对于胚胎3D图像的数字化构建也已经开始,使用核磁共振、X光摄影等方法均可获得胚胎的3D图像,但分辨率仍无法达到细胞水平。 本研究使用了妊娠期6-14周的胚胎和胎儿共36个,结合免疫染色、3DISCO组织透明技术和光片照明技术,获得了人类胚胎细胞级分辨率的3D图像,清晰地显示了胚胎的外周神经、肌肉、血管、心、肺和泌尿系统。通过这种方法,我们可以建立人类生长发育的图库,研究人类胚胎发育的分子机制。 3D图像示例: 1) 周围神经系统3D成像(使用中间纤维外周蛋白(Prph)的抗体标记Prph):(A)7周龄胚胎的表面造影图像(左);对Prph进行标记所得图像。(B)8周龄胚胎的表面造影图像(灰色)和标记Prph所得图像(绿色)的叠加图像。(C)8周龄胚胎的面部神经分布。表面造影图像和标记Prph所得图像的叠加(中)(右)。 感觉神经轴突和运动神经轴突在手脚的分布:分别使用胆碱乙酰转移酶(ChAT)和瞬态粘附糖蛋白-1(Tag-1)的抗体来标记。(D)在外周神经,染色产生重叠现象,但在末端Tag-1(绿色)更为明显。(D-F)ChAT染色与Prph和Tag-1均无重叠。(D)9.5周龄的拇指,标记Prph和Tag-1。染色发生重叠,但在末端区域Tag-1更显著。(E)9.5周龄的左手,ChAT与Prph表达区域不同。(F)9周龄的右脚,ChAT与Tag-1表达区域不同。(G)7周龄的头部,标记Prph显示颅神经。(右)对颅神经分布使用Imaris软件进行3D虚拟解剖、区分并着色。 2) 手足的神经分布的3D成像: 对Prph和Tag-1进行免疫染色以建立胚胎和胎儿手部的感觉神经及其分支的3D图像,并可观察感觉神经随时间推移的发育情况。(A)8周龄标记Prph的右手,感觉神经分为尺骨神经、正中神经和桡神经。(B)右手从7周龄到11周龄的神经分布随时间的变化。肌皮神经(指针处)很快便延长深入手部。 之后分别对ChAT和Tag-1标记,建立了运动和感觉神经的分布的图像,以确定两种神经在何处以何种方式分离。(C)(D)9周龄的右脚和8周龄的左手的感觉神经和运动神经的3D图像。 3) 对肌肉生长进行3D成像分析: 转录因子Pax7是有颌下门动物的肌肉干细胞标记物,是肌肉生成的关键启动因子。在肌肉的生长中,表达Pax7的细胞均匀分布于生长中的肌肉,表达肌细胞生成素(Myog)的细胞成簇分布于运动神经末端。生长中的肌肉表达了双皮质素(Dcx),可能影响神经肌肉接点的发育。(A)9.5周龄标记Pax7的右脚和右手。(B)10.5周龄标记Pax7与ChAT的右脚(C)9周龄标记Myog、ChAT和Tag-1的右脚。表达Myog的细胞成簇分布于运动神经分支末端。(D)9.5周龄的左脚标记Dcx与ChAT。Dcx在肌肉(*号)和感觉神经中检测到,但在运动神经轴突中未检测到。(E)8周龄标记MHC与Tag-1的胚胎。(中上)动眼肌肉的图像。点状线标示出了肌肉的分界线,此处照明被色素上皮所减弱。(中下)肌肉与感觉神经。(右)左臂的肌肉与感觉神经。(F)9.5周龄标记MHC与ChAT的左手,显示了肌肉与运动神经。使用不同颜色对肌肉进行了区分,同时能够观察到正在发育的骨骼。 4) 人类胚胎脉管系统的3D成像分析: 质膜膜泡关联蛋白(Plvap)是一种由网状微血管内皮细胞表达的跨膜糖蛋白。对整个胚胎标记Plvap并成像,可以观察到致密的血管网络。对平滑肌表达的α肌动蛋白(SMA)进行免疫染色可以观察到生长中的动脉的3D结构。(A)(B)8周龄标记Plvap的胚胎。Plvap在整个胚胎中形成了致密的网络。(A中、右)右臂与右手。(B左)左腿的Z轴投射图像。(*号)血管网络穿过了除了骨骼的所有组织。(B右)面部图像。(箭头)角膜处没有血管。(C)11周龄胎儿,标记胶原IV的肋骨表面。(D左)11.5周龄胎儿的右腿和右膝,标记MyoSM的动脉。(D右)11.5周龄胎儿的右脚,标记SMA的动脉。对胃肠道的淋巴细胞表达的Podoplanin进行标记以研究淋巴管形成,表达Podoplanin的细胞覆盖了肠胃,而含Podoplanin的微管数量较少,说明人类淋巴系统成熟可能晚于血管系统。(E)14周龄标记Podoplanin的消化道。表达Podoplanin的细胞位于肠胃上方。(右)表达Podoplanin的细胞尚未发育形成淋巴管。5) 肺的生长发育的3D分析: 标记鼠的性别决定基因Sox9转录因子和Dcx,观察到Sox9在人的末端支气管芽处表达,Dcx在每个气道的近端上皮部分表达。用Plvap标记肺部的血管,发现肺间质内微血管和大血管形成了连续的网络。肺部气道的分支方式是高度保守的,包括域分支、水平分支和垂直分支,使用Sox9/Dcx标记小支气管,可以观察到3种分支方式,并发现了不对称分支现象。(A)9.5周龄标记Sox9、Dcx和Plvap的胎儿的肺部。Sox9在上皮小管的末端表达,Dcx在近端表达。Plvap在整个肺的血管中表达。(B)肺上皮小管Z轴光学切面。(C)末端的微血管网络。(D)气道分支的3D图像。肺叶(蓝绿),支气管(红)。(E)支气管的3D图像。(右)三种分支方式。 标记SMA和平滑肌肌凝蛋白(MyoSM),两者均于围绕支气管和气道上皮小管的平滑肌处表达。标记Sox9显示出末端没有平滑肌。对平滑肌进行染色同时可以显示动脉和微动脉。可以使用SMA和酪氨酸羟化酶(TH)标记心脏来观察血管和神经分布。(F)9.5周龄的标记MyoSM的肌凝蛋白平滑肌的染色。(箭头)支气管及分支。(G)11.5周龄的左肺标记SMA显示出气道平滑肌的分支方式。(箭头)动脉周围肌肉和(指针)近端气道周围肌肉。(H)10周龄的肺的分支图像。末端芽部用Sox9标记。表达SMA的平滑肌分布于不表达Sox9的近端区域。(I-K)心脏的光片显微图像。6) 泌尿生殖系统发育的3D分析: 人类生殖道分为两种结构:由中肾分化而来的中肾管(WD)和由中肾管诱导分化而来的副中肾管(MD)。性别决定伴随着生殖道的重构。Pax2转录因子可用于标记中肾和WD。 8周龄的雄性胚胎中,MD尖端与WD紧密接触但并未完全生长。肾处于腹侧位置邻接生殖嵴。9.5周龄时MD继续沿WD延伸但并未连接。10周龄时两条MD连接,从两侧WD的中间延伸至泌尿生殖窦,同时开始降解,融合的剩余MD分化为前列腺囊。14周龄时,WD的中肾肾小管退化,附睾与输精管出现。Sox9是睾丸分化的必需因子,在睾丸索中表达,对Sox9使用免疫染色可以观察到睾丸索。(A)8周龄标记Pax2的胚胎。(B)(箭头)MD/WD连接。(C)(D)9.5周龄的泌尿生殖系统。(箭头)MD尾端沿WD延长但仍未融合。(E)10周龄的泌尿生殖系统。MD在底端融合(指针)并开始降解(箭头)。(F)降解的继续。(G)14周龄的泌尿生殖系统。输精管进一步发育(指针)。(H)10周龄标记Pax2和Sox9的睾丸。(I)10周龄标记Pax2的睾丸。(J)14周龄的睾丸。 10.5周龄的雌性胎儿,MD已经融合形成子宫阴道管。WD保持连续,但中肾小管开始降解。11.5周龄时WD和中肾的降解更加显著,两条MD延长。13周龄,WD末端已溶解,首端变为输卵管。发育过程中伴有性腺的血管新生。8周龄和10周龄的雄性胚胎和胎儿中,发育的睾丸和WD被致密的微血管所覆盖,MD则没有。而在10.5周龄的雌性胎儿中,MD和WD均已形成血管,13周龄时血管已紧密覆盖了MD,由此可知MD血管新生可能是性别相关的。雄性MD的降解可能与血管形成不足有关。(A)10.5周龄标记Pax2的泌尿生殖系统。WD连续,MD已融合。(B)11.5周龄标记Pax2的生殖系统。(箭头)WD开始降解。(C)13周龄,标记Pax2的生殖系统。(箭头)子宫大小增加,WD显著降解。(右)MD顶端发育中的输卵管纤毛。(D)8周龄标记Pax2和Plvap的睾丸。(指针)微血管覆盖了睾丸和WD。而MD却没有血管形成。(E)10周龄的雄性胎儿中,MD没有微血管形成。(F)(G)10.5和13周龄标记Pax2和Plvap的卵巢。WD和MD均有致密的血管覆盖。 总结:将免疫标记与3D成像技术结合,能够完好地保存器官的3D结构并使分辨率达到细胞水平,简单、快速、稳定、可重复,以上这些优势适合其应用于胚胎学,可用于研究遗传疾病或畸胎。 此方法的限制条件主要在材料的获得,同时使用得抗体最大数量,抗体与实验方法的兼容性和大容量数据的存储。然而其应用的广泛程度依然不可限量。以后甚至可用于建立人类生长发育的3D图库。 2. 产品更新——光片显微镜专用折射率修正物镜 对组织进行透明化需要注意,不同的透明化方式制作的样本折射率不同,需要使用相应折射率的成像液。为获得最佳的图像质量,物镜需要对特定折射率的样本进行优化。LaVision针对这一点开发了适用于不同折射率的物镜,能够应对各种透明化方式。 LWDO系列 LWDO系列物镜的工作距离更长,适用折射率:1.45-1.57。 物镜放大倍数折射率范围工作距离[mm]数值孔径LWDO 2x2x1.45 - 1.57120.14LWDO 4x4x1.45 - 1.57100.28LWDO 20x20x1.45 - 1.575.50.45 LWDO2x LWDO4x LWDO20xLVMI系列 LVMI系列的数值孔径更高,适用折射率范围较大:1.33-1.57 物镜放大倍数折射率范围工作距离[mm]数值孔径LVMI-Fluor 1x1.3x1.33 - 1.5790.1LVMI-Fluor 4x4x1.33 - 1.575.60.3LVMI-Fluor 12x12x1.33 - 1.578.5 - 10.50.53 LVMI 1x LVMI 4x LVMI 12x3. 厂商活动——用户交流会 LaVision将在2018年3月20-22日于德国埃森的"Haus der Technik"开展UltraMicroscope光片显微镜用户交流会。诚挚邀请UltraMicroscope的用户、潜在用户以及所有感兴趣的人前来参加。 会议内容包含讲座与讨论,并与实际演示与Workshop结合: 主持人: Matthias Gunzer, Professor and founding director of the Institute of Experimental Immunology and the Imaging Center Essen Anthony Squire, Imaging Facility Manager, IMCES -Imaging Center Essen 演讲人: Friedemann Kiefer,European Institute for Molecular Imaging, Münster Nicolas Renier, Institut du Cerveau et de la Moelle épinière - ICM, Paris Serge van de Pavert, Centre d’Immunologie de Marseille-Luminy Thomas Stroh, Director MNI Microscopy Unit, McGill University, Montreal Tobias Pietzsch, Max Planck Institute of Molecular Cell Biology and Genetics, Dresden Workshop: Hands-on ECi – IMCES 介绍ECi透明化方法并使用UltraMicroscope成像。(限14人参加)。 Aqueous buffer based clearing 讲解水溶性液体透明化方法中的步骤与难点。 iDISCO workshop 详细讲解iDISCO透明化技术。 UltraMicroscope 展示光片显微技术的发展并解答问题,话题包括上样、成像模式、仪器调整与维护。 Imaris 介绍Imaris软件并在工作站上实践各种功能,包括分割与细丝追踪等。 ImSpector 展示ImSpector软件的新功能,讲解新功能的使用及如何应用于用户的研究,并解答问题。 想了解交流会详细信息及注册参会,请点击:http://www.lavisionbiotec.com/usermeeting/ 厂商联系方式:LaVision BioTec GmbHAstastr. 1433617 BielefeldMail: usermeeting@lavisionbiotec.comTel: +49 / 521 91 51 39 0 您也可以联系我们咨询相关信息。 我们Quantum量子科学仪器贸易(北京)有限公司作为LaVision BioTec GmbH在中国区域的独家合作伙伴,我们将持续为广大科研用户提供最新的产品应用案例和技术前沿信息,有问题您也可以随时联系我们。Quantum量子科学仪器贸易(北京)有限公司座机:010-85120277 | 传真:010-85120276 | 主页:http://www.qd-china.com | 邮箱:info@qd-china.com北京市朝阳区霄云路36号国航大厦3层0306-0308室, 100027上海市静安区威海路511号上海国际集团大厦1405室,200041广州市天河区珠江新城华强路2号富力盈丰大厦1216室 510623
确定
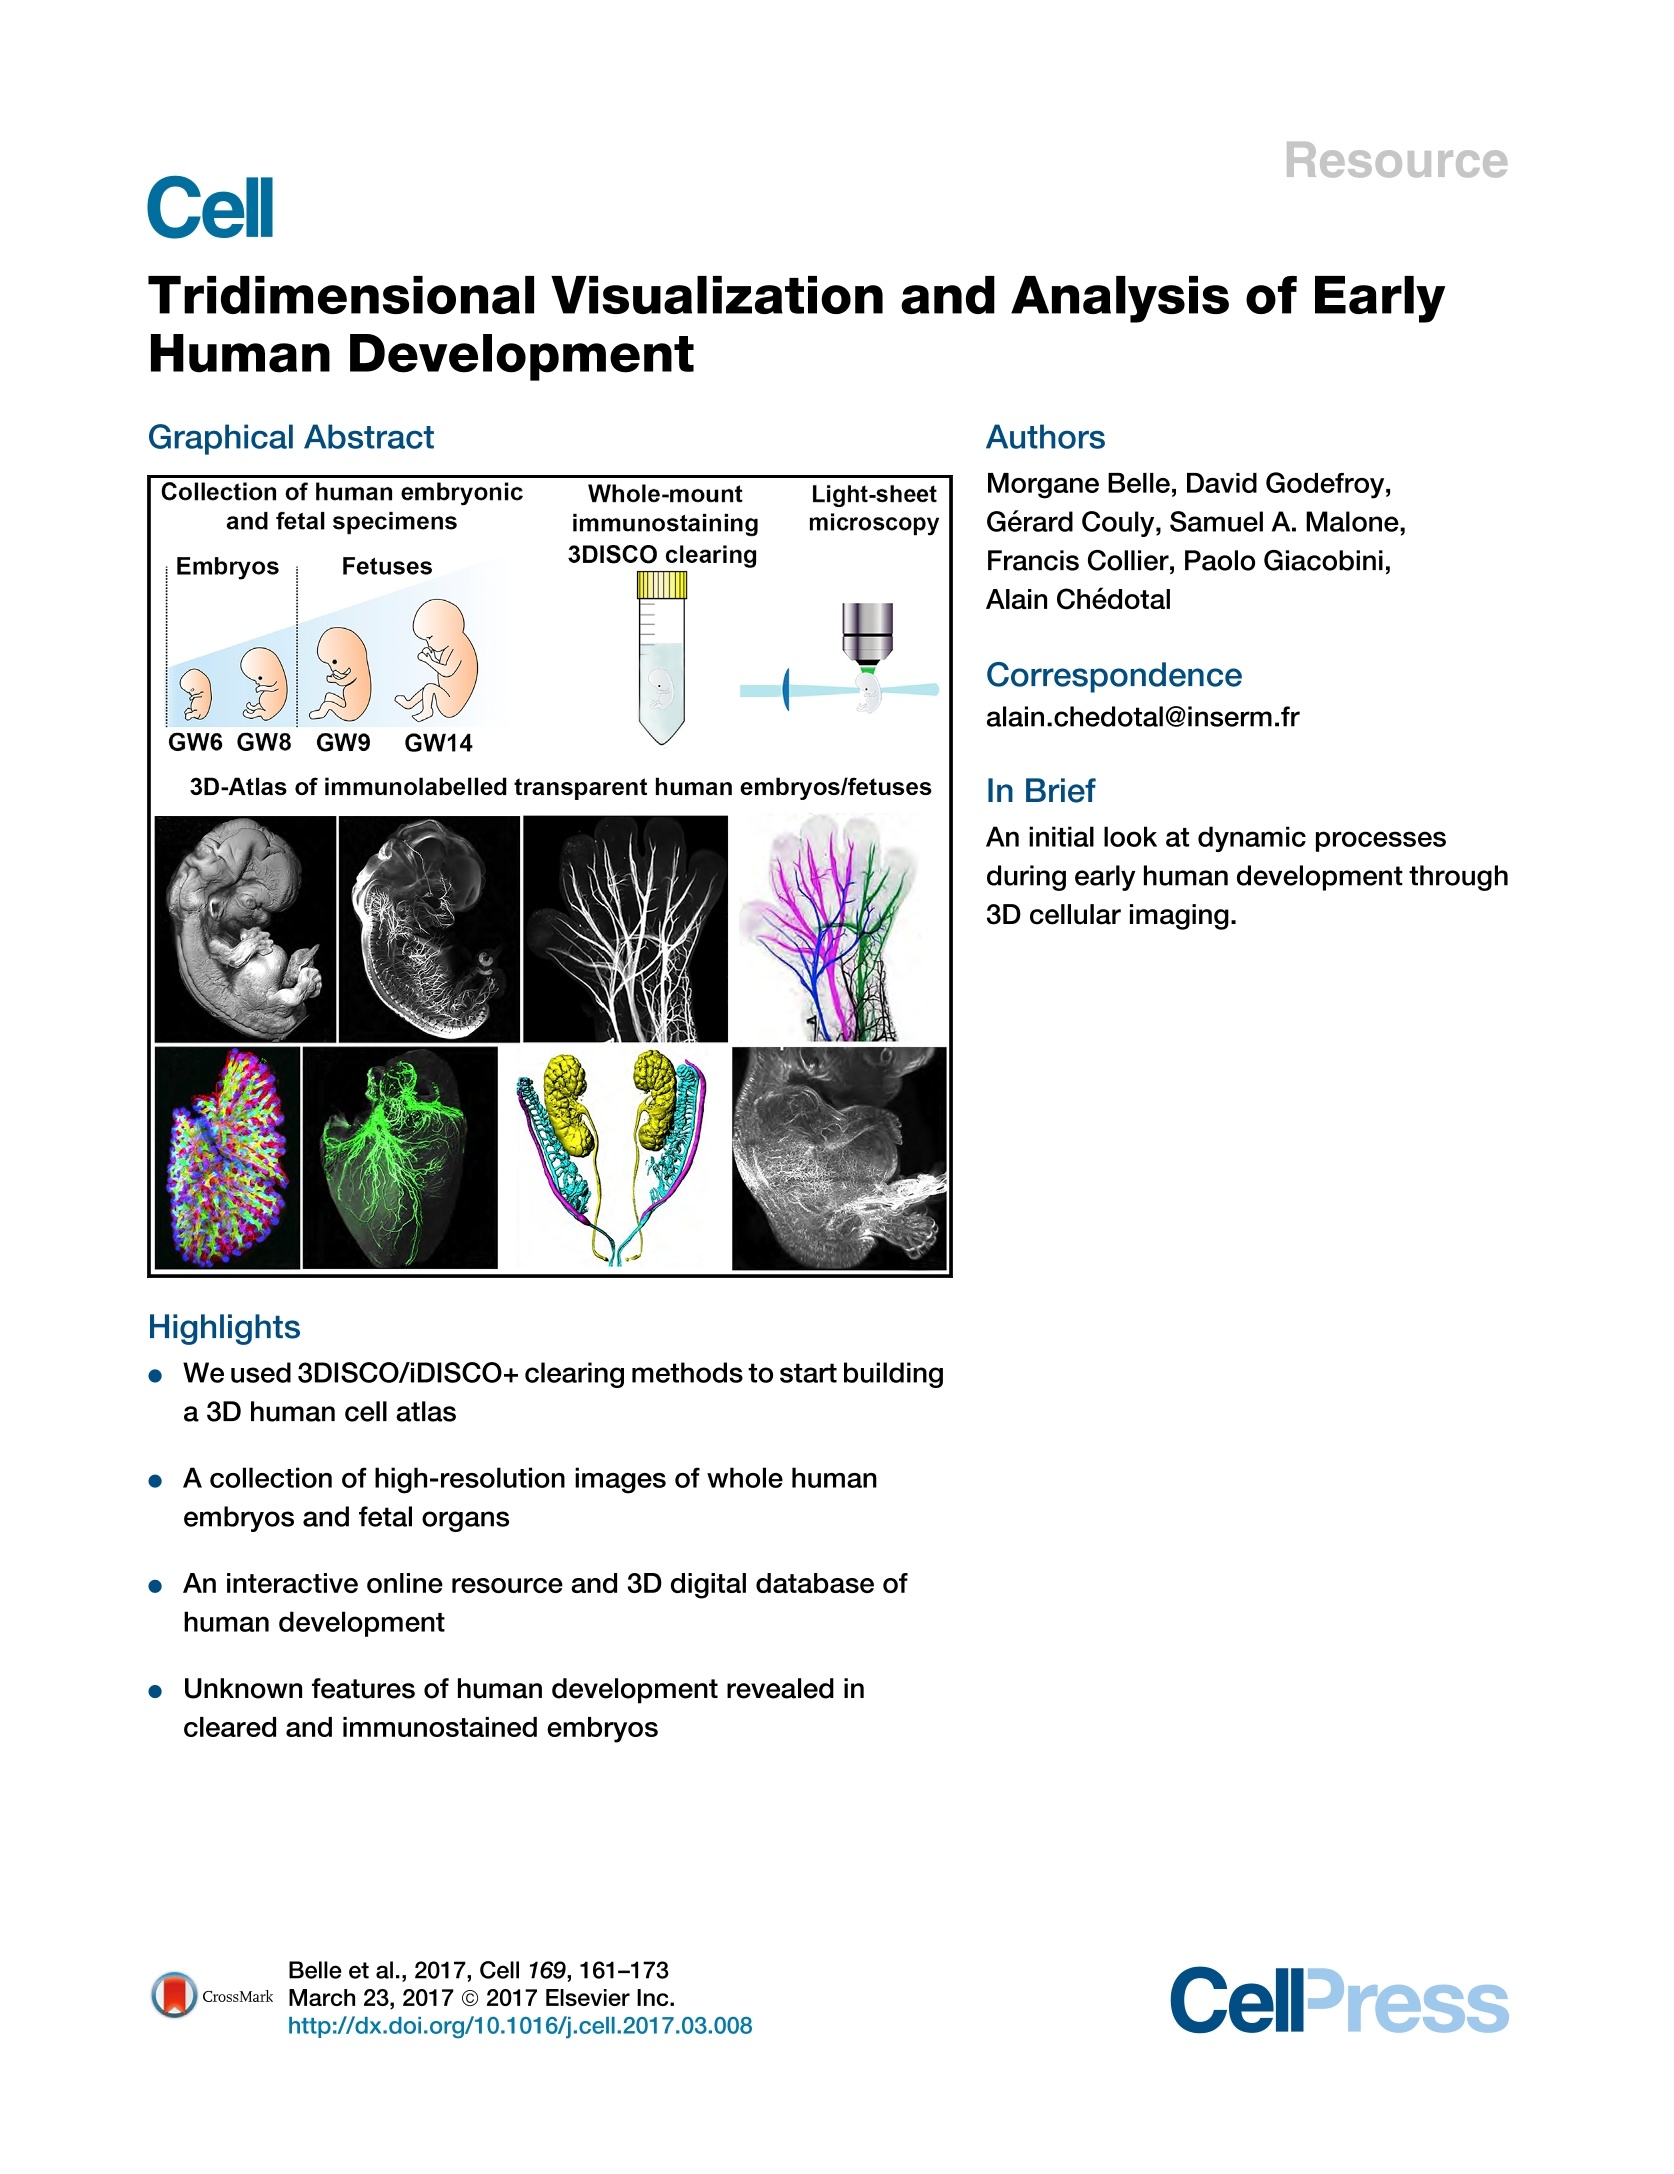
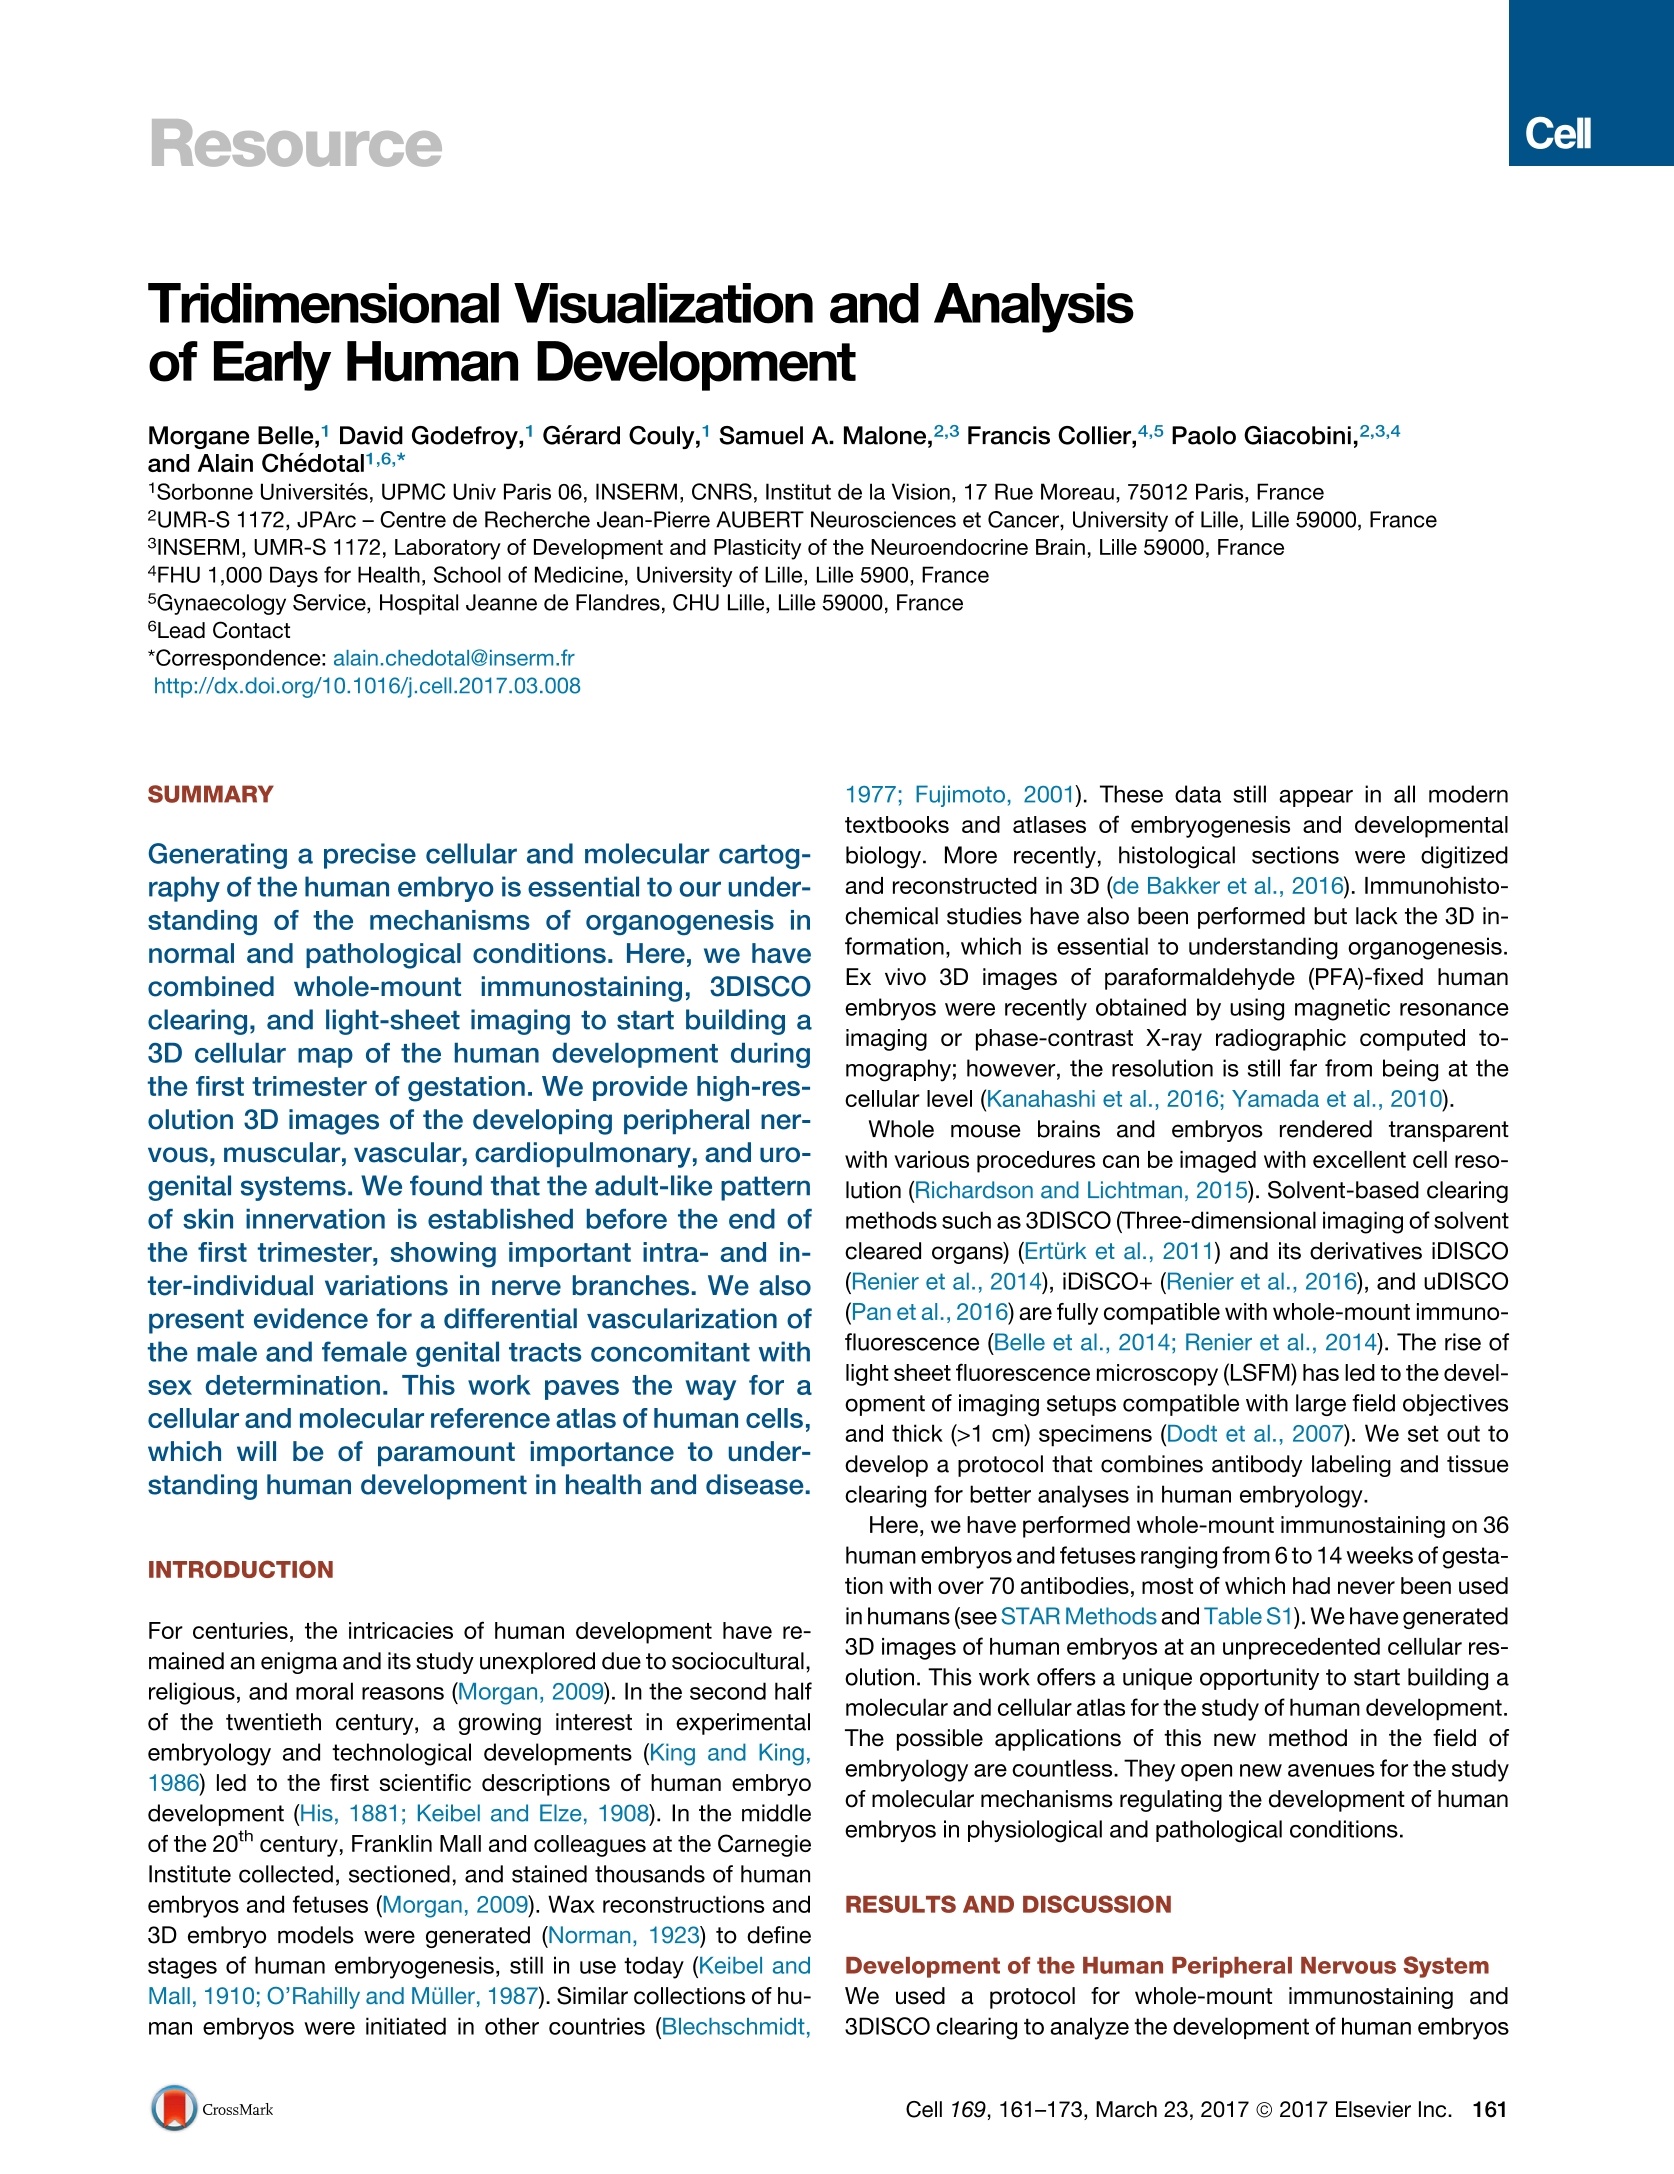
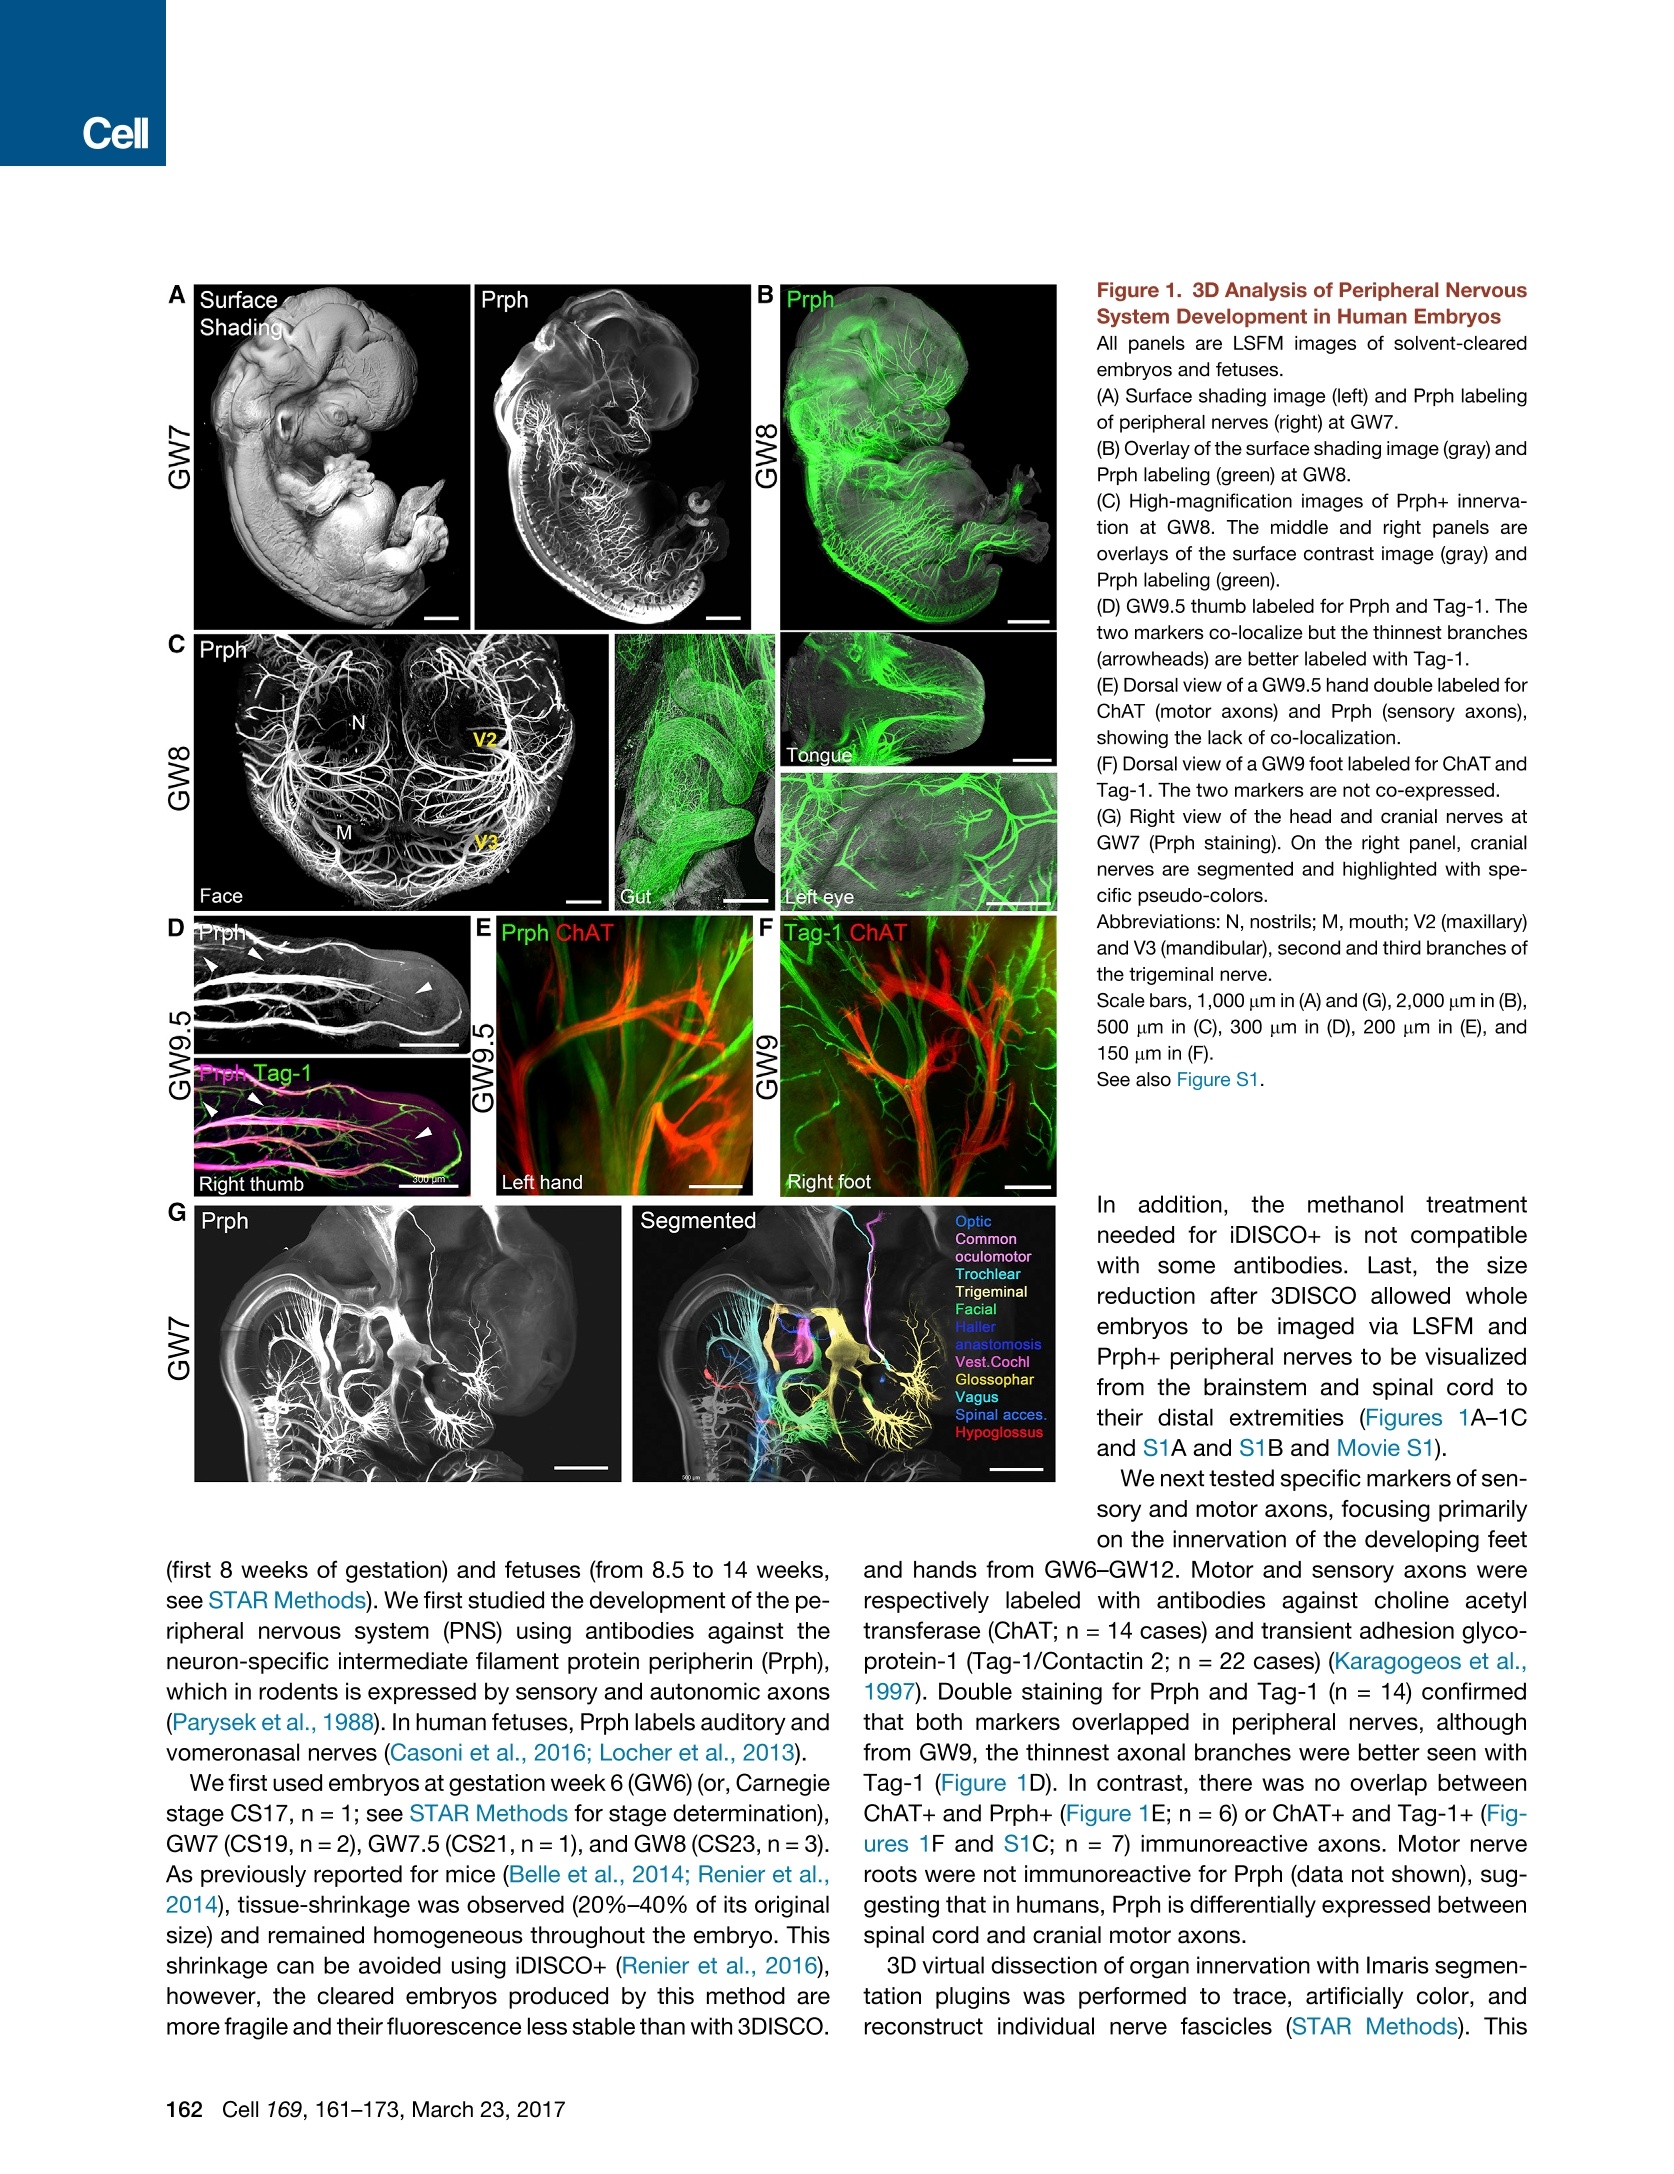
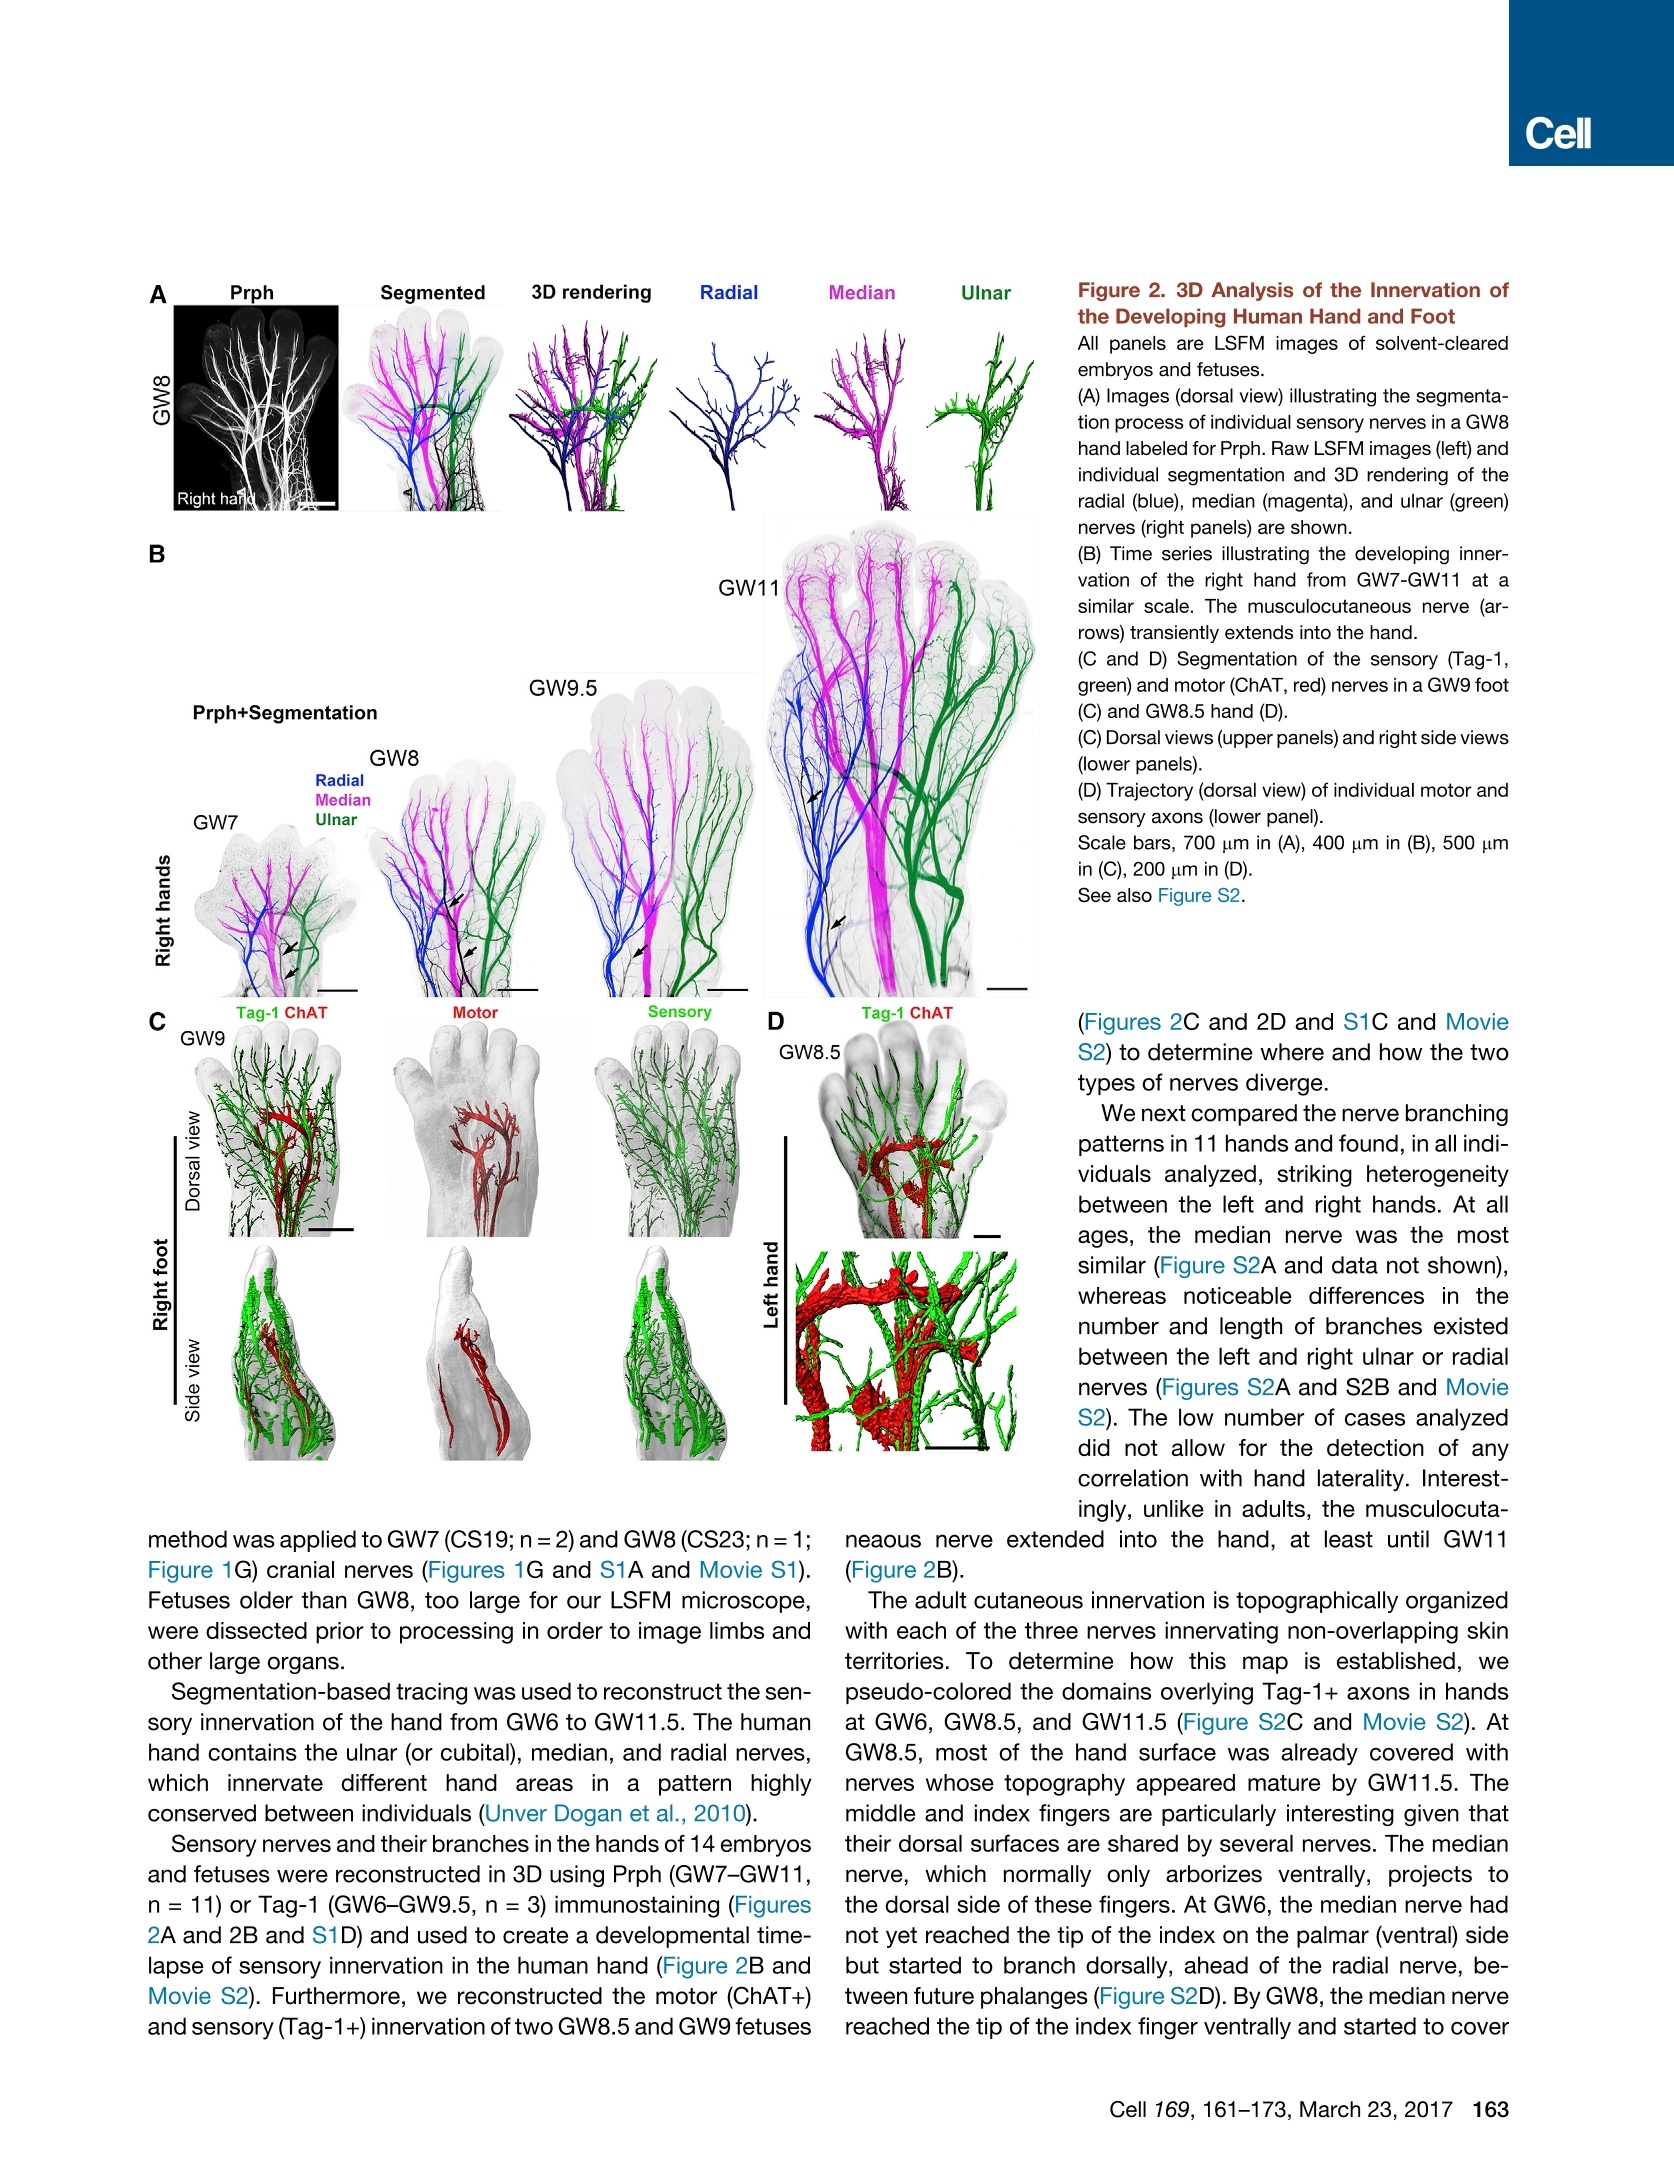
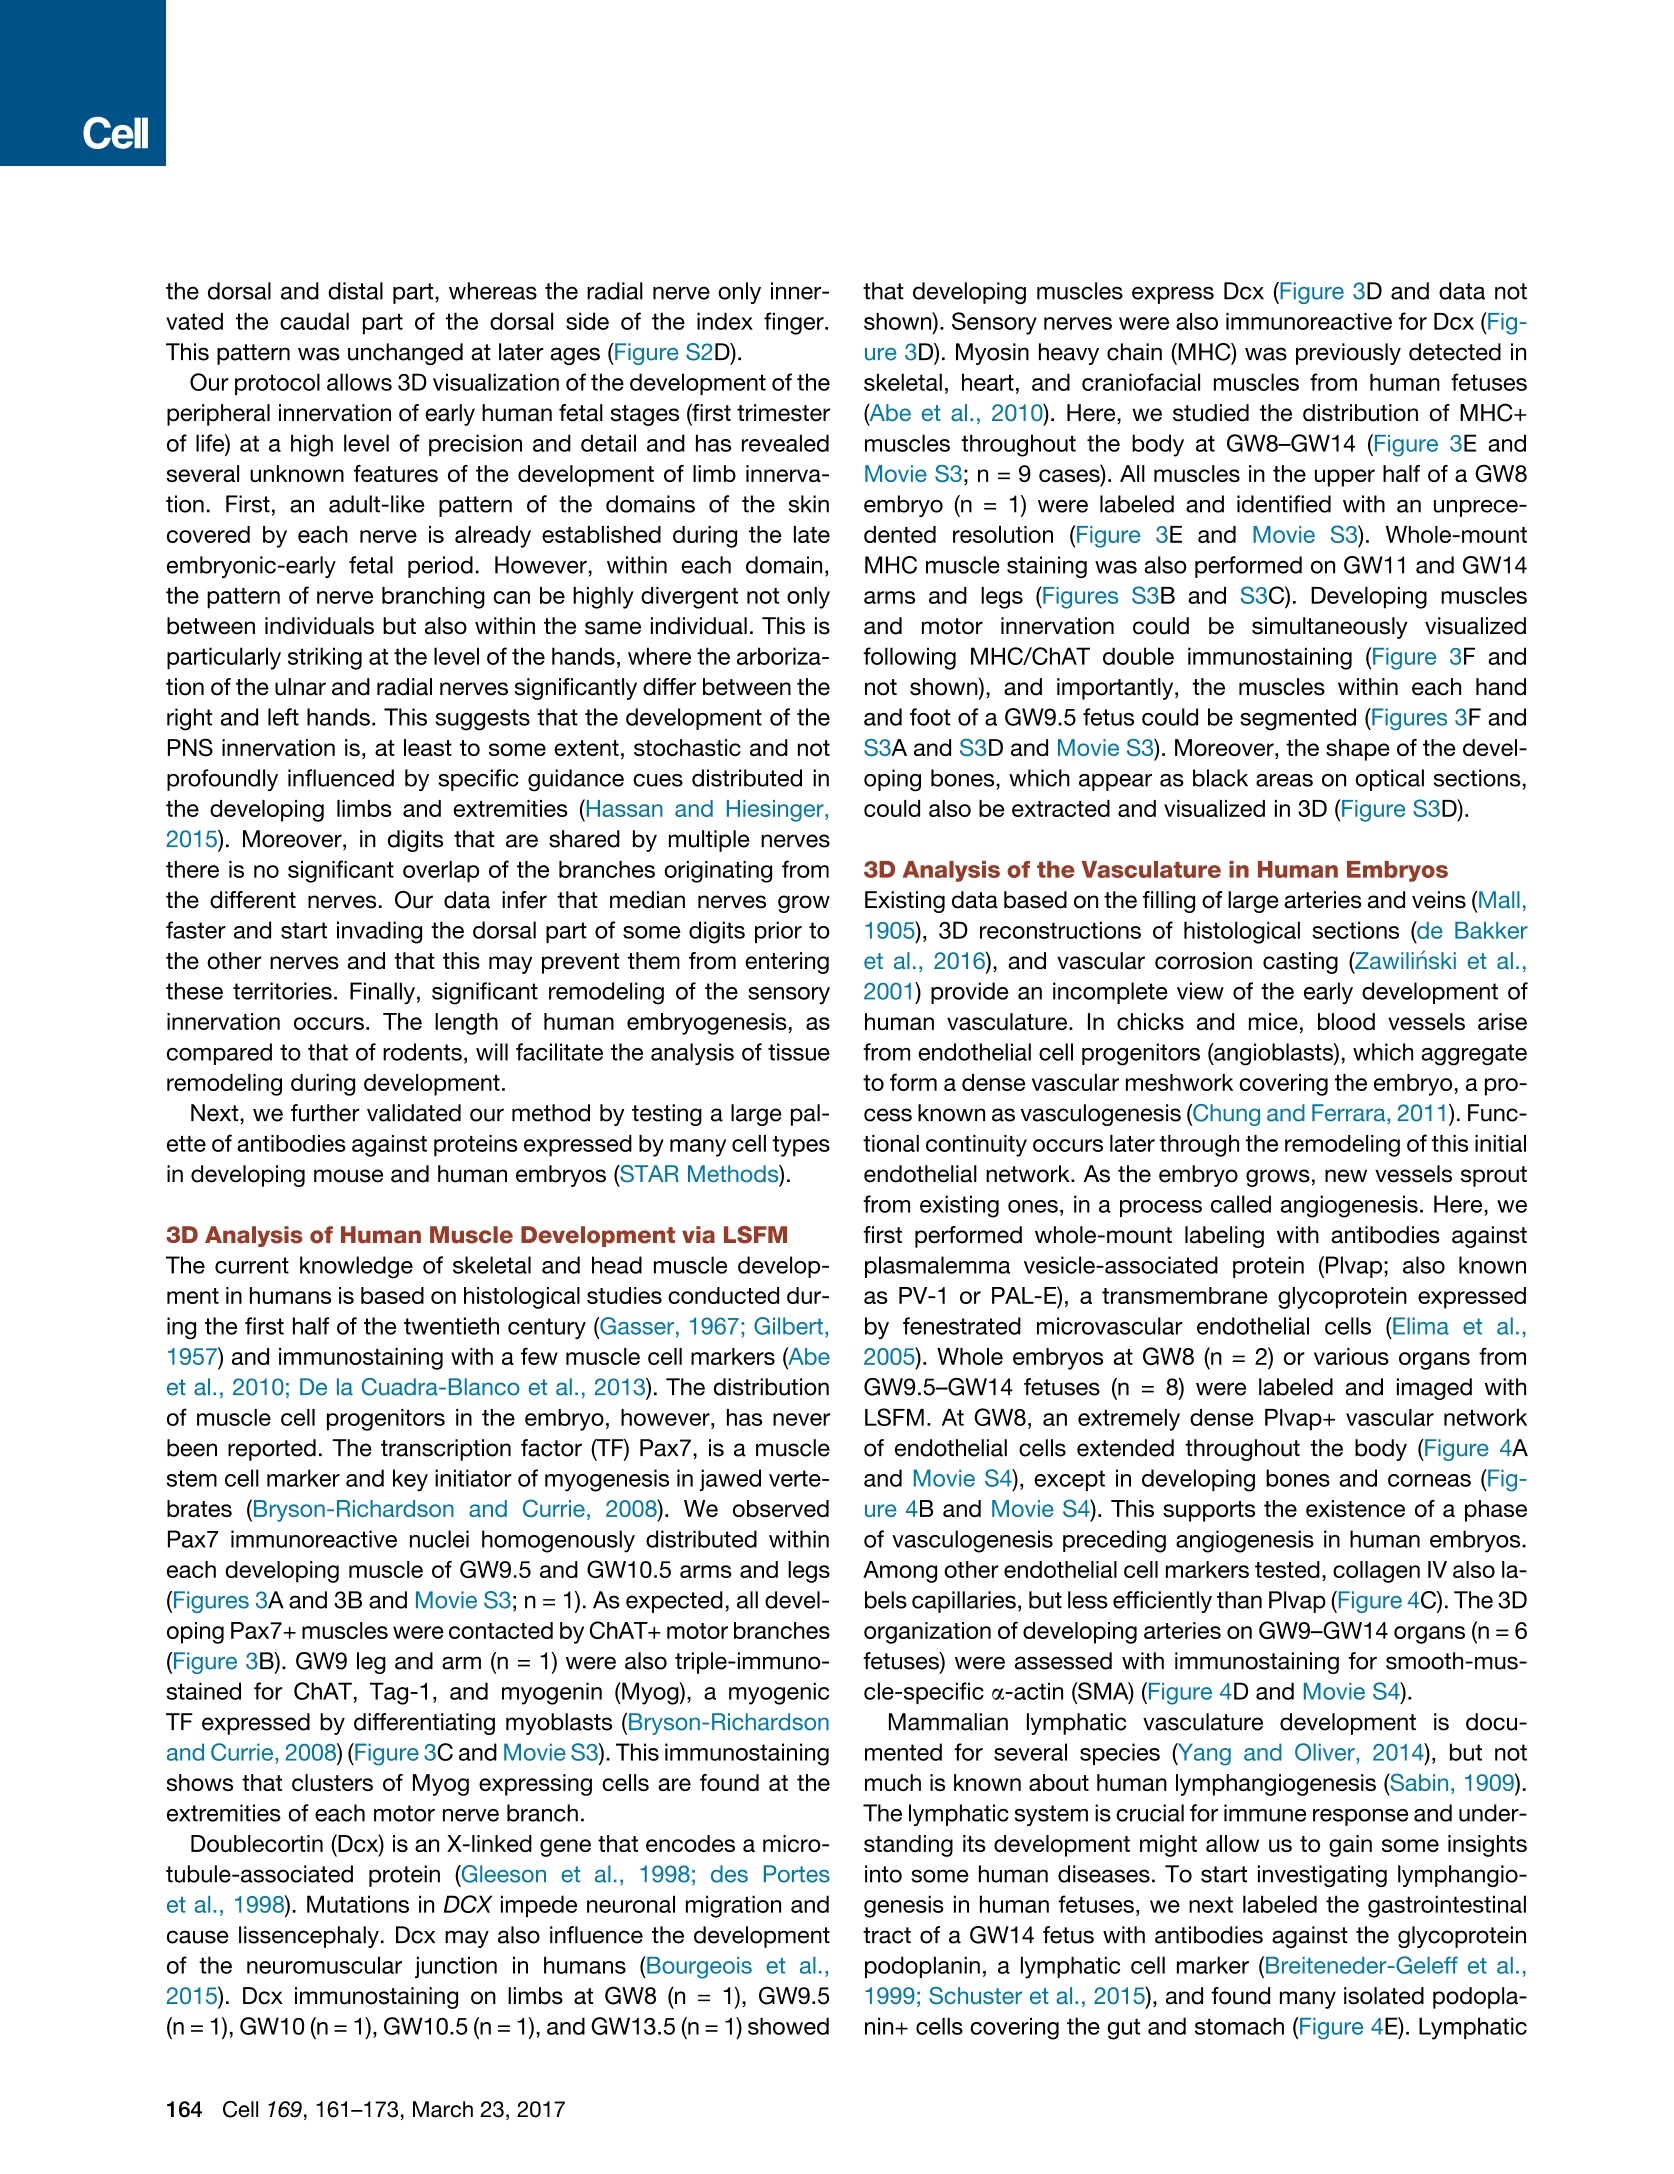
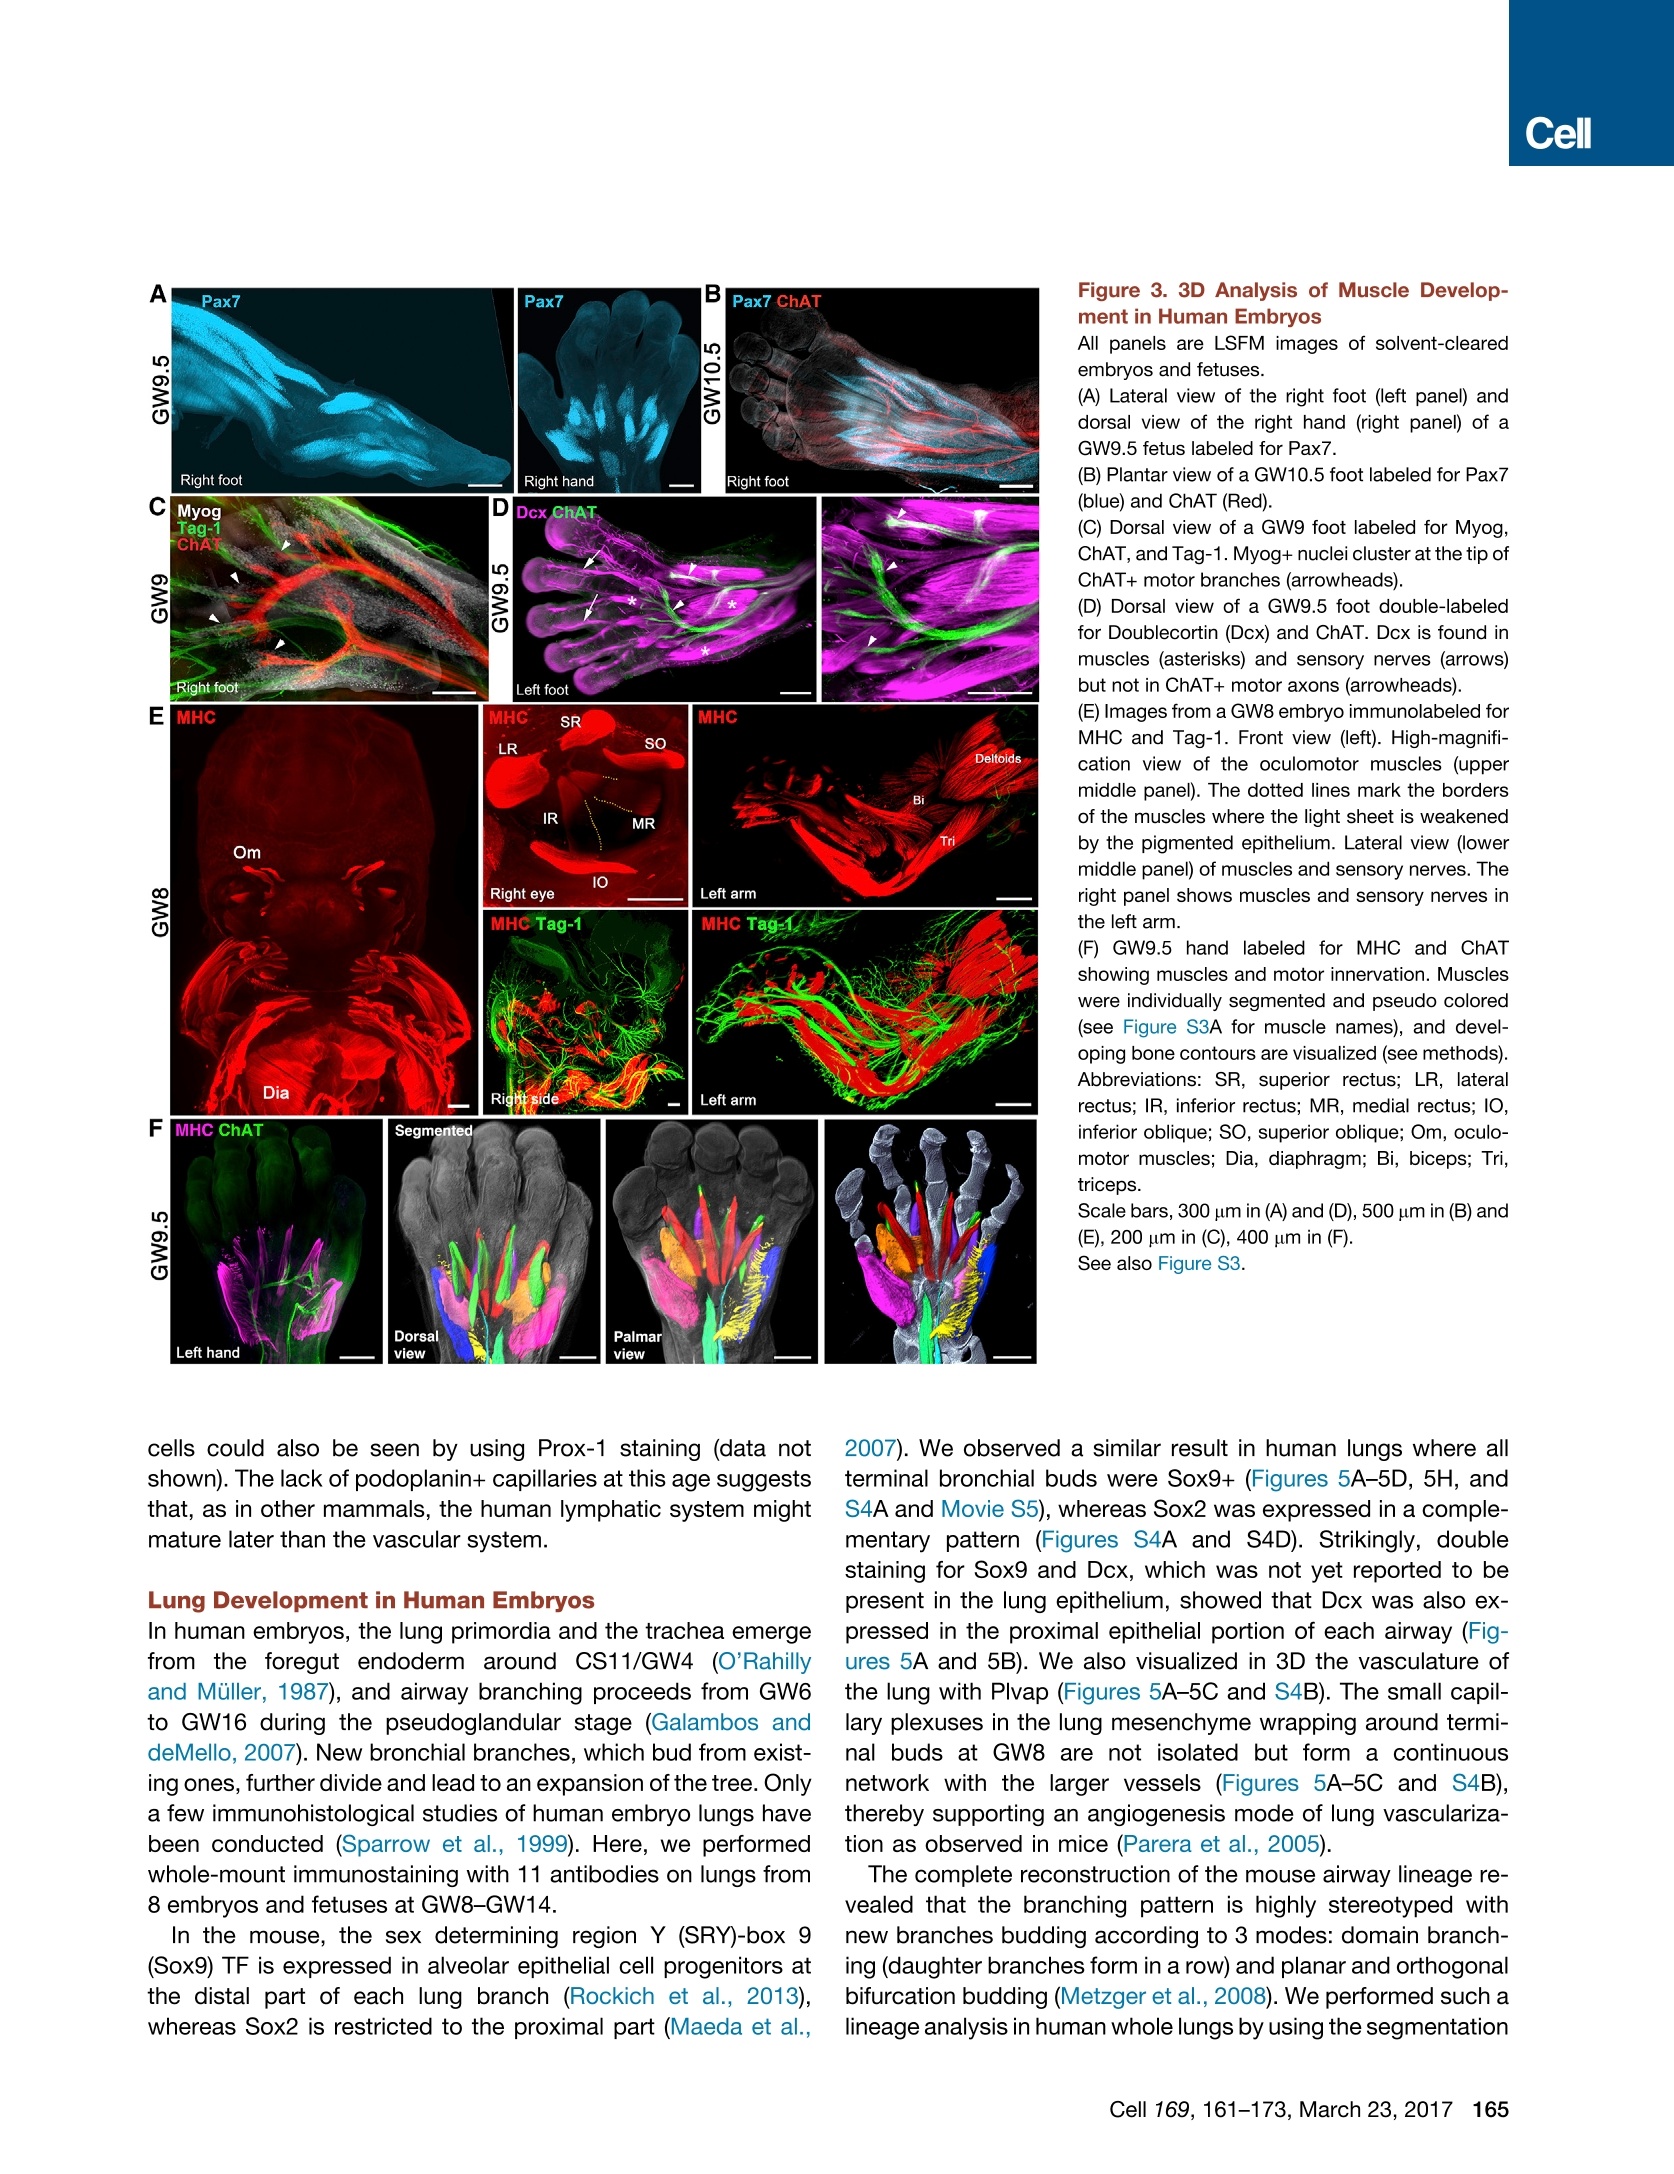
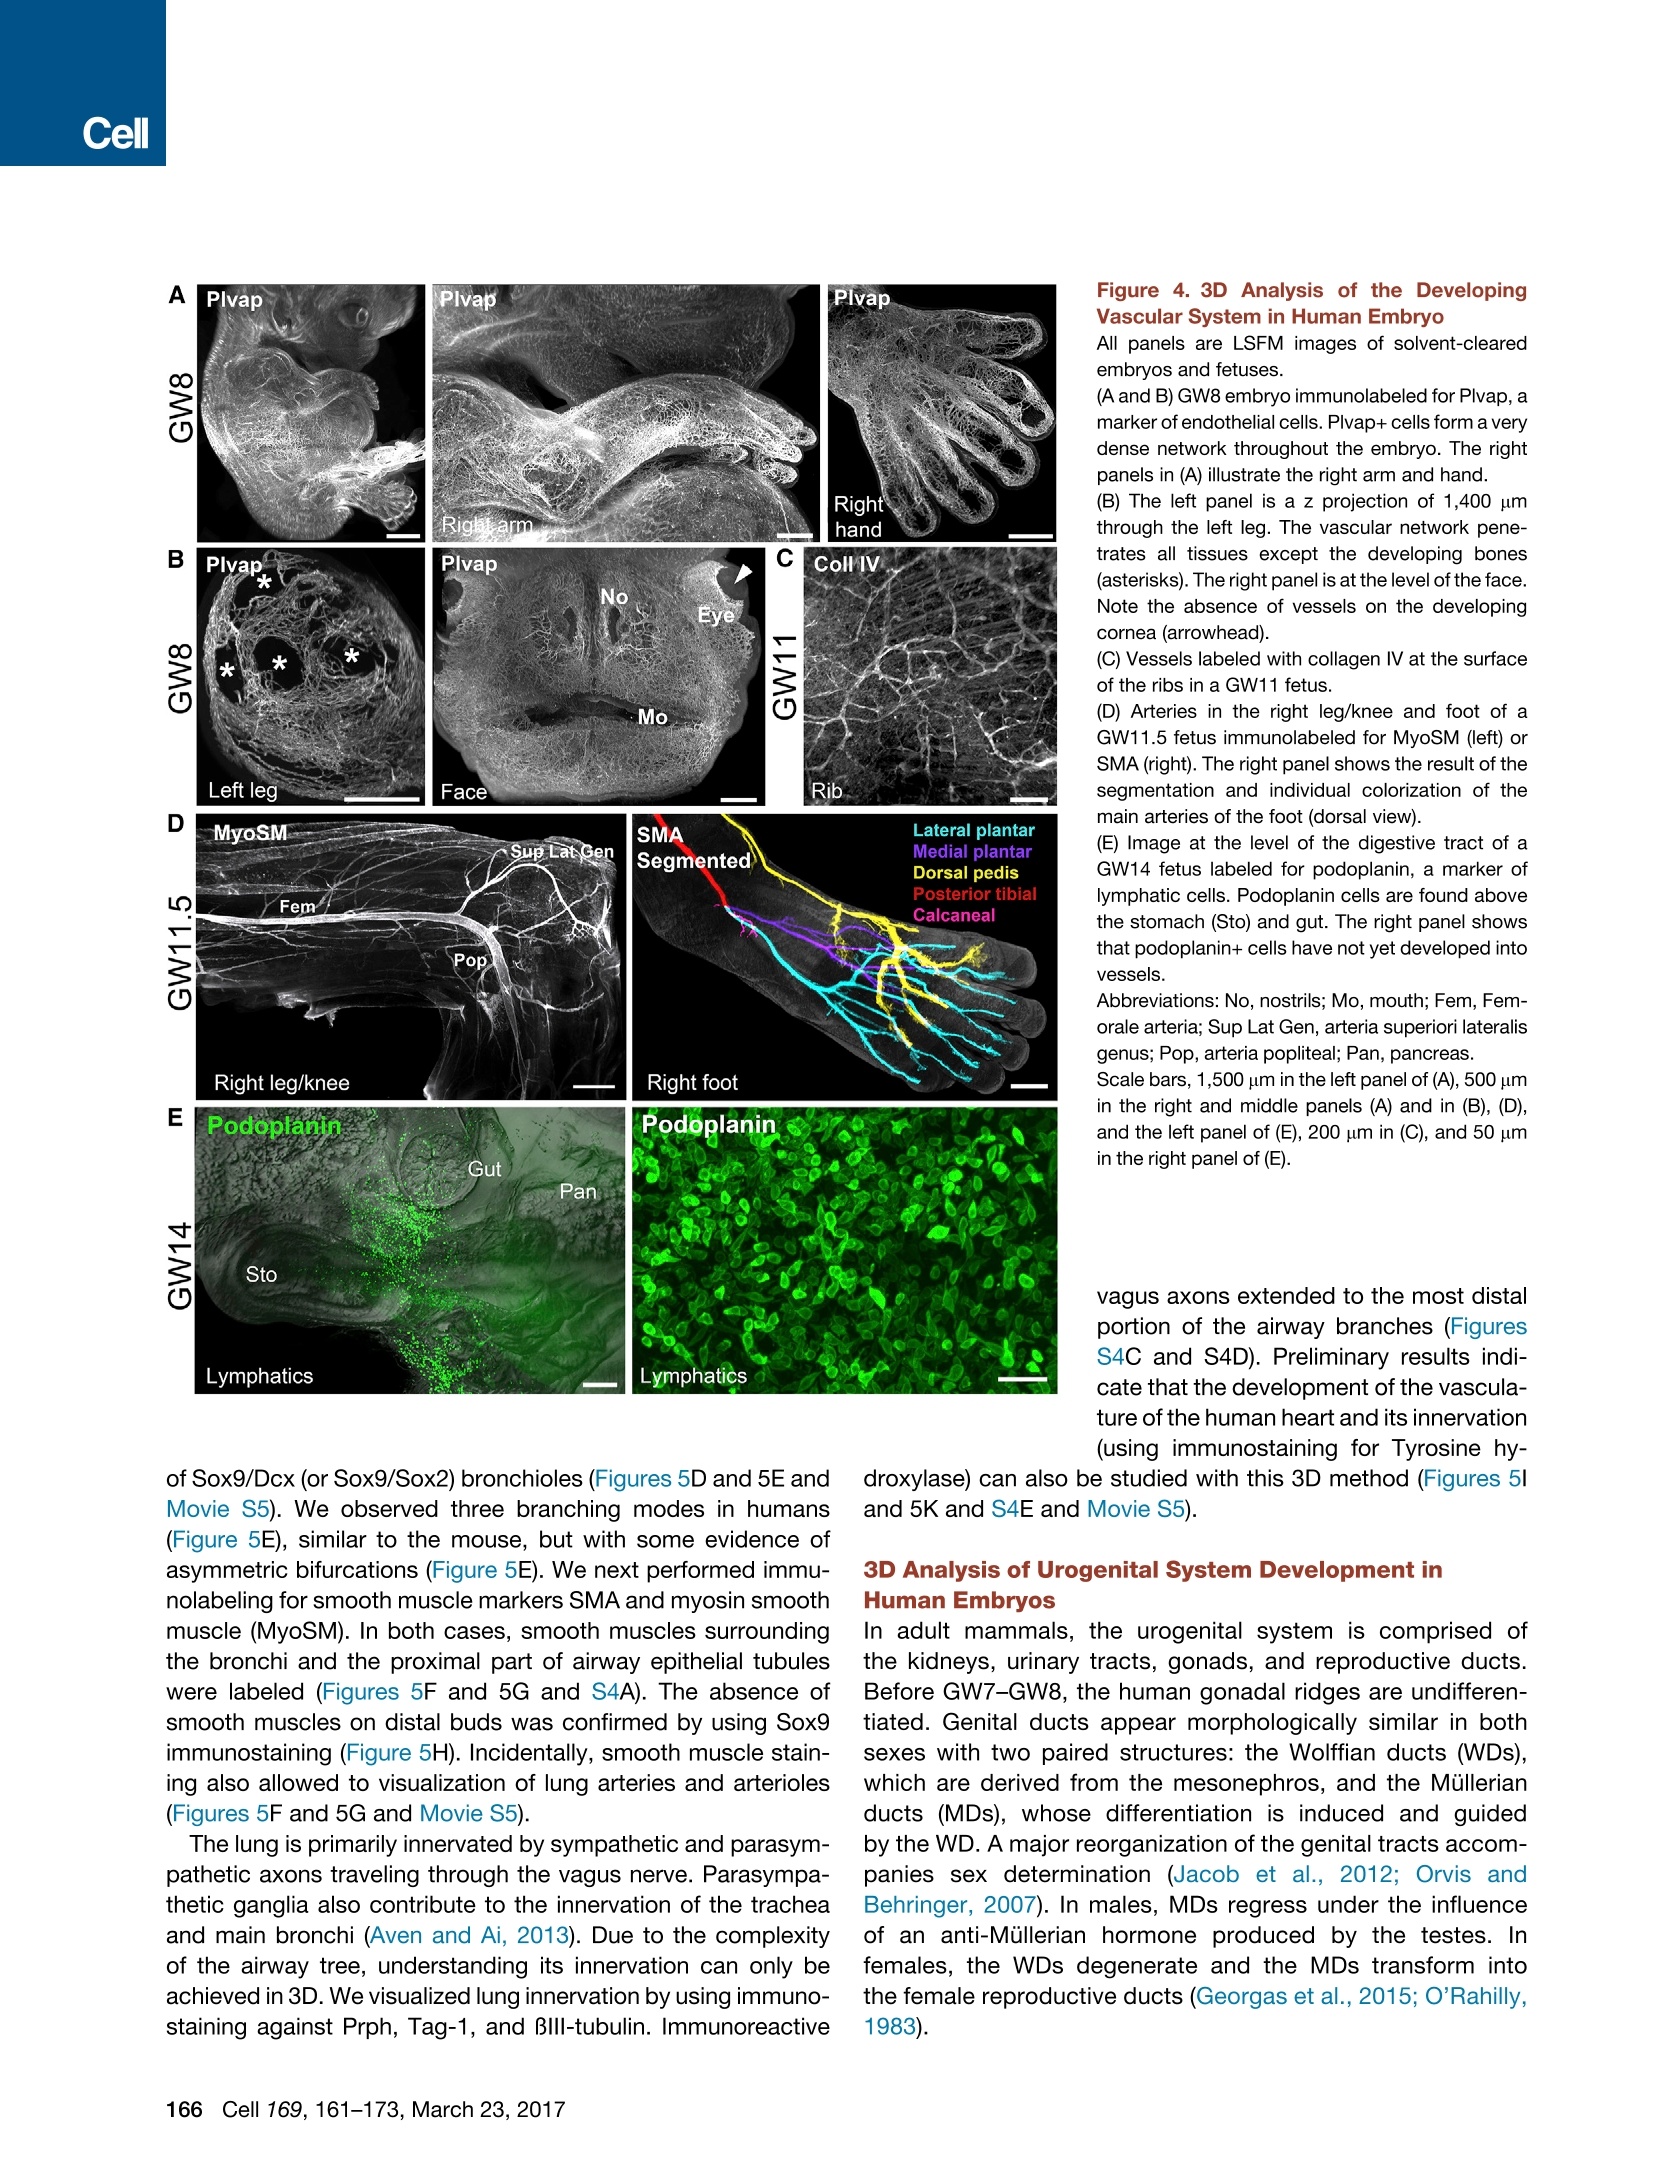

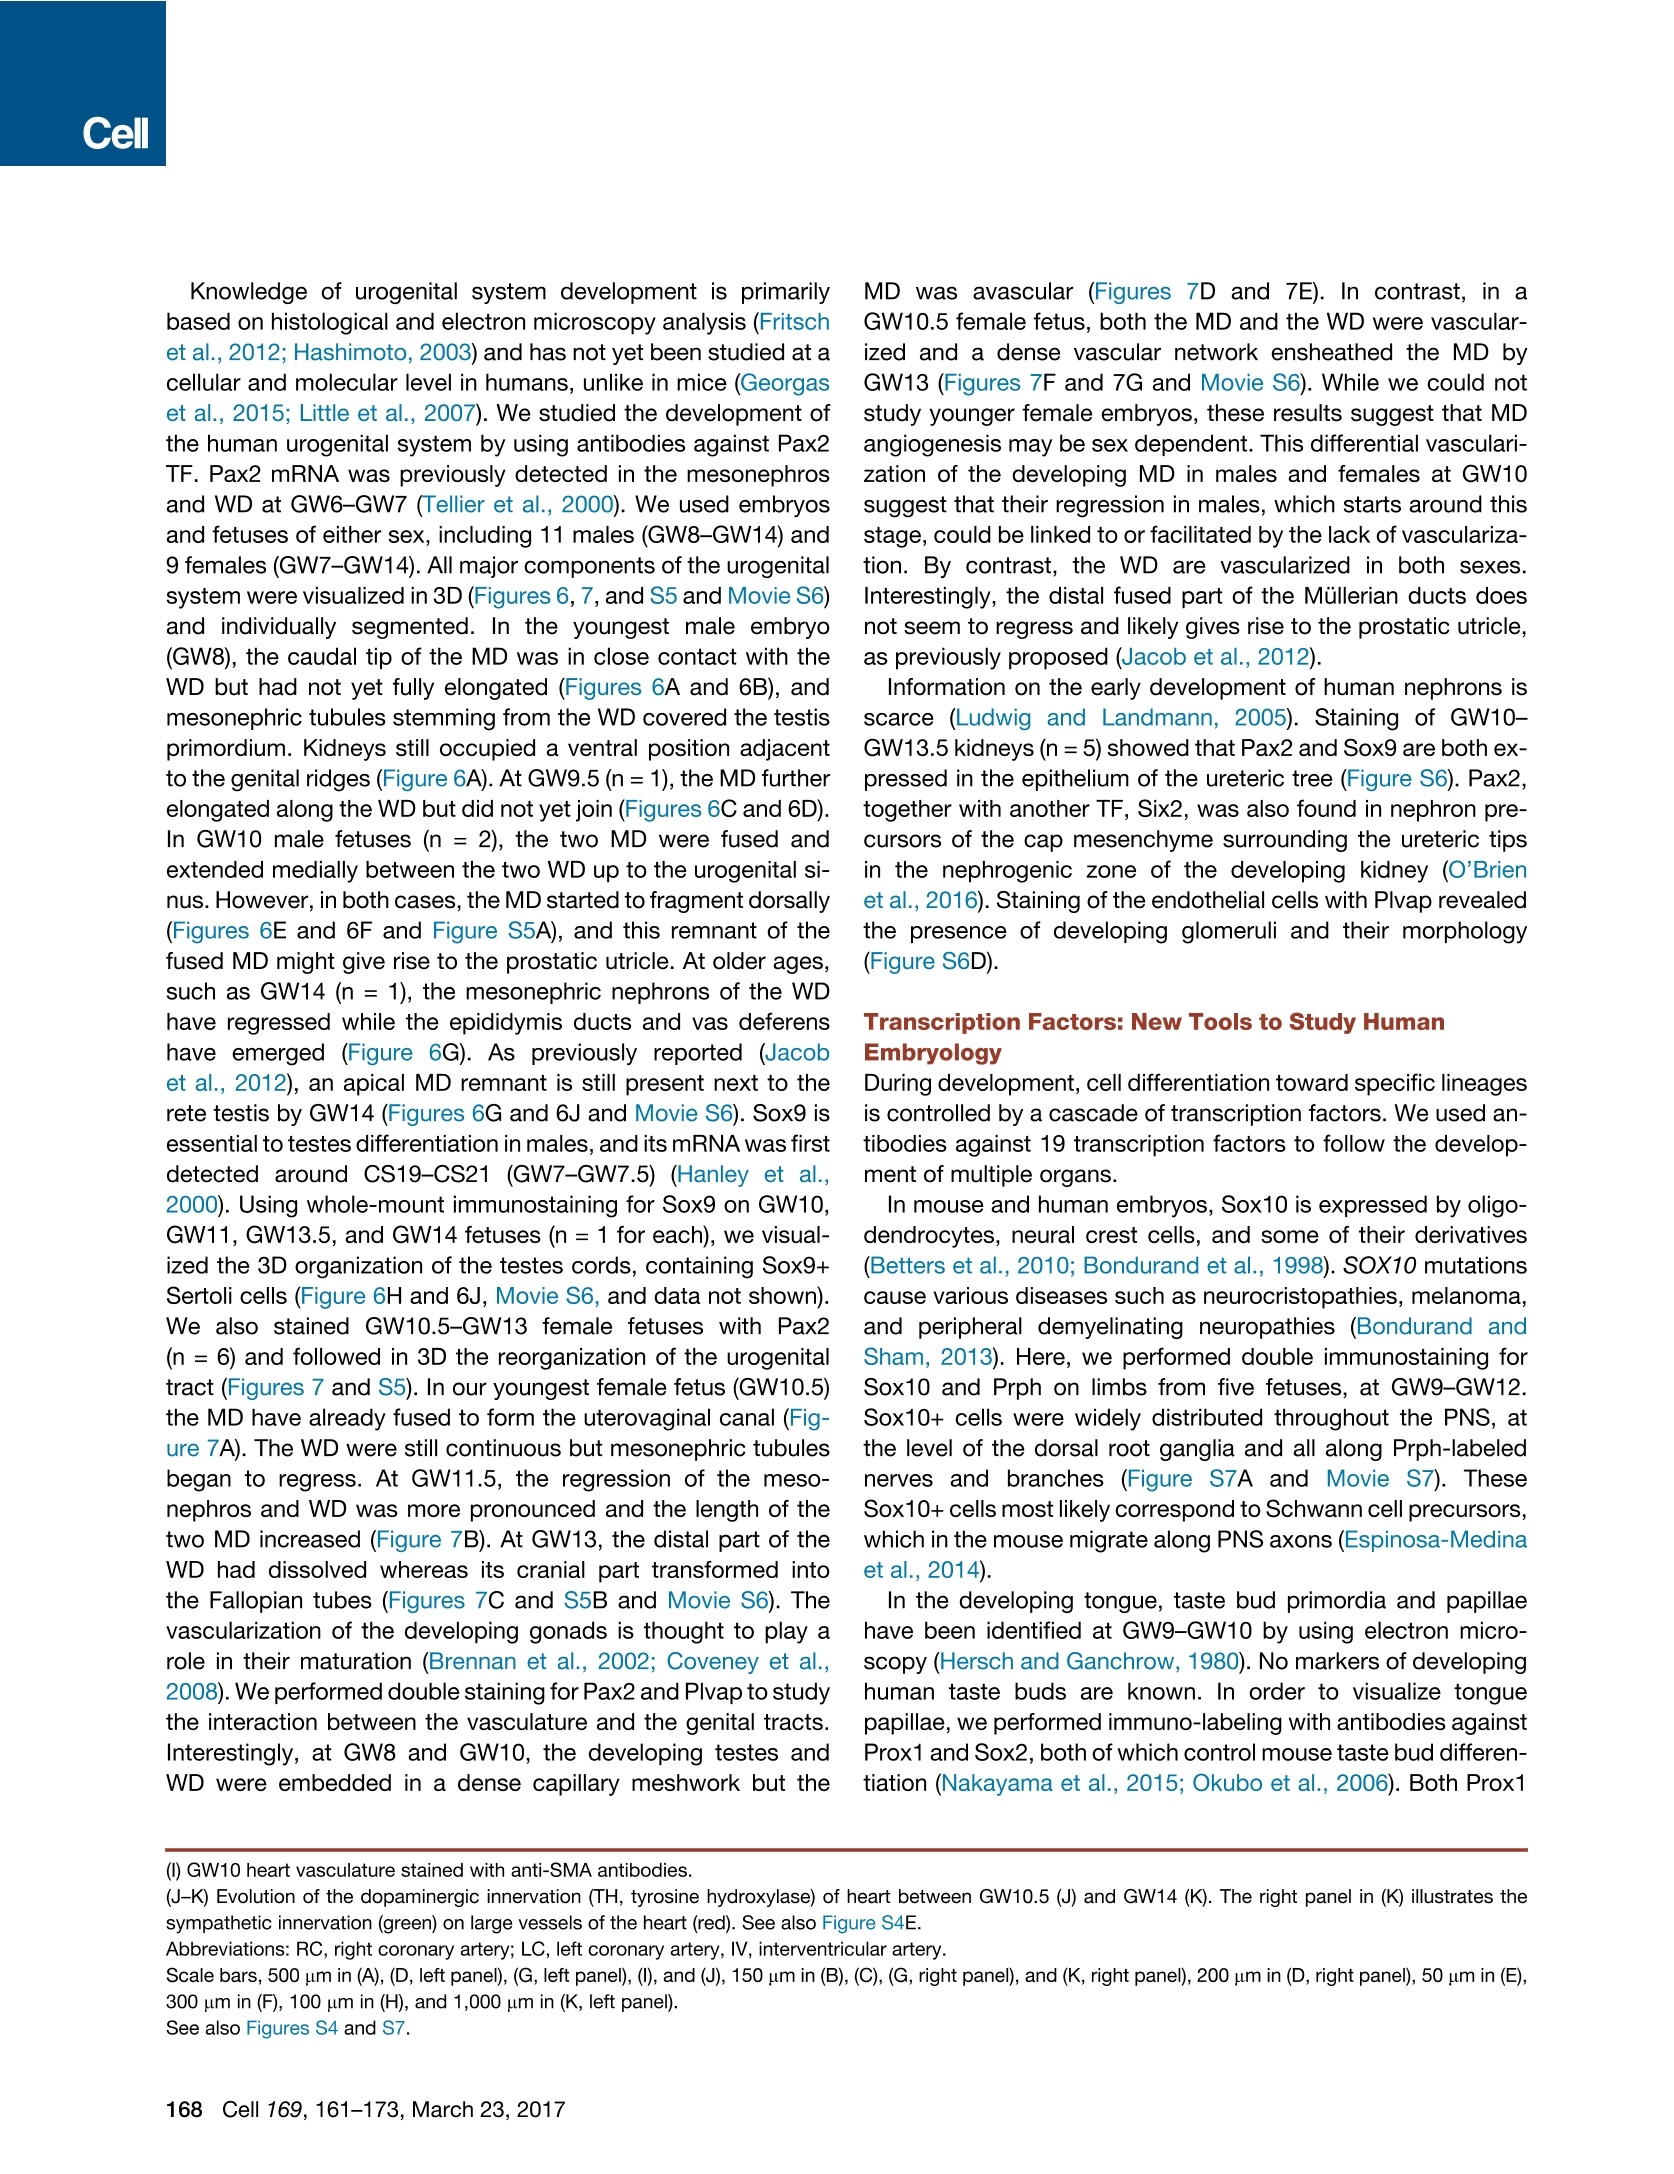
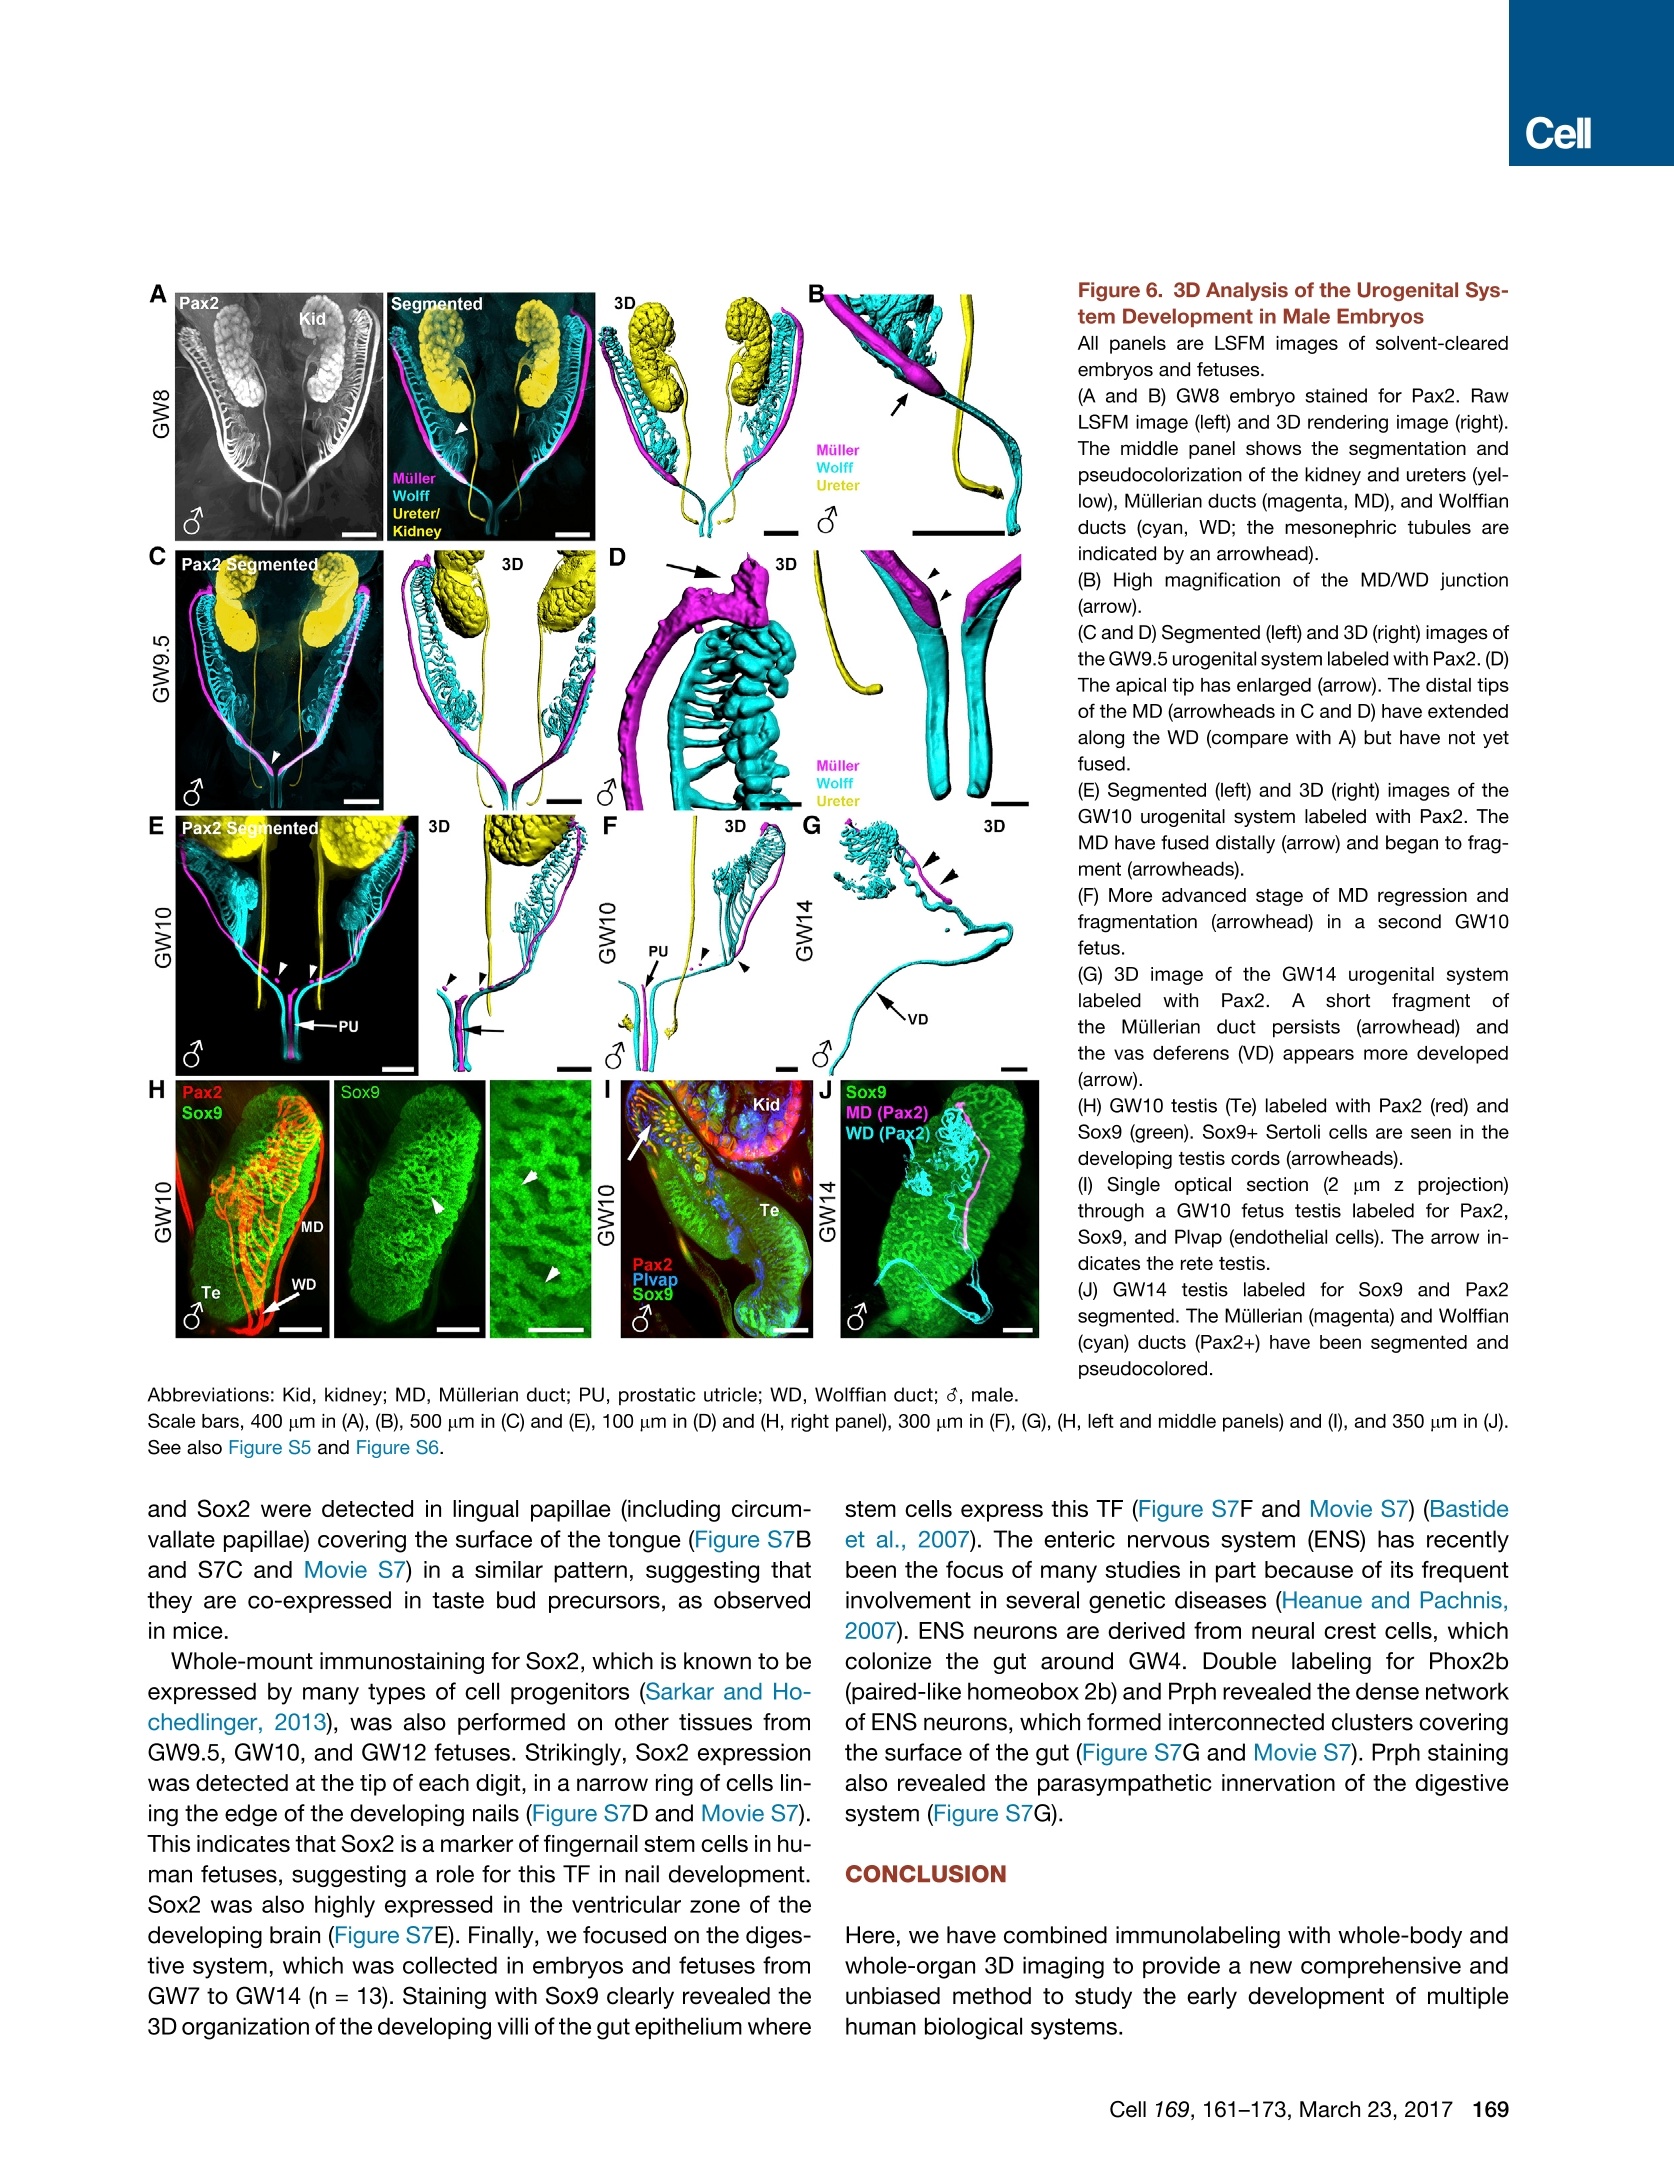
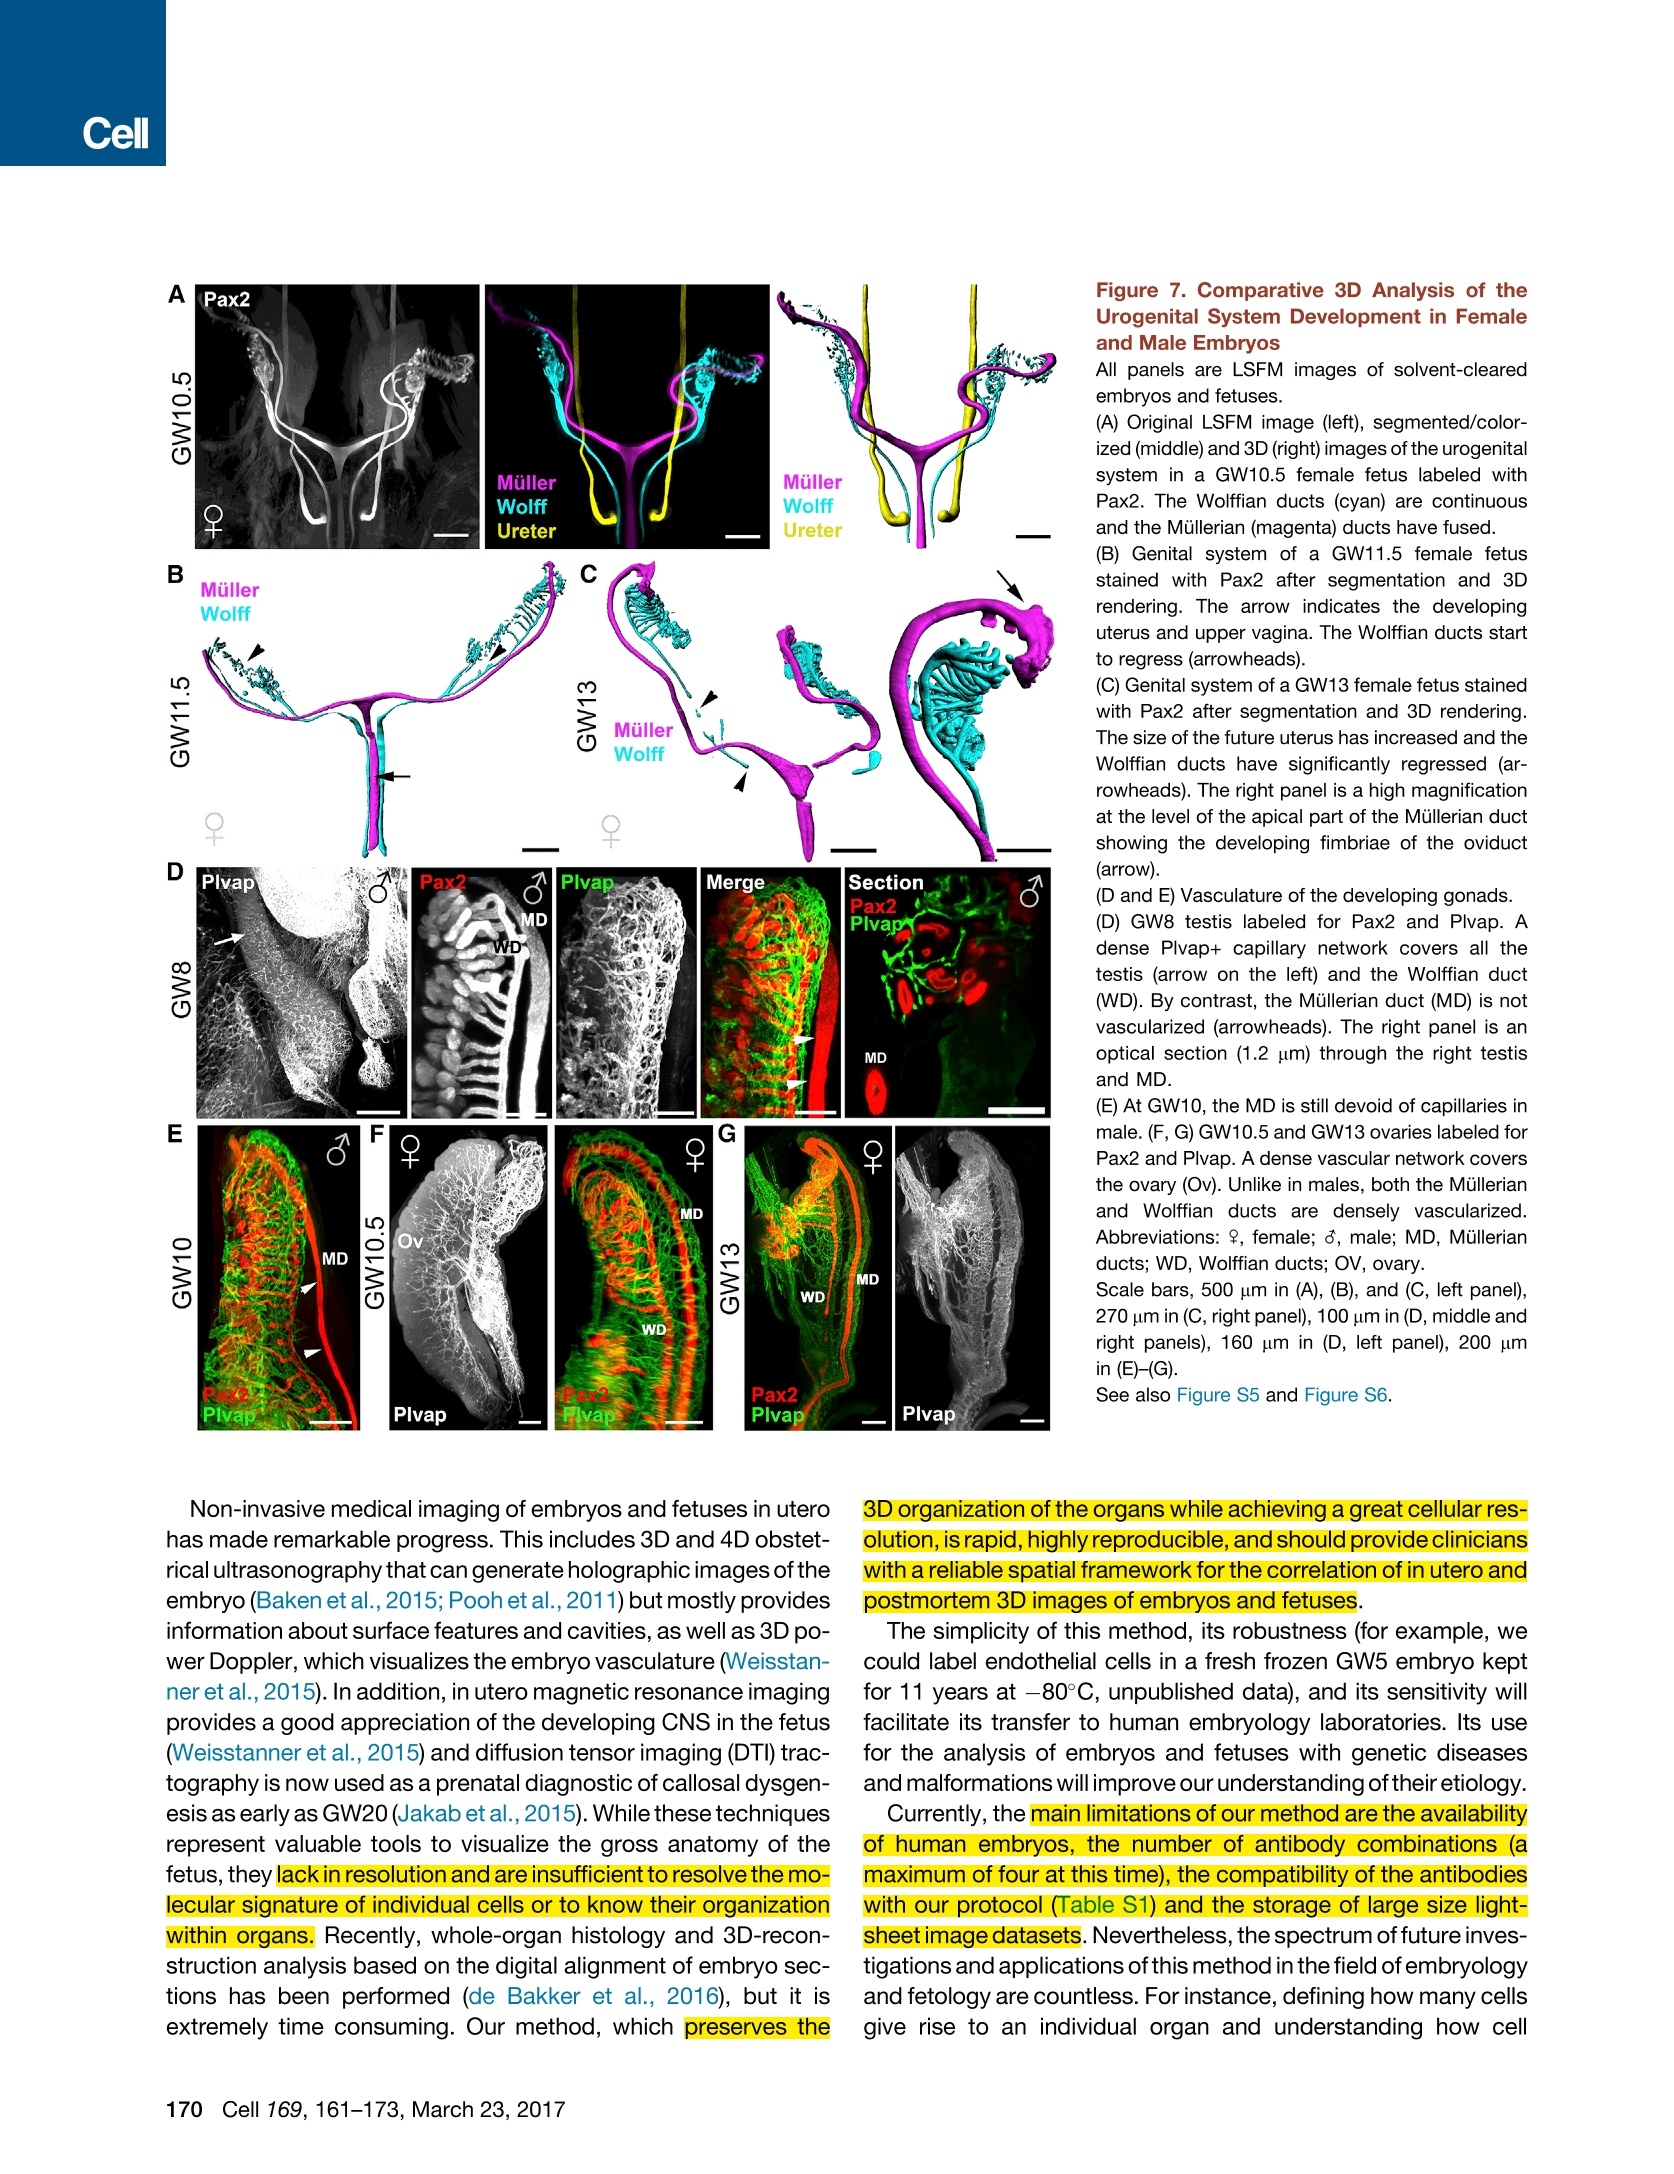


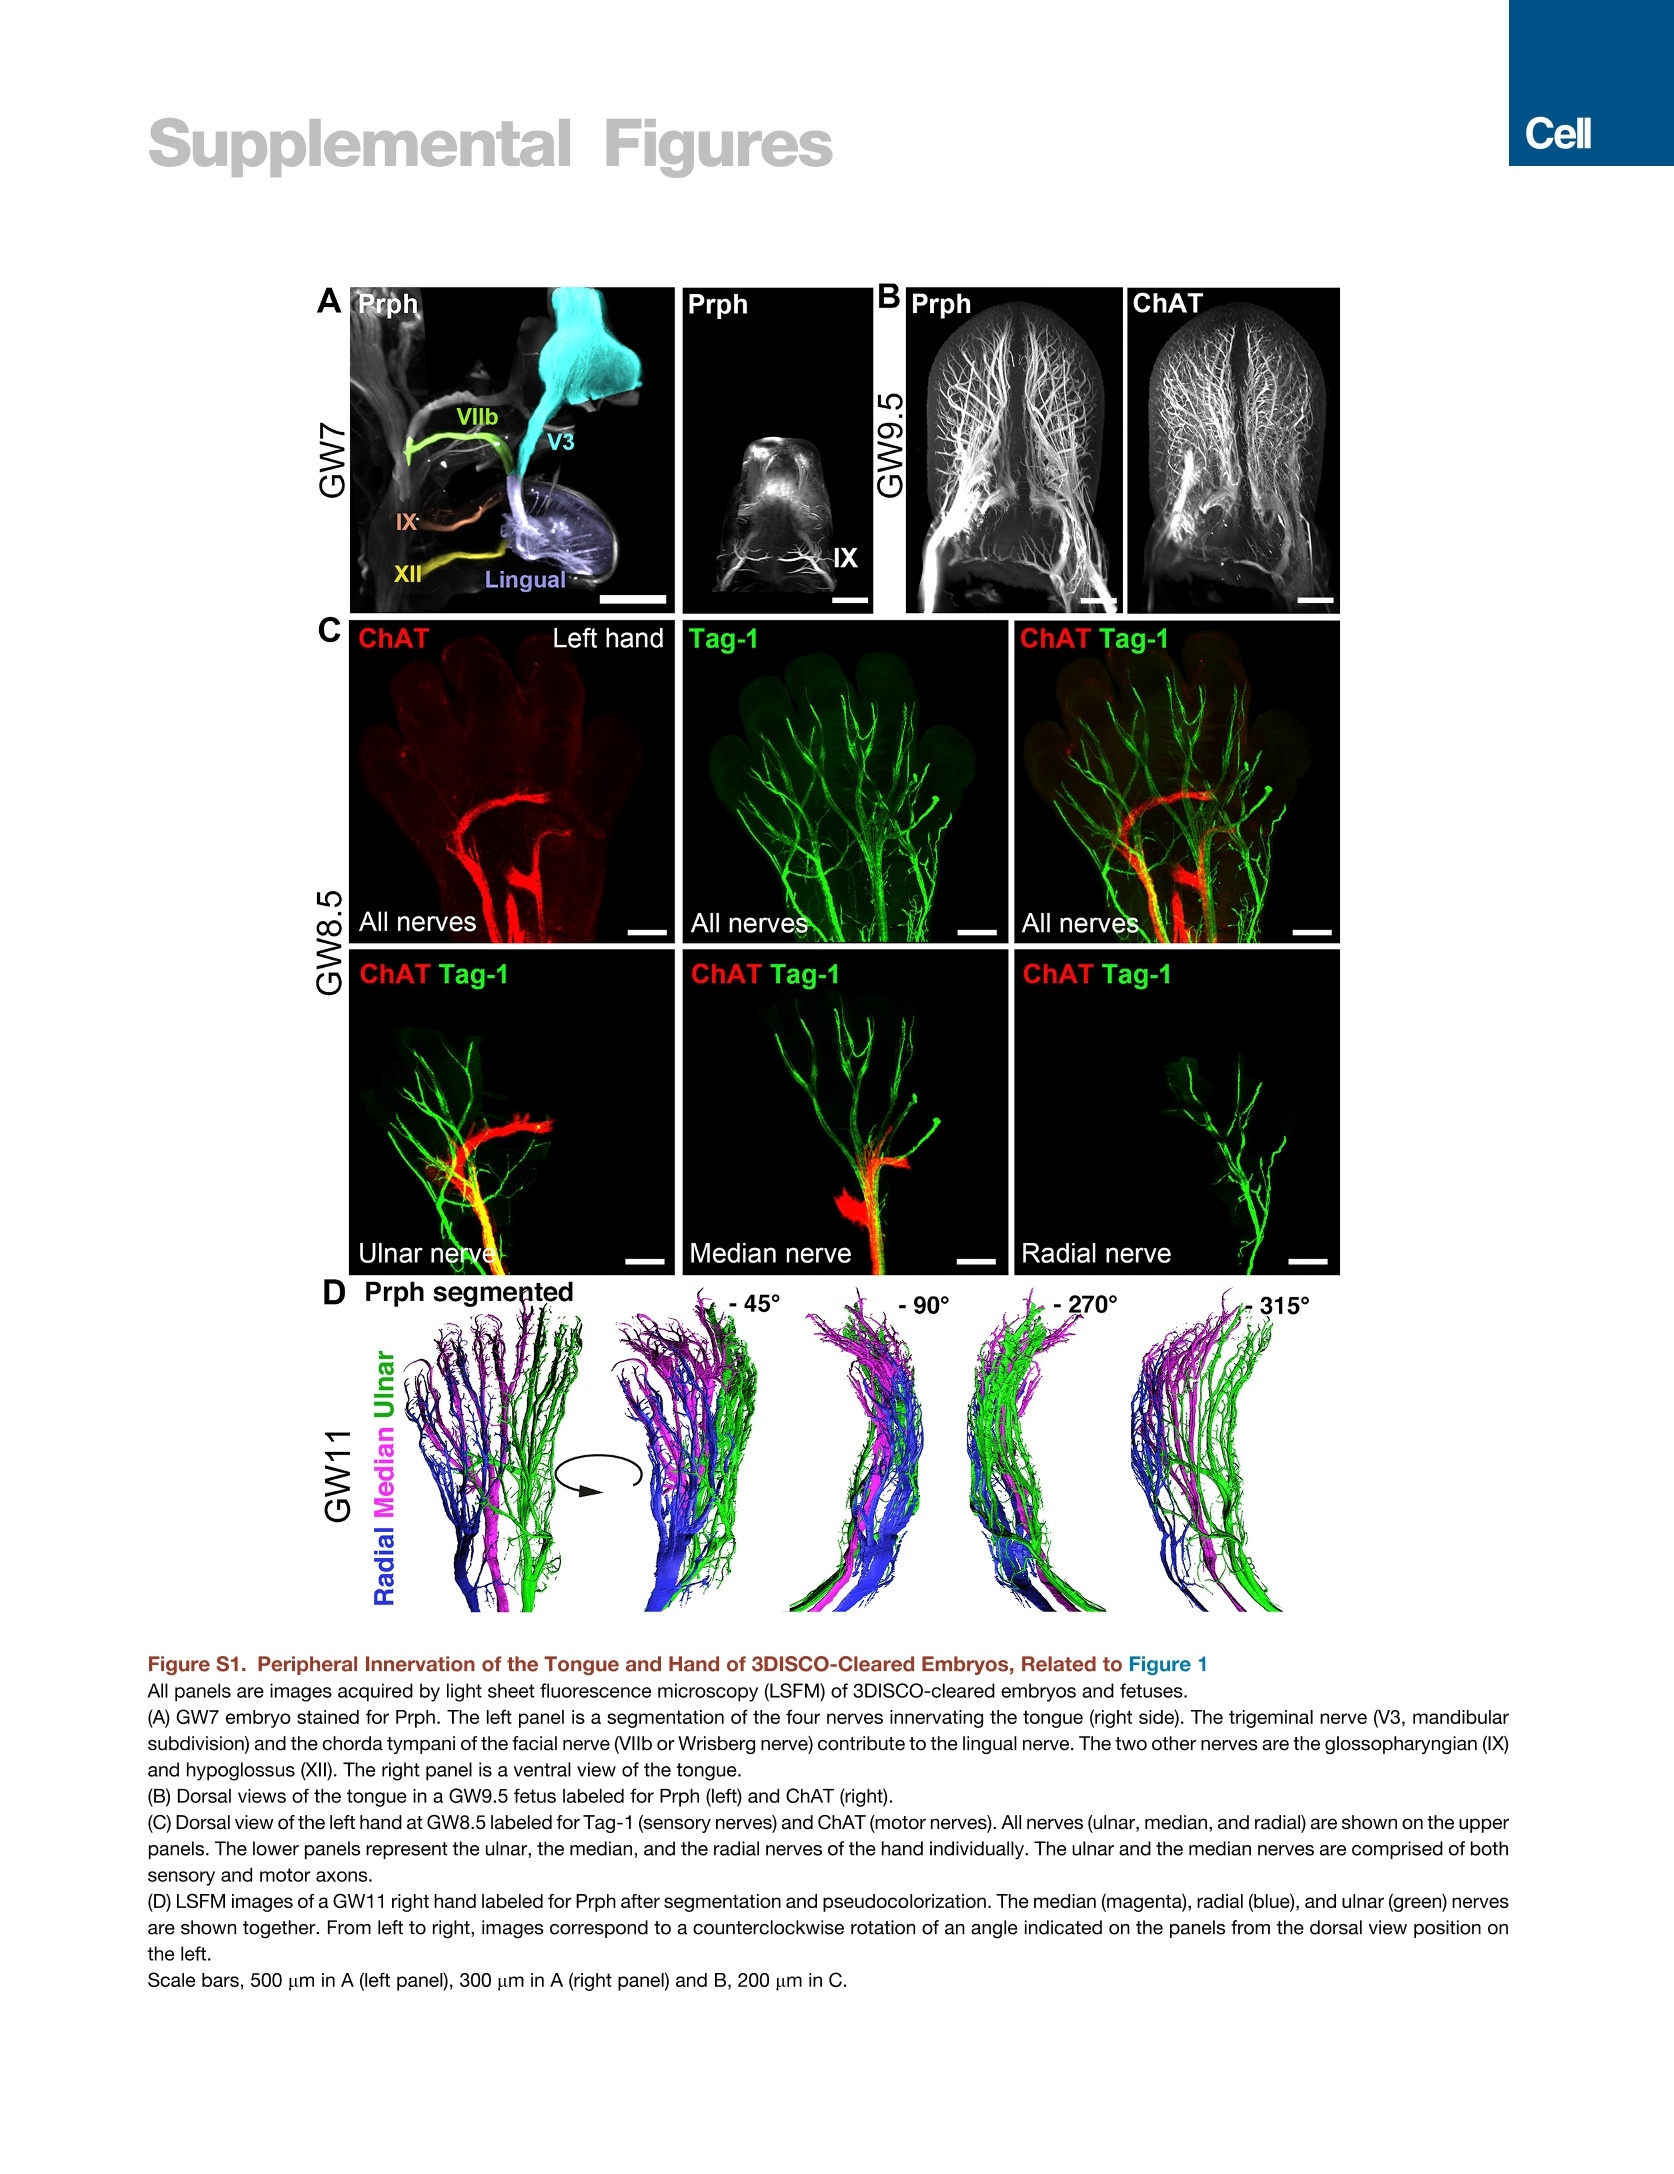

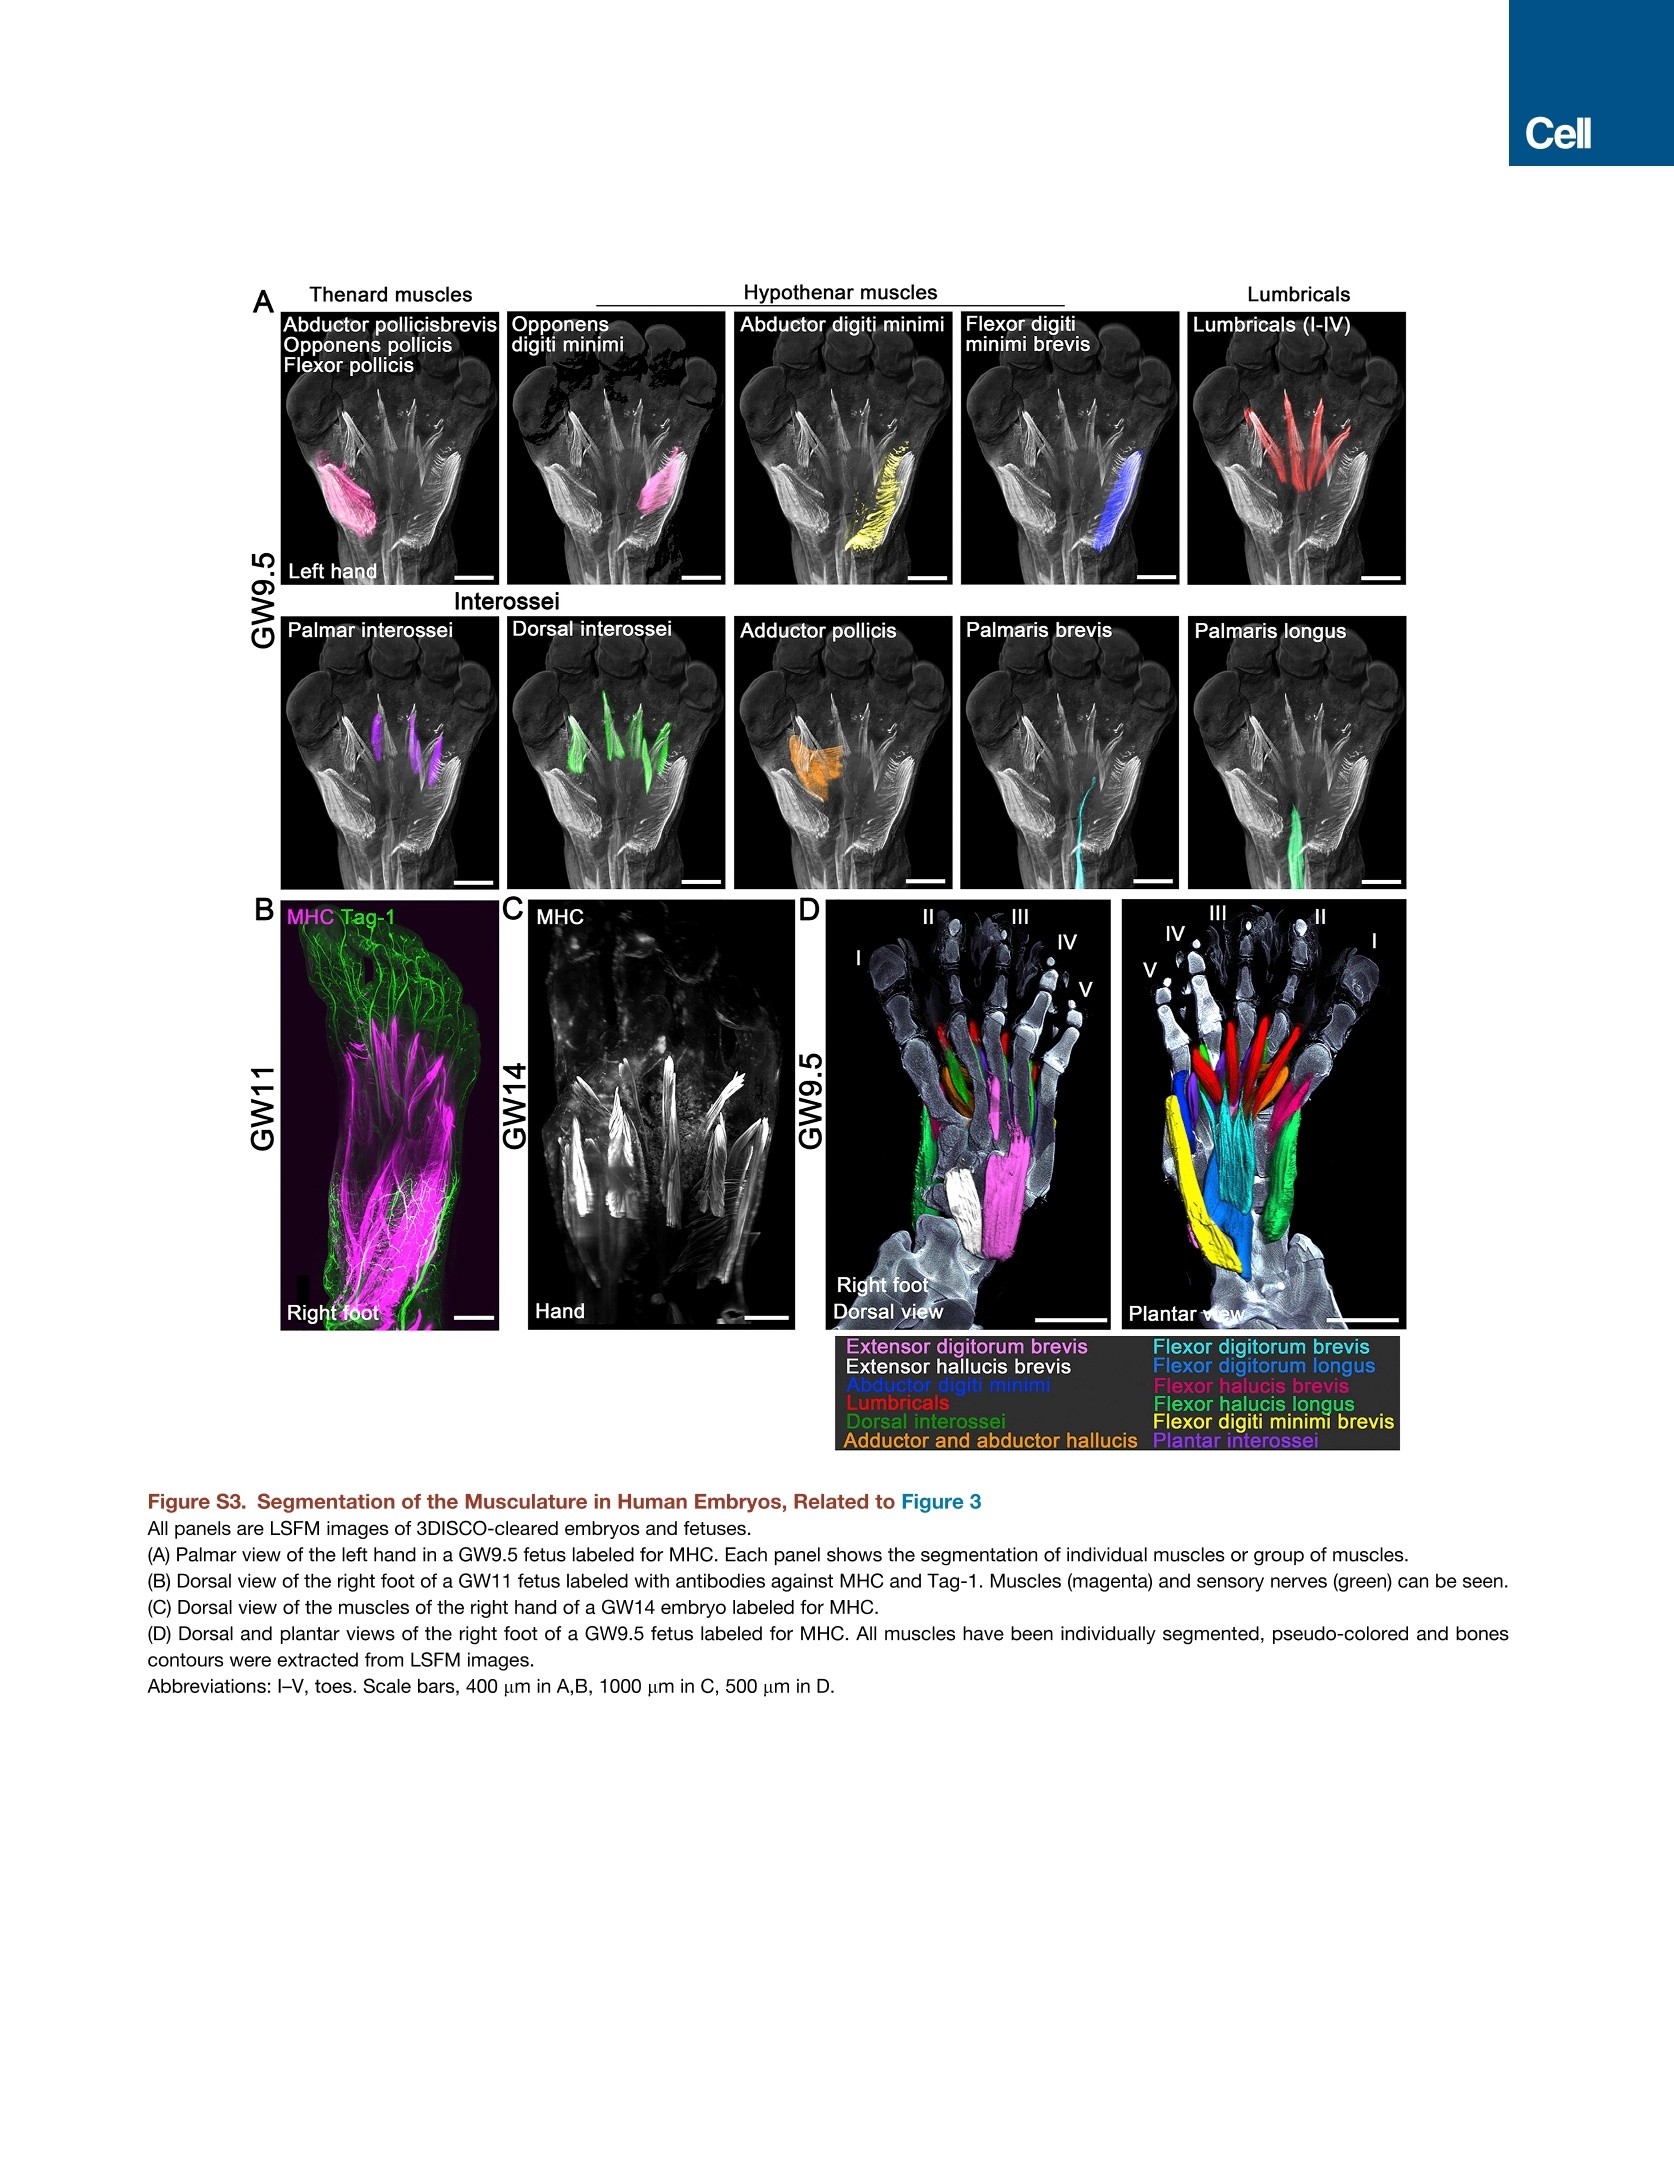
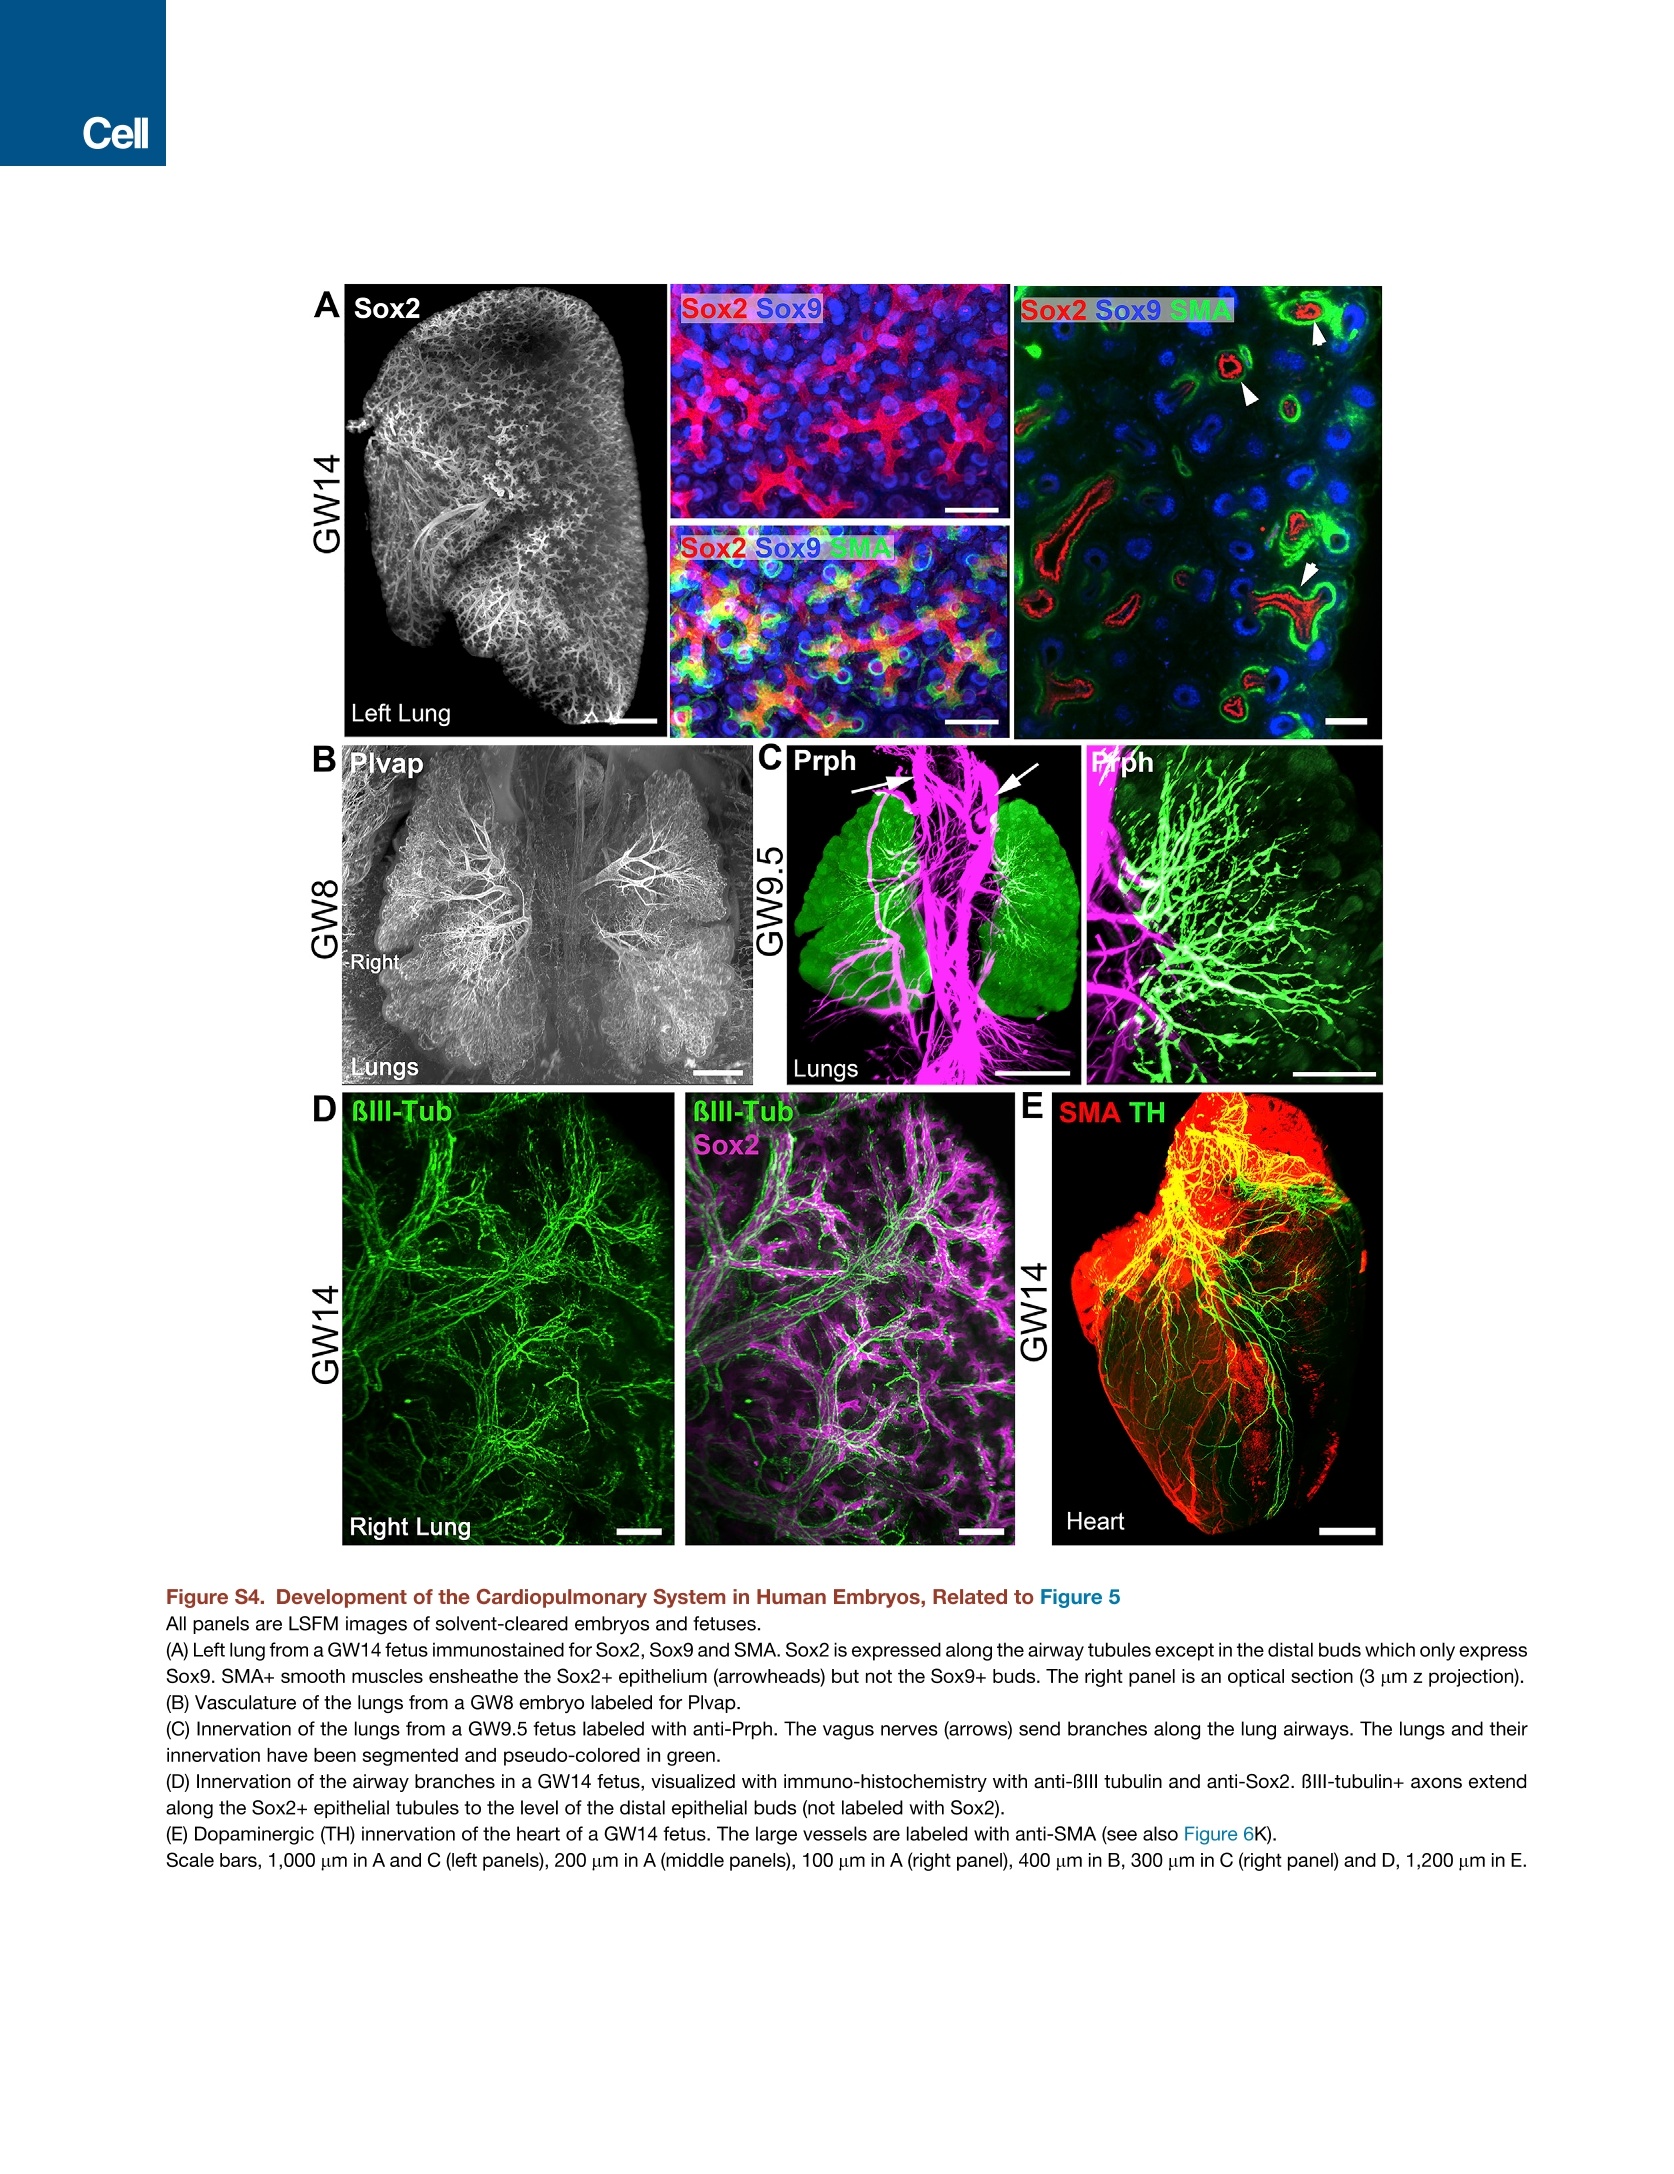
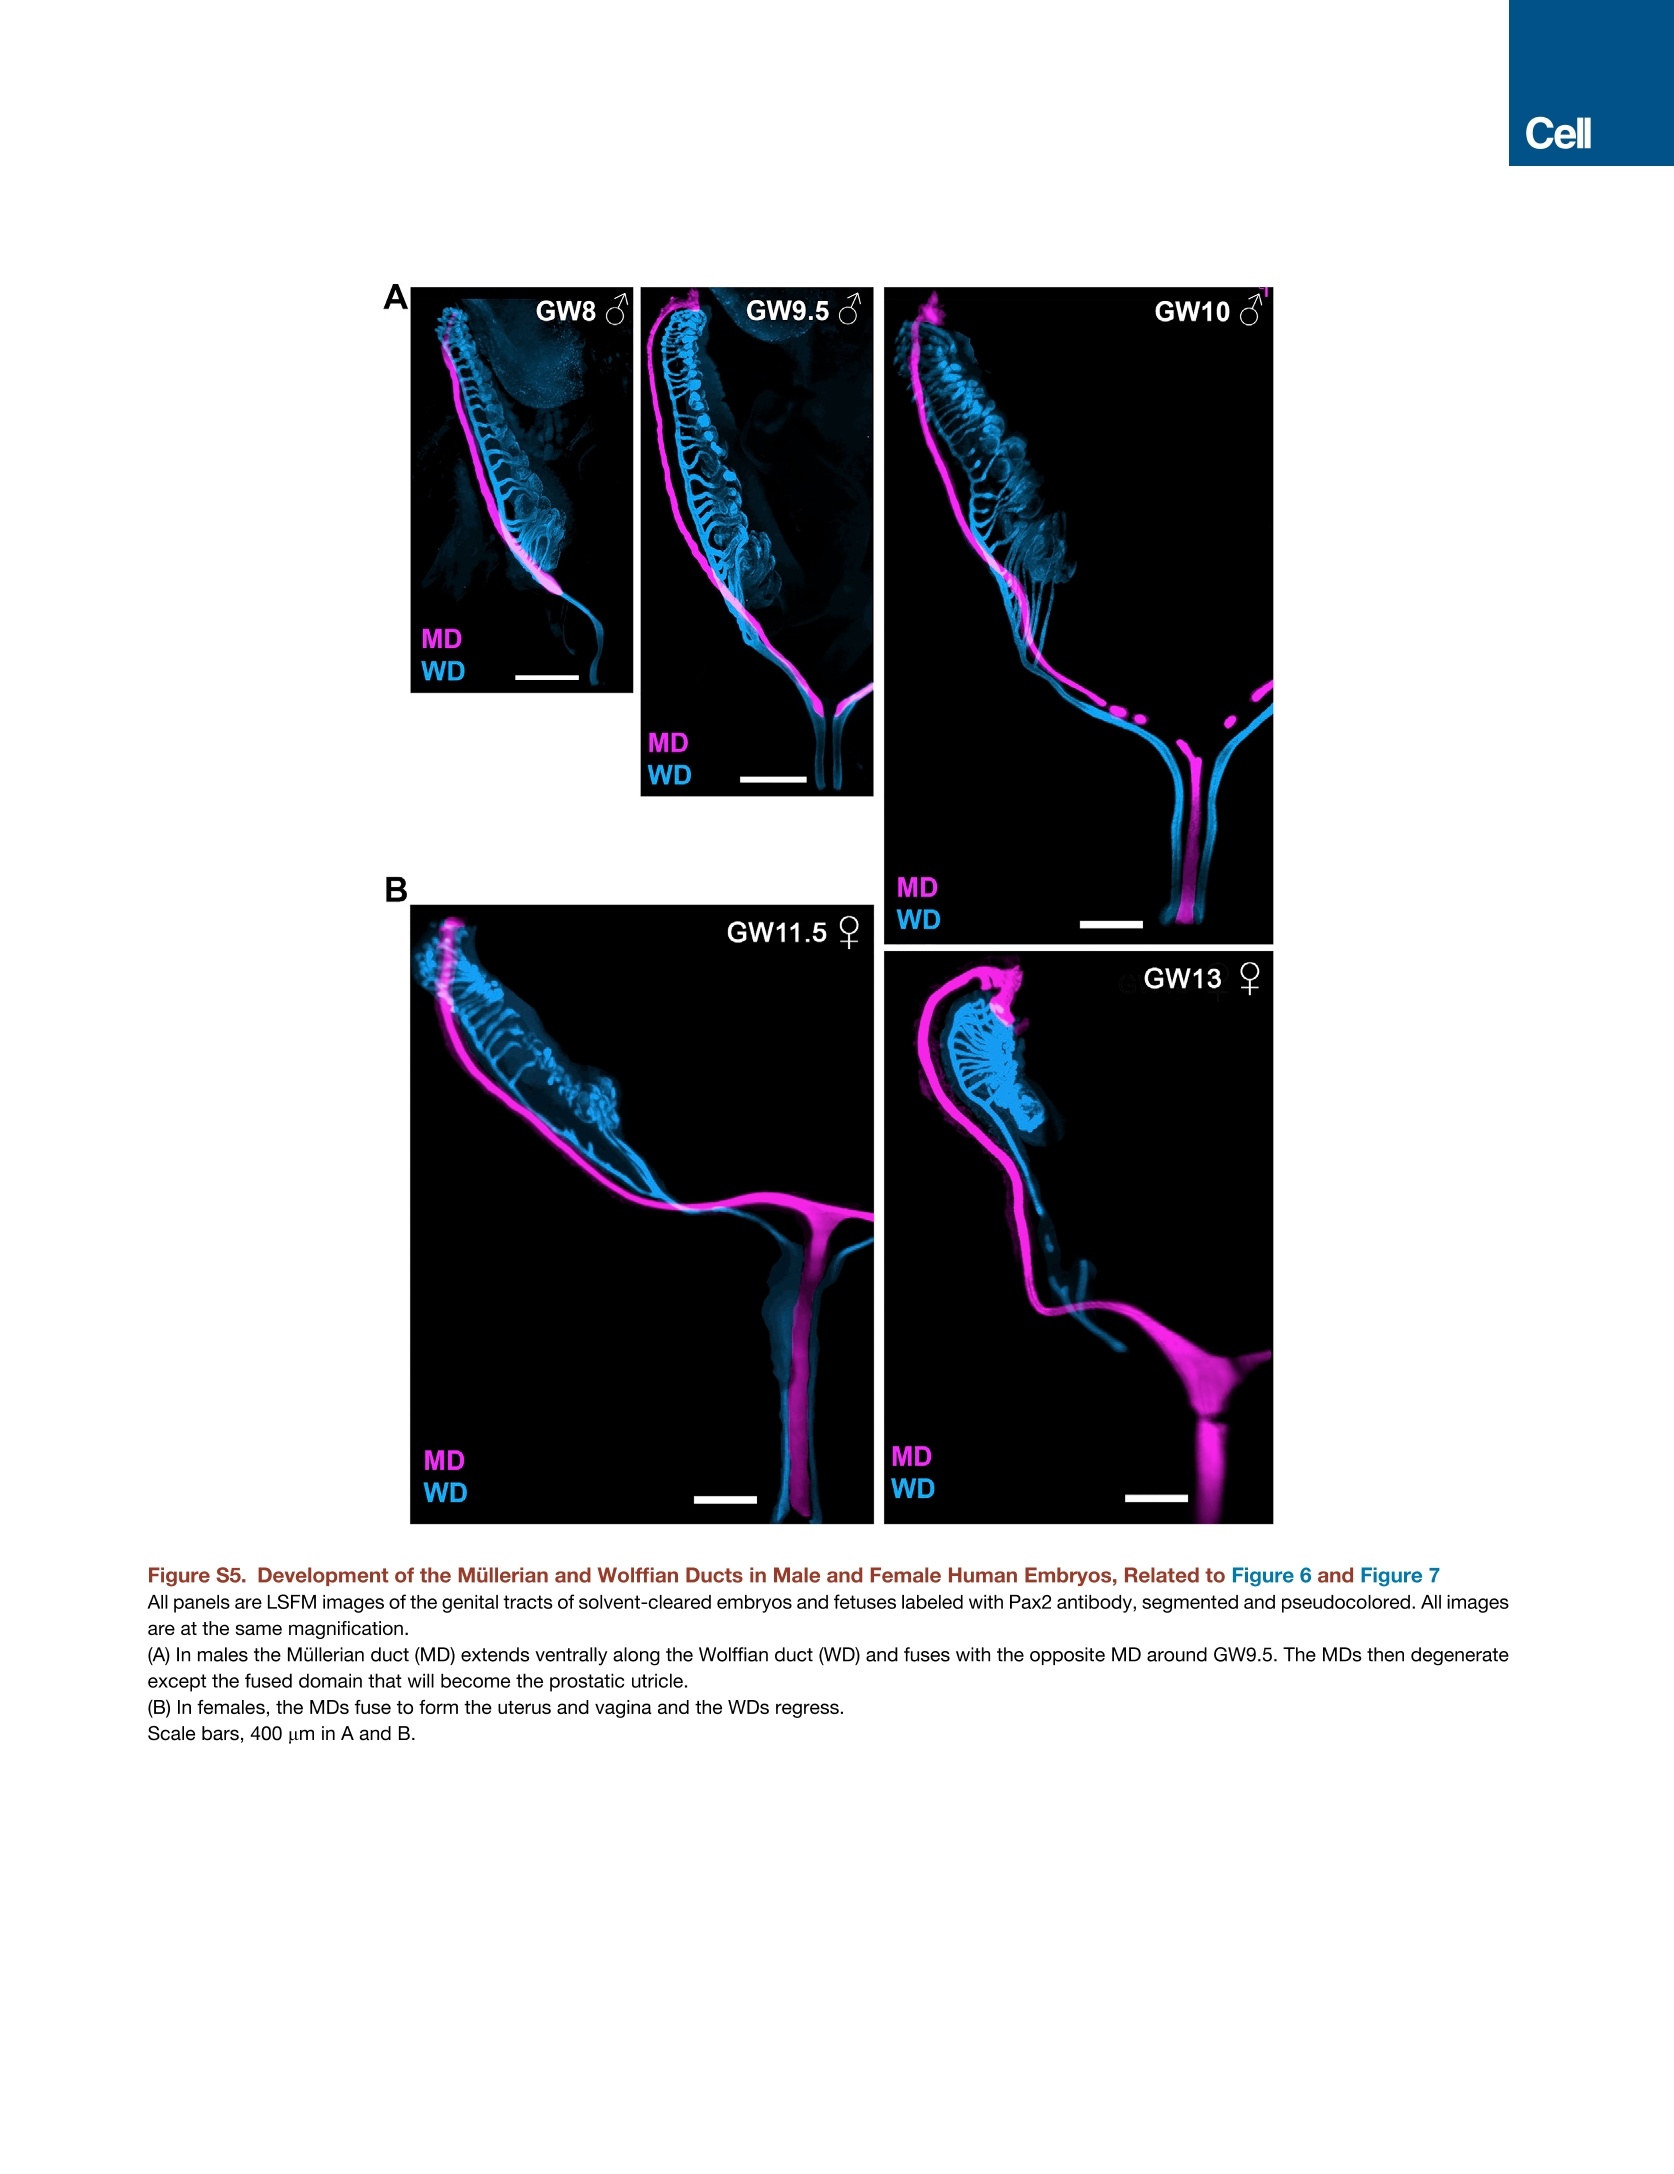
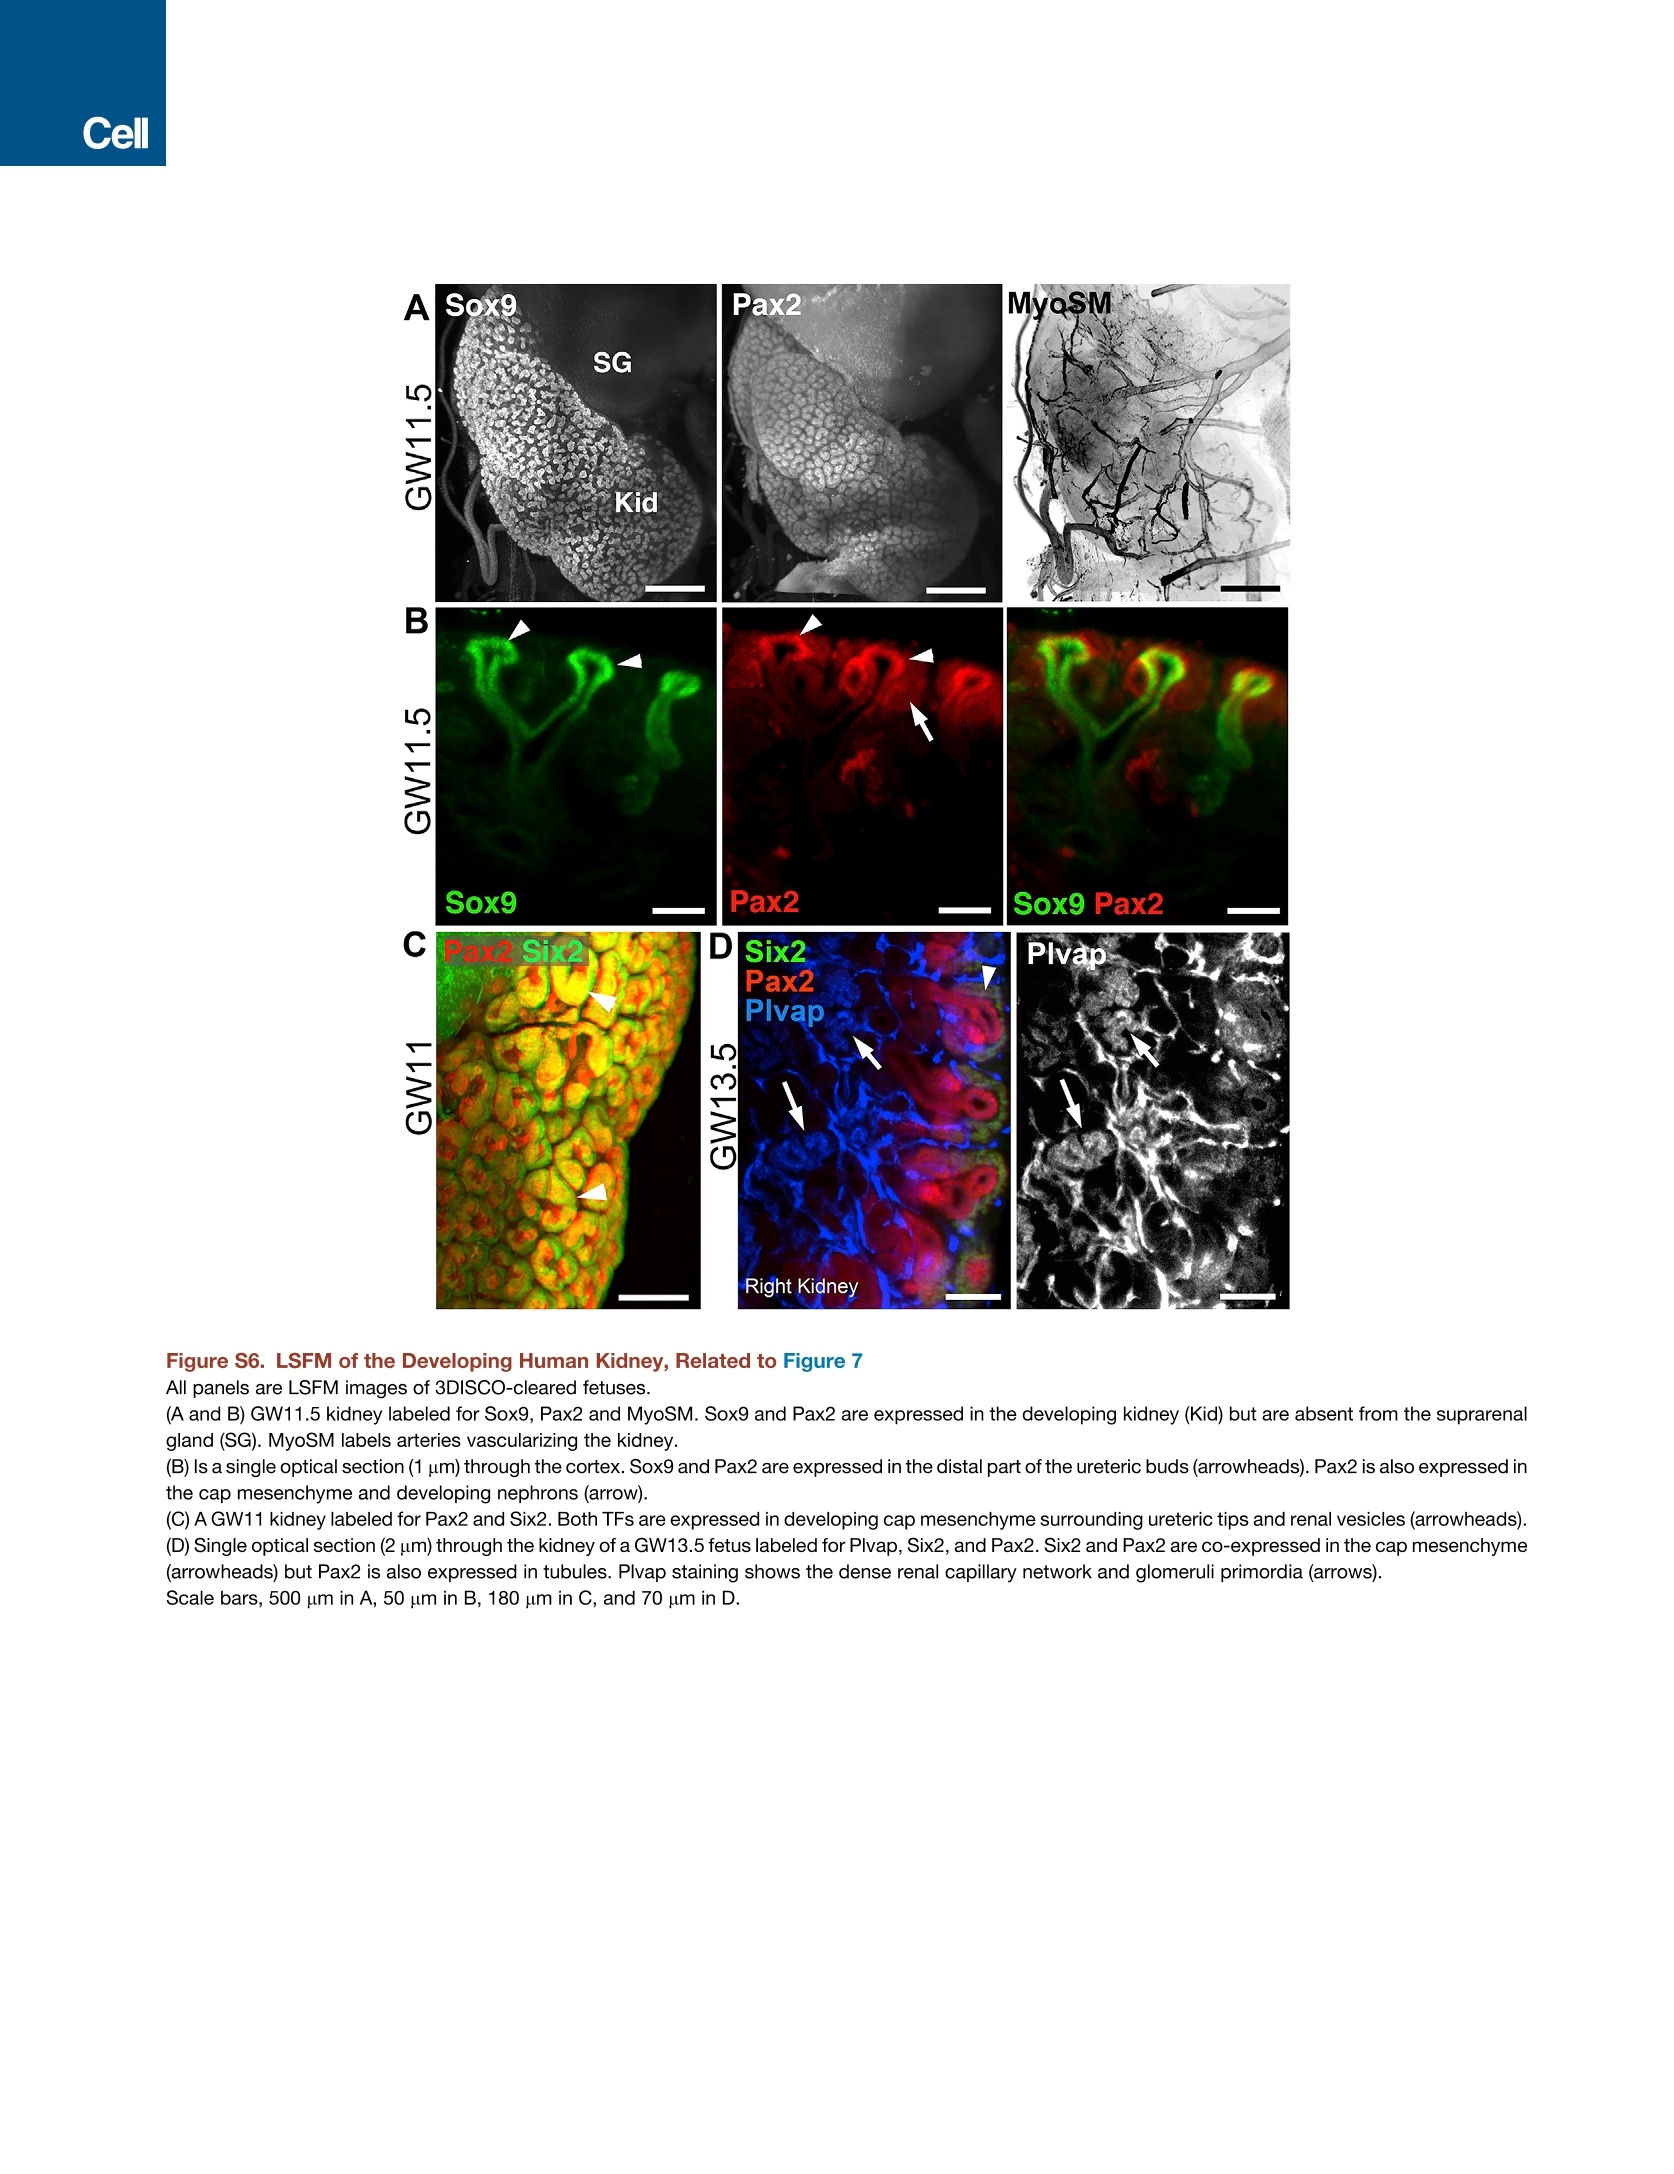

还剩24页未读,是否继续阅读?

产品配置单
QUANTUM量子科学仪器贸易(北京)有限公司为您提供《人类胚胎中3D成像检测方案(荧光显微镜)》,该方案主要用于其他中物理指标检测,参考标准--,《人类胚胎中3D成像检测方案(荧光显微镜)》用到的仪器有极速多角度3D光片荧光显微镜
推荐专场
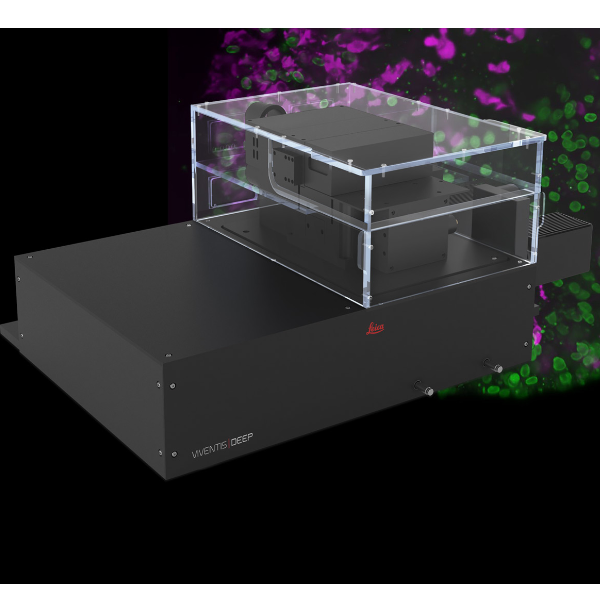
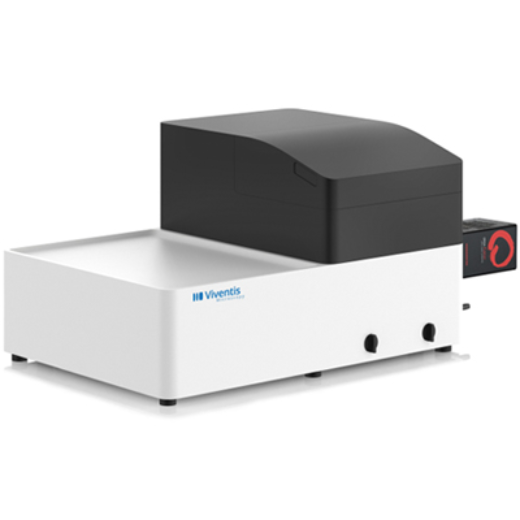
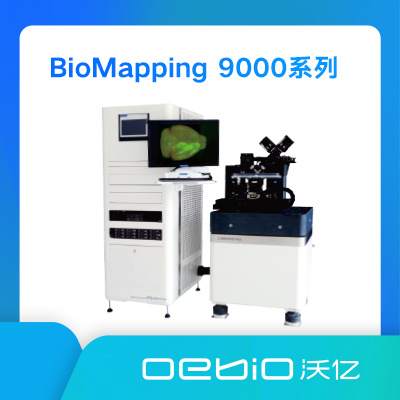
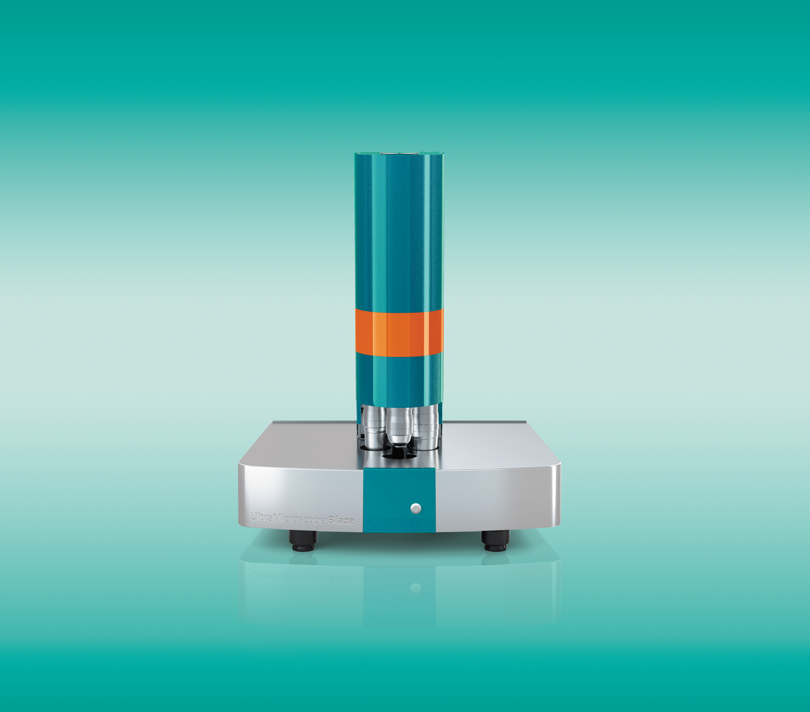
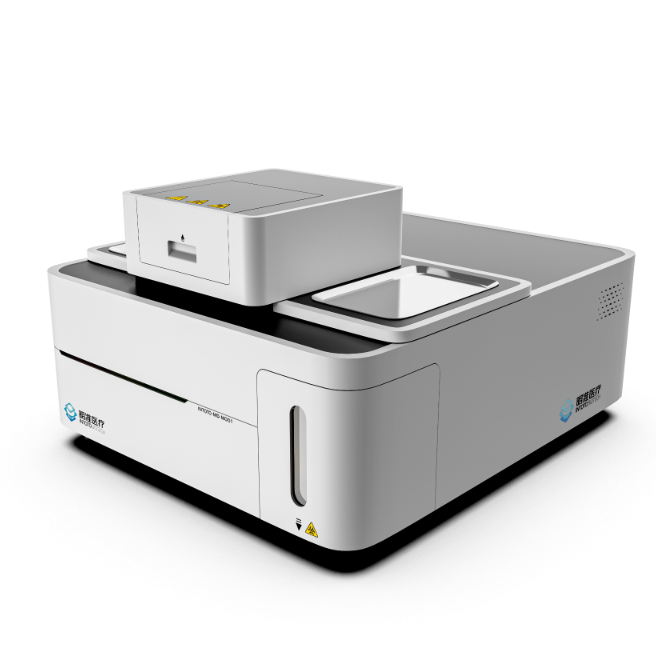
该厂商其他方案
更多