


方案详情
文
The simple yet highly sophisticatd character of these instruments has a major drawback: their simplicity significantly increases the potential foor misinterpreting experimental results.
方案详情

843CHAPTER 75-COATINGS CHARACTERIZATION BY THERMAL ANALYSIS PAINT AND COATING TESTING MANUAL844 Coatings Characterization byThermal Analysis by C. Michael Neag Authorized Reprint from ASTM MANUAL 17 OCopyright 1995 American Society for Testing and Materials, 100 Barr Harbor Drive, West Conshocken, PA 19428-2959 THERMAL ANALYSIS (TA) ENCOMPASSES A VARIETY of techniquesused to measure changes in material properties with changesin temperature. These techniques apply broadly in materialsscience and find use in characterizing liquids, polymers, andinorganic materials. The many results obtained using TA fitneatly into Van Krevlan's [1] classification of material properties. He divides material properties into three distinct butinterrelated categories: (1) intrinsic properties,(2)processingproperties, and (3) product or article properties. Intrinsicproperties such as the glass transition temperature (Tg) orelastic modulus arise from the chemical and physical struc-ture of a material, can be measured with precision,and mayform the basis for predictive empirical relationships. A mate-rial's process properties depend on the interplay of intrinsicproperties and process conditions (e.g., synthesis tempera-ture or mixing time). In essence, they reflect a material’sintrinsic properties in a dynamic environment. In practice,the interaction of a material's intrinsic properties and processproperties yield a unique product embodying still differentproperties. Unfortunately, the relationship between intrinsicproperties and process properties is poorly understood, diffi-cult to measure, and more difficult to predict. Because prod-uct properties depend on this ill-defined relationship, theirmeaning becomes quite subjective. Simply put, a paint madeand applied one day may behave quite differently than a paintmade and applied another day, and the reasons for the ob.served differences often remain obscure. Thermal analytical techniques provide tools to help clarifythese hard-to-understand relationships, helping to reduceproduct development time and manufacturing costs, whileshaping the best possible product. The instrumentation sup.porting thermal analysis has grown remarkably in both versa-tility and sophistication: automated systems, absolute con-trol of applied stresses, and tenth-of-a-degree temperatureresolution have replaced strip chart recorders,spring-loadedstresses, and "give or take a degree" temperature resolution. The advent of the inexpensive microprocessor chip proba-bly represents the most significant step in the development ofimproved commercial thermal analyzers. The developmentof powerful PC and microcomputer-based controllers havedramatically simplified experimental procedures, data collec-tion, and data analysis in thermal analysis. In general, auto-mating these instruments has dramatically improved the ex-perimenter’s control over the sample environment. These ( Associate scientist , The Glidden Company, a p art of ICI PaintsWorld G roup, G lidden R esearch C enter, 16651 S prague R oad,Strongsville, OH 44136. ) improvements allow technologists to complete complex ex-periments involving multistep heating programs and severalpurge gases. At the same time, calibration routines were alsosimplified and the accuracy and precision of the results im-proved. All of these advances came with the additional benefitof unattended operation. In fact, several commercial suppli-ers offer instruments with robotic control that permit theanalysis of scores of samples at the touch of a button. The simple yet highly sophisticated character of these in-struments has a major drawback: their simplicity signif.cantly increases the potential for misinterpreting experimen-tal results. With advances in automation, thermal analyticaltechniques have moved closer to simple "turn-key" opera-tions and have reduced considerably the technical demandson the user. TA has become a marvelously simple process thatunfortunately requires little understanding of the instru-mentation or the results. A few minutes in sample prepara-tion yields a raft of data from sophisticated data analysissoftware, considerably increasing the potential for error indata interpretation or analysis. The improvements in instru-mentation and software demand greater caution from thescientist in experimental design and results interpretation.Wendlandt [2] and Earnest [3] discuss the advent of automa_tion in thermal analysis, and two volumes edited by T.Provder [4,5] describe laboratory automation and computerapplications in polymer science more generally. Coatings and TA In the coatings industry-limited here to commercialpaints and industrial coatings-TA has proven to be a costeffective means for understanding the interrelationship between a coating's synthesis, formulation, and end-use per-formance [6]. Techniques historically important in coatingscharacterization can be broadly grouped under the headingsof differential scanning calorimetry (DSC), differential ther-mal analysis (DTA), thermomechanical analysis (TMA), dy-namic mechanical analysis (DMA) and thermogravimetry(TG). Techniques such as dielectric analysis (DEA) andevolved gas analysis (EGA) have gained popularity as tools forcoatings characterization as well. Although results are easilyobtained using these techniques, they are grounded in com-plex thermodynamic and kinetic principles. Excellent over-views of the foundations, instrumentation, and applicationsof thermal analysis can be found in reviews by Wendlandt[2],Wunderlich [7], and Turi [8,9]. The International Confedera-tion for Thermal Analysis (ICTAC) also provides an overviewof TA and a list of reference articles [561. While a single TA technique may adequately characterize aresearch or production problem for a given system, questionsoften arise in the coatings industry that require several ana-lytical techniques for adequate characterization. In fact, rely-ing on a single characterization method could lead to seriouserrors in interpretation and, depending on the problem, seri-ous financial consequences as well. The continuing develop-ment of simultaneous methods in TA underscores the valueof combining techniques. They offer the advantage of simul-taneous analysis of changes in physical and/or chemicalproperties under identical thermal conditions. There are avariety of these instruments available: examples of these "hy-phenated"techniques include TG-MS (mass spectrophotom-etry), TG-DTA or TG/FT-IR (Fourier transform infrared spec-troscopy). Industrial applications of thermal analysis for coatingcharacterization fall loosely into four areas: · Product research and development. · Problem solving. ·Quality control and quality assurance. · Competitor products analysis. While the results obtained using thermal analysis oftenfocus on intrinsic properties such as component Tg’s or thecomplex analysis of a material's viscoelastic behavior, ther-mal analytical methods are more typically focused on processproperties and product properties. This paper provides anoverview of the use of TA in the coatings industry and in-cludes descriptions of the instrumentation, experimentalconditions, and typical results. EXPERIMENTAL TECHNIQUES Scans were made using the TA Instruments’ (formerlyDuPont) 990, 9900, 2000, or 2100 temperature programmercontroller. Nonisothermal studies were completed at heatingrates varying from 5 to 15℃/min; isothermal temperatureswill be noted as required. All scans were made under drynitrogen or air. Each instrument was calibrated and operatedusing the manufacturer's recommended procedures. The typ-ical operating conditions for each instrument are describedbelow, with other important key experimental variablesnoted where necessary. A general overview of running experi-ments with each instrument is included at the end of eachsection. DSC-Nonisothermal scans were made variously using theTA Instruments’910 and 2910 DSCs, typically with 5.0 ±0.1-mg samples. Materials were usually scanned twice, ini-tially to establish uniform thermal histories and again tolearn about specific physical properties. Runs were generallymade at heating rates of 15℃/min between -125°and 250℃under a 50 mL/min nitrogen or air purge. In some instances,latex samples were introduced into liquid drop pans anddried in a controlled humidity chamber for a minimum of24 h before analysis. DSC Reaction Kinetics-Similar conditions to those de-scribed above were used, although heating rates were gener-ally held to about 5℃ per minute. Samples of unreactedmaterial weighing about 10 mg were placed in special pansfor liquid samples. In the residual heats of reaction experi- ments, heats of reaction were determined for samples re-moved from a batch reactor at 10-min intervals throughoutthe reaction process. The residual heats were measured un-der nonisothermal conditions using commercially availablesoftware. The ratio of partial heats of reaction to total heat ofreaction as the polymerization progressed was given as thepercent chemical conversion. DMA-DMA scans were made variously in vertical and hor-izontal modes on TA Instruments' 981, 982, and 983 DMAs.All studies were completed at 5℃/min, usually under nitrogenpurge. Cure studies employed either fiberglass braid suppliedby TA Instruments or stainless steel mesh (Cleveland WireCloth & Mfg., Cleveland, OH). In cure studies, 100-uL wetsamples were applied to substrates mounted in the DMAusing analytical pipettes [50 mL ± 0.5% to deliver (TD)].Isothermal temperatures were typically attained by mimick-ing the come-up time in an oven. For example, if a coatedpanel required 4 min to reach bake temperature in a produc-tion scale oven, then a similar time schedule was pro-grammed into the DMA. TMA-Thermomechanical and dilatometric experimentswere made using TA Instruments' 942 and 943 TMAs. Scanswere made at 5℃/min under nitrogen or air between about-50 and 250C. In general, the sample was cooled at least50℃ below the expected transition temperature. TMA scanswere typically made directly on coated substrates, while dila-tometric experiments were completed on samples varying be-tween 0.1 and 0.6 mm in thickness. In the penetration experi-ments, loads were typically about 5 g (0.05 N). DEA-The TA Instruments’2970 DEA and either theparallel plate or ceramic single surface sensors were used inthe dielectric experiments. Parallel plate sensors were used tostudy thin films removed from various substrates. Ram forcevaried from a few newtons to 175 N depending on the coat-ing. The ceramic single-surface sensor was used to studyresins and powders. 100-uL samples were spread uniformlyon the sensor and dielectric measurements recorded from 0.1Hz through 100 kHz in order-of-magnitude increments.Heating rates were selected to ensure that an entire set offrequencies (0.1 Hz through 100 kHz) could be recorded foreach 1℃ increase in the sample temperature. Samples weretypically scanned at 1 to 2℃/min between -125 and 200℃under nitrogen. TGA-TA Instruments’950,951, and 2950 TGAs wereusedin the examples described here. Samples used in typical ther-mogravimetric experiments usually weighed between 3 and10 mg. Scans were made at 10℃/min under nitrogen begin-ning at room temperature (RT) and ending at 600℃. Thehigh-resolution thermogravimetric analysis described herewas completed at 50℃/min in nitrogen at a resolution factorof 5;sample weights ranged between roughly 10 and 12 mg. DIFFERENTIAL SCANNING CALORIMETRY In differential scanning calorimetry (DSC), the differencein heat flow between a sample and a reference is measuredunder precisely controlled thermal conditions. Coatings gen-erally possess one or more characteristic transitions, includ- Temperature FIG. 1-Schematic DSC curve illustrating common transitionsobserved by DSC (Aq = heat flow). ing (1) the glass transition (Tg) or a transition related tochanges in specific heat; (2) exothermic peaks brought aboutby a physical process or a chemical reaction such as crystalli-zation or a chemical process such as a cross-linking reaction;(3) narrow endothermic peaks related to fusion or melting;(4) broader endothermic peaks caused by the volatilization oflow-molecular-weight materials, dissociation, or decomposi-tion; and finally, (5) an increase or decrease in heat flow withoxidative or thermal decomposition. The results shown inFig. 1 illustrate most of the transitions common in coatings.The DSC has a number of important uses in coatings charac-terization; two of the most important-Tg determination andreaction kinetics analysis-are described in more detail be-low. Glass Transition Temperatures-Probably the best under-stood and most commonly used property of polymers, glasstransition temperatures are important in virtually everyphase of a coating’s development and manufacture. The Tgmarks a polymer's transition from an amorphous glass to arubbery solid and defines the limits of processability for mostpolymers. In a nonisothermal or rising temperature DSCexperiment, the glass transition coincides with a relativelysharp increase in heat flow to the polymer and a correspond-ing increase in the polymer's specific heat. Several techniquescan be used in the assignment of a DSC Tg, including theonset, midpoint, and endpoint of the transition; in practice,the Tg is most commonly assigned to the extrapolated onsetof the transition. Sample Preparation and Tg Measurement-Measuring theglass transition temperature usually means nothing morethan removing a sample from a substrate, placing it in asample pan, and heating through the glass transition temper-ature in the DSC. Either of two techniques can be used todetermine the Tg. When the "product"Tg (including all pro-cessing and thermal history effects) is of interest, Tg's areobtained with a single temperature sweep. Where thermalhistory effects are unwanted complicating factors, two tem-perature sweeps are used. The first sweep removes thermalhistory effects (for example, sample preparation or aging effects) while the second sweep gives the Tg. The latter tech-nique works very well provided that there are no chemicalchanges, solvent losses, or morphological alterations duringthe first sweep. Sometimes, inconsistencies in sample preparation or aseemingly unimportant detail can significantly influence theinterpretation of the results-particularly when first runtransitions are required. In the example below, two latexes-one scraped from a glass slide and placed in a vented pan andthe other dried directly in a liquid drop pan-produced con-siderably different results. The samples were dried side byside in a dessicator before analysis. The sample scraped from the glass slide shown in Fig. 2exhibits a large endothermic peak centered around 75℃.Normally, this endotherm would suggest the loss of a volatilecomponent or an important morphological feature. However,the results for the latex dried directly in the liquid drop pansuggest that something else is influencing the results. Theheat flow curve for the latter sample exhibits no endothermand has a Tg some 15℃ higher than the sample removed fromthe glass slide. High-resolution videography resolved the is-sue, showing that the difference in Tg and the endothermic"event"was probably brought about by the softening andsubsequent relaxation of the latex pieces scraped from theglass slide.What appeared as a significant morphological fea-ture was nothing more than an artifact of the sample prepara-tion process. In a typical two-sweep Tg measurement, thisendotherm most likely would have been ignored and only thesecond run Tg reported, but, in studies that require the first-run data (as was the case here), the wrong conclusions couldhave been drawn. Tg and Composition-Tg’s obtained by DSC are also used toconfirm the accuracy of Tg's calculated from additive rela-tionships like the Fox equation [10]. The Fox equation andothers like it are employed by coatings chemists in synthesiz-ing copolymers to a specific Tg. Tg's obtained with theseequations are based on the interrelationship of the molar orweight fraction of each monomer and their correspondingTg's. While experimental results usually confirm the accuracyof Tg’s calculated with these relationships, experimental andcalculated results can deviate significantly from one another,a fact that underscores the need to verify expected resultswith an objective measure. The discrepancy between calculated and experimentallyobtained Tg's for four acrylic copolymers, shown in Fig. 3 andTable 1, aptly demonstrate the importance of corroboratingcalculated Tg’s by DSC. In this example, the Tg's determinedby DSC are much lower than the Tg's obtained using the Foxequation. Close examination of the DSC heat flow curvesgives outstanding clues about the character of the polymersbeing analyzed. Compared to a typical Tg, the transitions inFig. 3 are very broad-covering some 40 to 50℃—and quiteshallow, falling less than 0.1 cal/s/g from beginning to end.The character of the glass transition region in a typical DSC isquite different. The temperature range of this region is usu-ally no more than about 25℃ wide and usually drops morethan 0.5 cal/s/g over the Tg range. The differences betweenassigned and calculated Tg’s probably stem from the com-bined effects of monomer sequence distribution [11] and endgroup effects related to the relatively low molecular weight 0.4 FIG.2-Characteristics of the glass transition in identical latexes prepared by different methods. -0.3 FIG. 3-Glass transition temperatures for four acrylic copolymers. ( A uthorized r eprint from ASTM Manual 17 @ Copyright 1995 A merican S o ciety for Testing and M aterials ) TABLE 1-Calculated" and experimentally (DSC) determined Tg’s(℃) for four acrylic copolymers. Acrylic Copolymer DSC Tg Fox Tg “Tg’s were calculated using the Fox equation. [12] of these copolymers. The polymers used in this experi-ment were all low-molecular-weight tetramers (number aver-age molecular weight <5000) composed of various combina-tions of methylated and butylated acrylics. Van Krevlan [1]provides a more comprehensive overview of polymer proper-ties which could have an influence on the assignment of theglass transition temperature. REACTION KINETICS A number of techniques have been developed for measur-ing the kinetic parameters of chemical reactions from DSCdata. The primary advantage of these techniques over tradi-tional wet chemical techniques is their speed and simplicity.Research in reaction kinetics analysis by DSC includes stud-ies focused on isothermal techniques [13-15], nonisothermal(also known as temperature variant, rising temperature) ordynamic methods [16-17] and multiple scan methods[18-19].Each method uses the rate of heat evolution as thecomputational parameter, implicitly assuming that the reac-tion is not autocatalytic, has one rate-limiting step, and isunaffected by changes in reactant concentration or volume.The validity of kinetic data obtained using nonisothermalprocedures has been the source of considerable technicaleffort and discussion in the literature (see, for example, Refs20 and 21). Nonisothermal reaction kinetics analysis plays an impor-tant role in the characterization of coatings. Differentialmethods based on the work of Borchardt and Daniels [16] arethe most commonly used in obtaining reaction kinetics pa-rameters by DSC. These methods assume that the heatevolved during a reaction is proportional to the extent ofreaction. The order of reaction, n, the activation energy, E(kJ/mol), and the Arrhenius constant, A (s-), are determinedusing an equation based on a general nth order rate expres-sion where F(t,T) is the fractional extent of conversion [partialheat of reaction AH (t,T) divided by the total heat of reactionH], k is the rate constant, t is time, and T (K) is the absolutetemperature. The temperature dependence of the rate con-stant is given by the Arrhenius expression where R is the ideal gas constant (J/mol K). The methods usedhere have been described in detail elsewhere [22-23]. In nonisothermal kinetics experiments, autocatalytic reac-tions and first-order reactions are virtually indistinguishable because both reactions produce a uniform, monomodal, exo-thermic peak as the experimental temperature increases. Theonly way to determine the nature of the reaction mechanismis by running an isothermal experiment. An isothermal exper-iment will clearly differentiate between the two reactiontypes because the exothermic peak marking the maximumrate of reaction will occur at very different points, dependingon the nature of the reaction. In a reaction that obeys first-order kinetics, this peak will occur immediately after reach-ing the isothermal temperature. In an autocatalytic reaction,the maximum rate of reaction-and therefore the peak maxi-mum-occurs well after reaching the isothermal tempera-ture. Epoxy-Amine Reaction Kinetics Maximizing the efficiency of a reactor and minimizing rawmaterial waste in a chemical reaction depends inherently onknowing how a reaction proceeds and, more specifically, howlong the reaction takes to reach completion. Unfortunately,measuring the rate and degree of conversion in reactors hold.ing hundreds or even thousands of gallons is a prohibitivelyexpensive process during product scale-up. Small-scale labo-ratory DSC experiments representative of a production reac-tion can significantly reduce reactor time and process costs.Modeling the extent of reaction using DSC kinetics analysiscan further shorten the development process and can be usedto predict the extent of reaction under widely varying temper-atures and reaction times. In the example that follows, thesetechniques were used to optimize reactor time and improveproductivity in manufacturing. The reaction involved a typi-cal diglycidyl ether of bisphenol A (DGEBPA) epoxy and anamine. In this example, chemists arbitrarily placed the time toform an epoxy adduct at 8 h, a substantial manufacturingcost when considering reactor time and labor. However, pre-dictions based on nonisothermal DSC reaction kineticsshowed that the reaction should actually reach completionmuch faster than 8h. In fact, DSC reaction kinetics parame-ters (n = 1.1,E = 72.0 J/mol, and ln A = 19.2) indicated thatthe process should take about 2 h under the specified poly-merization conditions. These results were then corroboratedby measuring the residual heats of reaction (see experimentalfor details) observed in small samples taken from a 100-galreactor. Figure 4 compares predicted conversion with theresidual heats of reaction measurements. While neithermethod was extended to show the actual time required toreach 100% conversion, extrapolation to 100% conversionindicates the reaction should reach completion after about2 h. Table 2 compares selected data from Fig. 4 at specificreactor times. These results show that the reaction reached ahigher level of conversion (based on DSC residual heats) inthe manufacturing process (88%) than predicted by DSC(67%). Nonetheless, the extrapolated end-point from the DSckinetics analysis-although a bit high at 2.5 h-is much bet-ter than the 8-h reactor time set arbitrarily by the chemists.The discrepancies between the measured and calculated degrees of conversion are probably related to competing sidereactions that could occur in DSC experiments (i.e., at ele-vated temperatures) but not during manufacturing and alsoto the vast difference in the reaction conditions: DSC kinetics FIG. 4-A comparison of actual and predicted degree of conversion in an epoxy-amine reaction. The predicted degree of conversion at each point was based on DSCkinetics analysis, while the actual degree of conversion at each point was based onthe residual heat of reaction on samples removed from the reactor. analyses were made using fresh 5-mg samples, while the re-sidual heat studies were made with samples taken from a100-gal reactor. Coatings Characterization by DSC Sample Preparation: The materials typically analyzed inthe coatings industry can come as either solids or liquids.Solids require little special preparation; they just need to fit in TABLE 2-Chemical conversion obtained from residual heats ofreaction and simulations using DSC kinetics parameters. Reaction Actual % Predicted% Time, min Conversion Conversion 0 0 ... 10 14 19 20 31 33 30 49 43 40 61 53 50 81 61 60 88 67 the pan and, most importantly,remain very flat on the bot-tom of the pan. Liquids are another matter and usually re-quire a special container for analysis. No matter what theform, limit your sample size to somewhere between 5 and10 mg. Large samples (>10 mg) may not heat uniformly,with the outer layers heating more rapidly than the center ofthe sample. You can also get results with samples in the 1-mgrange, but using smaller masses can reduce resolution. For amore accurate assignment of the Tg, use high sample weights(ca. 20 mg) and slow heating rates (1℃/min). Either open or closed pans can be used. We prefer closedpans with perforated (use a fine needle) lids. Lids help keepthe DSC oven or cell clean; the perforations prevent pressurebuildup caused by solvents or low-molecular-weight reactionproducts. Many others use only open pans. Liquid paint and latex samples are treated somewhat dif-ferently in that they are placed in open pans (especiallydesigned for liquids) and allowed to dry (24 h minimum)before analysis. This approach prevents the development ofartifacts that sometimes occur when a dried sample isscraped from a substrate and placed in the pan. Purge gas:TThe selection of purge gas depends on yourobjectives. High-purity dry nitrogen (99.99%) is typicallyused. It offers low cost and reasonably good heat transfer.Argon, another frequently used gas, improves heat transferand the resolution of the analysis but at increased cost. Purgerates vary with the instrument. Temperature Range and Heating Rate (B): Start eachtemperature sweep at about -125℃ and end at least 50℃above the Tg. This temperature range will include any transi-tions in typical coating systems that could affect perform-ance. If you know the Tg of your sample and you areunconcerned about ancillary transitions, use the 50/50 rule:start runs 50℃ below the Tg and end them at least 50℃ abovethe Tg, making sure that the sample has time to equilibrate atthe starting temperature. The important consideration in selecting a heating rate isheat transfer and the steady state conditions in the sample.For routine analysis, a 15℃/min heating rate offers a goodcompromise between run time and resolution. Keep in mindthat high heating rates can produce thermal lag in the sampleand tend to broaden transitions. And, when there are two ormore transitions, they tend to run together. Slower heatingrates are usually used where there is a need for high resolu-tion. But, when time is not a concern, slower rates are alwayspreferable. There are also instances, for example film forma-tion experiments, where isothermal temperatures are neces-sary. Choose an experimental temperature slightly higherthan ambient, say 30C, for controlled room temperatureexperiments. Thermal History: In most analyses, the sample should beanalyzed twice. In unreactive systems, the first sweep erasesany effects of the sample’s previous thermal history and es-tablishes a uniform baseline for each sample-this is espe-cially important in comparing a series of samples. In reactive materials, analyze through the cure tempera-ture and allow for the reactionto reach completion.Determining the proper temperature range may require some"scoutingexperiments. In isothermal cure studies at ele-vated temperatures, try to simulate bake conditions. Select aninitial heating rate that approximates come-up time for asubstrate in an oven and add enough time at the bake temper-ature to match the typical oven “dwell" time. Data Collection::IIn non-isothermal or rising temperatureexperiments, try to average between two and eight datapoints per degree Celsius increase, depending on the experi-mental objectives. Higher heating rates require higher data-collection rates to obtain the same resolution. Note that highdata-collection rates at slow heating rates can produce largedata files. Data collection for isothermal studies must betuned to the time required for an event to occur. Fast eventswould require high data collection rates; slower events wouldrequire correspondingly lower rates. DYNAMIC MECHANICAL ANALYSIS DMA measures the viscoelastic response of a material un-der a periodic load. Dynamic mechanical analysis representsone of several methods for mechanical properties analysis[24-26] providing a valuable link between chemistry, mor-phology, and performance properties [27-29]. The DMA’sapplications range from the measurement of bulk viscoelasticproperties to the sophisticated analysis of the kinetics of the cross-linking reaction. Depending on the geometry of theclamps and the instrument’s design, the oscillatory load ap-plied may be in flexure, tension, compression, or torsion;sample oscillation may be either at resonant frequency or atfixed frequency. These tests simultaneously produce elasticmodulus and mechanical loss or damping values. Modulusvalues (flex, Young's, shear, bulk) provide an indication ofmaterial stiffness, while mechanical damping correlates withthe amount of energy dissipated as heat during the deforma-tion of the material. In tensile mode, these instruments canprovide creep and stress relaxation data and can even be usedin WLF [30] transformations (see Ref 30). In the coatings industry, DMA is broadly applicable to thestudy of film properties [31] and particularly important forcure process studies [32-34]. Another important applicationof the instrument involves characterizing paints after appli-cation and the film-formation process. A detailed overview ofthe use of DMA in thermoset cure studies is provided later inthe chapter. Figure 5 illustrates the typical viscoelastic re-sponse for a generalized polymer coating. In this example,the glass transition temperature corresponds to a large de-crease in modulus beginning near 25℃ and a peak centeredat about 70℃ on the loss modulus curve. In noncrystallinepolymers, transitions found below the Tg or in the glassystate are usually associated with the molecular motion of thebackbone or small groups pendant to the main chain. At thesame time, modulus values in the region above the Tg-therubbery state modulus-impart information about a mate-rial's molecular weight or degree of cure, depending on thematerial. In thermoplastic materials, increasing rubberystate modulus values usually indicates increasing molecularweight. In thermoset materials, increasing rubbery statemodulus values indicates higher cross-link density. A morecomplete description of the dynamic mechanical propertiescan be found in monographs by Nielsen [24,25] and Ward[26]. Synthetic Variables and Morphological Character One of the strengths of dynamic mechanical analysis lies inits utility for resolving the effects of relatively minor changesin formulation or processing. Differences in these variables(usually) induce easily discernable changes in the viscoelasticproperties of a polymer. For example, the materials shown inFigs. 6A and 6B are both epoxy acrylic coatings used in foodpackaging. While the coatings are made of virtually the samematerials, their chemistries and processing conditions aredifferent. The presence of two glass transitions in the relative modu-lus curves in these graphs indicates that both coatings areheterogeneous systems. However, these curves give little indi-cation as to whether the epoxy or the acrylic is the continuousphase. A comparison of the damping peaks reveals a differ-ence in the peak intensity (or peak height) of the two transi-tion regions. In filled systems, polyblends, and grafted sys-tems, the intensity of the damping peak gives a roughestimate of the concentration of the components and an indi-cation of which phase is continuous. The greater the concen-tration, the larger the damping peak and the more likely thatphase is continuous [24]. In Fig. 6A, the epoxy phase peak atroughly 130℃ has considerably greater magnitude than the 13 Temperature (°C) FIG. 5-Typical viscoelastic response in polymeric systems, log relative modulus (E') and log relative loss(damping, E"). one assigned to the acrylic and so would be the continuousphase. In Fig. 6B, the opposite is true. In this case, the acrylicphase centered near 90℃ is continuous while the epoxy is thedispersed phase. Aside from the information on morphology, these curvesalso give us information on the relative miscibility of thesesystems. If these two polymers were totally miscible, both themodulus and damping curves would have only one transition.Since there are two, it is clearly a two-phase system. Carefulscrutiny of the two systems reveals that the peaks in Fig. 6Bfall much closer together than those in Fig. 6A. This stronglysuggests that the conditions used to produce the material inFig. 6B produce a more miscible polymer. Coatings Characterization by DMA Dynamic mechanical analysis can be one of the most de-manding and least forgiving of all the TA techniques. It’svitally important to spend time learning the instrument'sidiosyncrasies before putting complete faith in the viscoelas-tic measurements the instrument produces. Each commer-cial instrument offers unique sample mounting geometriesand usually offers a variety of experimental approaches.Re-gardless of the experimental approach, take the time to run ahalf-dozen experiments using identical experimental condi-tions so that you can better understand the range of results toexpect under a given set of experimental conditions. Sample Preparation: There are several approaches toforming free films for DMA investigations. These includecoating low-energy surfaces like PTFE (Teflon) or polypropyl- ene or coating thin aluminum sheet stock, allowing sufficienttime for film formation, and dissolving the aluminum awaywith an alkali. Sample dimensions must always conform tothe limits prescribed by the instrument manufacturer; wher-ever possible, however, sample thickness should closely ap-proximate the thickness of the coating film in the field. In thisway, test results will more closely represent those found inrealistic end-use conditions. Unfortunately, free films are not always a viable experi-mental choice. In those instances, coated substrates,e.g. verythin stainless steel shim or fiberglass braid, are often used.Although constitutive equations are available for obtainingabsolute mechanical properties values from coated sub-strates, usually only relative measurements are made usingthis approach. To insure uniform thermal histories, prepare specimens ina controlled environment. Small differences in film-formingtemperature or humidity in replicate runs on the same coat-ing can make it appear as if two different coatings had beentested. Well-controlled and consistent sample preparation al-lows the additional advantage of comparing results from testsmade over many months or years without concern aboutdifferences in film-forming conditions. Heating Rate: Undoubtedly, one of the most, if not themost, important consideration is choosing proper heatingrates. While most instruments make rapid heating rates avail-able (some manufacturers claim 200℃/min), it is wisest tochoose very slow heating rates-at most, heating rates ofabout 1 or 2℃/min. Slow heating rates allow the entire sam-ple to equilibrate to temperature change and thereby improvethe reliability of transition temperature assignments. When FIG. 6-Dynamic mechanical properties of epoxy/acrylic copolymers. time allows, the best way to control thermal lag in the sampleis by using step-change experiments. This kind of experimentcombines slow heating rates (1 to 2℃/min) and isothermal“steps” (1 to 5 min), which allow the sample to equilibratebefore heating to the next isothermal step. For thin coatings,shorter isothermal periods (1 to 2 min) are satisfactory, whilethicker samples require longer (e.g., 5 min) isothermal steps. Strain or Oscillation Amplitude and Frequency:: In gen-eral, the greater the applied stress, the longer the relaxationtime. Ideally, the sample should come close to full recoveryfrom one applied stress before the next one begins. Thismeans the experimenter should choose well-matched ampli-tudes and frequencies. For example, choosing a large me-chanical deflection means that the time between the appliedstresses should be longer. Conversely, higher-frequency ex-periments should have correspondingly smaller appliedstresses. The proper relationship between the test frequencyand oscillation amplitude will ensure that the sample hascome close to mechanical equilibration between"events." Inmost instruments, the amplitude of the deflection is based oncontrolled strain. In these instruments, the maximum appliedstrain should be at 0.1%or less. This is particularly importantin filled systems (like coatings), which will exhibit nonlinearresponses more readily than unfilled systems. Because mechanical relaxation times vary widely in poly-mers, there are no specific rules governing the selection ofoscillation amplitudes and test frequency. As a general rule,oscillation amplitudes of a few tenths of a millimeter at 1 Hzare commonly accepted practical“standards."In very hard(brittle) or very soft materials, however, it’s generally best toperform a controlled stress (stress relaxation or creep) experi-ment rather than an oscillating stress experiment. Gas Flows:S:Where possible, apply a uniform gas flow. Wearbitrarily set our gas flow rates so that gas content in theoven chamber"turns over"about once every 1 to 2 min. Sincethe size of these chambers varies considerably, flow rates will,too. If in doubt, use the manufacturer's recommended purgerates. THERMOGRAVIMETRY (TGA) Thermogravimetry describes an analytical technique usedto monitor a change in sample mass as a function of time ortemperature. Depending on need, either isothermal or non-isothermal experiments are possible; nonisothermal experi-ments-where the sample temperature changes at a linearrate-represent the most frequently used mode. In coatingstechnology, the instrument is most frequently applied incompositional analysis,e.g. nonvolatile content, and for stud-ies of thermal stability. The technique can also be applied instudies of accelerated aging, decomposition kinetics, and oxi-dative stability. In recent years, improvements in commercial instru-mentation have enhanced resolution to about 0.05 mg. Theprimary differences between the types of commercial instru-mentation center on the furnace type, the quality of the soft-ware, the control of gas flow, and the sensitivity of the micro-balance. In addition, high resolution TGA and a roboticsystem are also available. Coupled with a mass spectrometer,gas chromatograph, or FT-IR, TGA becomes a powerful ana- lytical tool combining both physical and molecular probes ina single technique. Compositional Analysis-From time to time, performanceproperties will change because a material supplier makeschanges in the formulation or manufacture of a product.Although the supplier may not recognize it, relatively minorchanges in a material can engender major changes in a coat-ing'’s performance, sometimes with a monetary consequence.Thermogravimetry provides one means for learning moreabout the composition of a material and when problems arisehelps maintain acceptable performance. In this example, anunusual "settling"problem was traced to a subtle differencein the composition of a wax used in the paint formulation. Other than a difference in the melt enthalpies, studies byDSC and conventional TGA (ramped at 10℃ in N) analysisrevealed that these waxes were virtually identical. However,when characterized using high-resolution thermogravimetry,small but significant compositional differences between thegood (A) and suspect (B) samples became apparent. Figure 7A shows the relative weight change in these materi-als as they decompose to carbon-char. Weight loss followsroughly the same path, regardless of the lot tested: beginningwith a small step near 175℃, weight loss proceeds through amajor step at around 300℃ and ends with another small stepbetween 450 and 500C. The derivative (%/℃) curves shownin Fig. 7B offer the best illustration of the differences betweenlots. Each of the peaks in this figure represents a differentdecomposition step or combination of steps. If these materi-als were truly the same, the shape of the peaks and the peaktemperatures would be virtually identical, but these materialspossess several differences. Most notable are those associatedwith the peak between 250 and 300℃: the shape and positionof this peak varies significantly. Working closely with the waxmanufacturer, these results helped to identify a processingerror and led to narrower manufacturing specifications. Ear-nest [3] provides a more detailed overview of thermogravi-metry and its application to compositional analysis. Table 3describes the differences in the thermal behavior in these lotsof wax. Volatile Organic or Moisture Content-With ever-tighteningregulatory requirements, measuring the moisture or volatileorganic content (VOC) has become increasingly important inthe coatings industry. Figure 8 shows the relative nonvolatilecontent of two polystyrene latexes. Beyond simple measure-ments of volatile content, the technique is an excellent way todetermine the amount and rate of evolution of decompositionproducts. Thermal Stability-TG is also used widely to monitor thestability of polymeric coatings. Figure 9 shows that the long-term degradative stability of a coating based on a vinyl-esterresin was superior to a similarly formulated coating based onan epoxy resin. The information shown here was useful inestablishing the cost-effectiveness of the vinyl-ester system. Coatings Characterization by TGA Sample Preparation:The materials typically analyzed inthe coatings industry can come as either solids or liquids.Neither solids nor liquids require special preparation; theyjust need to fit in the pan. Like DSC, limit your sample size to FIG. 7A-Weight loss curves for waxes with ostensibly identical compositions. Temperature (°C)FIG. 7B-A comparison of the weight loss derivatives for the weight loss curves shown in 7A. TABLE 3-Wax melt characteristics and decomposition characteristics. Total Decomposition Sample Condition Tm -1(℃) AHm Onset-1,℃ % Char A Control, dry 87.7 75.7 172 38 B Suspect, dry 87.4 46.1 150 43 FIG. 8-Polystyrene nonvolatile (NV) content mea-surement obtained through TG. somewhere between 5 and 10 mg. Large samples (>10 mg)may not heat uniformly, with the outer layers heating morerapidly than the center of the sample. For solids, the physicalform of the sample is very important to the resolution of the FIG. 9-Thermal stability of vinyl-ester resin. test results. If the surface area is large, for example a powderor highly divided solid, then higher masses-as much as40 mg-may be used without significantly reducing the sen-sitivity measurement. Choose the mass of a liquid samplebased on the amount of solid material present, for example,use at least 10 mg of a liquid containing 50% solids. Beyondsample considerations, be aware that both aluminum andplatinum-metals which are used in a typical TGA pan--canoccasionally catalyze a portion of the decomposition processin some materials. your objectives. High-purity dry nitrogen (99.99%) is typi-cally used. It offers the benefit of low cost and reasonablygood heat transfer. Argon, another frequently used gas, im-proves heat transfer and may improve the resolution of theanalysis but only at increased cost. In some instances, youmay want to control the humidity of your purge gas. A simple,low-cost method involves bubbling the purge gas through DIwater in a bubble tube and running the effluent into theinstrument. Relative humidity values can reach 80% usingthis approach. Purge rate requirements vary with the instru-ment. In most com-positional analyses, our experiments are run between roomtemperature and 600℃. This temperature range suits mostcoating systems because, as a rule, polymers (coatingbinders) usually begin to decompose somewhere between250 or 350℃ and are gone by 450℃. When running liquids,pay very close attention to the instrument’s set-up time beforeit begins to collect data. In highly volatile materials, as muchas 10% of the volatile material can be lost before the first datapoint is collected in the experiment. The difficulties with in-terpretation in this situation should be obvious. The most important consideration in selecting a heatingrate for your experiments is heat transfer and the steady-statecondition of the sample. For routine analysis, a 10℃/minnonisothermal temperature ramp offers a good compromisebetween run time and resolution. Keep in mind that highheating rates can produce thermal lag within the sample,which in turn will broaden transition regions. In instanceswhere a sample exhibits two or more weight loss transitions,they will tend to run together at higher heating rates. Slowerheating rates are usually used where there is a need forimproved resolution and run time is not a concern. Whereisothermal temperatures are necessary, choose an experi-mental temperature most representative of the end use re-quirements. A few instrument vendors offer "high or enhanced resolu-tion"capabilities, a technique which, in essence, combinesthe virtues of a rising temperature experiment with the bene-le-fits of an isothermal experiment. Whatever the manufac-turer’s recommendation, make certain that the gas flow ratesare identical for each part of your experiment. Analyzing thesame sample with even small variations in gas flow (less than5 mL/min) can produce dramatic changes in the weight losscurves or the weight loss derivative curves. In fact, one mate- rial can appear to be two simply because of differences in thepurge gas flow rate. These differences occur because thedegradation mechanism is sensitive to temperature and hold-ing the sample under near isothermal conditions can amplifya mechanistic step that would normally play a minor role in astandard rising temperature experiment. All of these precau-tions serve to emphasize one important fact: the experi-menter must have a good grasp of the chemistry of decompo-sition when performing these experiments. Otherwise, heruns the risk of misinterpreting the results obtained for thedecomposition process. Data Collection:Try to average between two and eight datapoints per degree Celsius increase, depending on the experi-mental objectives. Higher heating rates require higher datacollection rates in order to obtain the resolution obtained atlower heating rates. In some commercial instrumentation,the data collection rate can be varied from low to high atvarious steps in the experimental procedure.Note that highdata collection rates at slow heating rates can produce largedata files (using valuable disk space!) while yielding little orno improvement in the resolution of the data. THERMOMECHANICAL ANALYSIS (TMA) Thermomechanical experiments measure changes relatedto sample dimension as a function of time or temperature.These changes depend on both viscous (energy dissipative)processes and elastic (energy storing) processes within thematerial. Daniels [35] linked thermally dependent changes indimension with various kinds of molecular motion: changesin dimension correlate with chemical reactions, lattice vibra-tions, changes of state, the glass-rubber transitions, changesin crystalline structure, or some combination of these phe-nomena. Riga and Neag [36] and Earnest [37] provide a thor-ough review of thermomechanical techniques and applica-tion in materials science. The techniques associated with TMA are broadlvapplicable in materials science and are used in characterizingliquids, polymers, and inorganic materials. In practice, TMAis most commonly used in assigning transition temperaturesor determining the coefficient of linear thermal expansion (a)by linear dilatometry. Descriptions of thermomechanicalanalysis (TMA) generally include linear dilatometric tech-niques because the same instrument can be used for thermo-mechanical and thermodilatometric experiments..\Whenchanges in sample dimensions are measured with a negligibleload, the technique is more properly referred to as linearthermodilatometry (TDA). Depending on the experimentalobjective, any one of several probe types may be used. TDA is typically applied in studies of ceramics, glasses, andmetals-materials that exhibit a primarily elastic response(particularly for a)-or for determining glass transition tem-peratures (Tg) in polymeric materials. Dilatometric experi-ments are usually applied over a range of temperatures repre- sentative of the product’s end use, but may begin nearabsolute zero and reach as high as 2500℃ [35]. Ther-momechanical analysis is most often applied in characteriz-ing polymers or composites (e.g., most coatings), where theviscoelastic properties of a substance often dominate the ma-terial response. Thermomechanical studies usually employ anarrow range of experimental temperatures, typically fallingbetween -175 and 850°C. Instrumentation-The kind and quality of information ob-tained from a thermomechanical analyzer depends primarilyon the arrangement of the sample and probe type. The pene-tration mode is probably the most commonly used arrange-ment in TMA and is usually used in assigning transitiontemperatures, such as the glass transition temperature orsoftening point temperature, in polymeric materials. In thismode of operation, substrate effects become increasingly im-portant as the sample thickness decreases. This is particularlytrue in the analysis of thin films and coatings [38]. Tensiontests are often used in characterizing the properties of thinfilms. In fact, improvements in instrumentation, particularlyin controlling the applied force and fully automated opera-tion, make possible the characterization of more fundamen-tal viscoelastic properties such as creep and stress relaxation.These improvements have also increased the resolution ofthese instruments considerably. The resolution of these in-struments ranges from about 500 nm in first-generation com-mercial instruments (ca. 1975-80 and earlier) to claims ofless than 5 nm in second-generation instruments. Dilatometry-This method has broad applicability in coat-ings technology, such as in determining the coefficient ofthermal expansion (CTE). It is particularly valuable in failureanalysis. For example, mismatches in CTE appear to play arole in the failure of two-coat systems such as gel coats. Gel coats are polyester/styrene systems that are sprayeddirectly onto a mold surface and allowed to advance to a tack-free state. A fiberglass mat is then placed onto the partiallycured gel coat and a reinforcing laminating polyester resinapplied to the fiberglass mat. The laminate is removed fromthe mold after reaching optimum cure under ambient condi-tions. If the gel coat or laminating resin is improperly for-mulated or undercured, differences between the CTE valuesmay be large enough to cause delamination at the interface. Ideally, the CTE values for the members of the part shouldbe the same or only slightly different. In this instance, how-ever, the differences in CTE values shown in Table 4 led todelamination and the eventual failure of the part. Subsequentanalysis of residual heat of reaction by DSC showed that thegel coat was improperly cured. Inadequate cure led to appre-ciable differences between the CTE values of the gel coat andlaminate, and ultimately, to the failure of the system. Figure10 provides a comparison of the CTE curves for the gel coatand polyester laminating resin. TABLE 4-Gel coat and laminating resin CTE values (PPM/C). No. of Avg Standard Material Runs CTE Deviation Range Gel Coat 4 5.0 0.2 5.0-5.3 Laminating Resin 5 5.9 0.1 5.8-6.1 TMA COEFFICIENT OF EXPANSION TEMPERATURE (deg C) FIG. 10-A comparison of the CTE curves for the gel coat andpolyester laminating resin. Thermomechanical Analysis Softening point temperatures (SPT) and total probe dis-placement obtained using thermal mechanical analysis pro-vide valuable insight into a coating's performance, particu-larly in comparing the relative degrees of cure in productionmaterials. For example, when cure levels in two containercoatings were compared-one of which failed QC tests aftermanufacture-TMA results strongly suggested that the failedcoating was undercured. The TMA results in Table 5 showthat the failed coating had a lower softening point tempera-ture and greater total displacement than the coating thatpassed. Rebaking the failed coating led to an increase in SPTand a decrease in probe penetration. While the changes inSPT and probe displacement indicate an improvement in per-formance, they still failed to match those of the coating thatpasses the QC test. Intentionally undercured coatings yieldedsimilar results, strongly suggesting that the coatings thatpassed reached a higher degree of cure than the coating thatfailed. Perhaps more importantly, these materials were char-acterized directly on the container substrate, indicating theTMA’s value in situations not amenable to characterizationusing more routine analytical methods. Coatings Characterization by TMA Sample Preparation: Sample preparation requirementsvary depending on the test mode, usually either force/deflection (penetration) or dilatometric experiments. Eitherfree films or coated substrates can give excellent results. While free films are probably best-provided that they lay flatand retain their shape during the experiment-it's usuallymore practical to run TMA experiments with coated sub-strates. If you use a coated substrate, pay close attention tosample thickness, the dimensional stability of the substrateduring the experiment,and the size of the sample in relationto the probe tip. The larger the sample in relation to the probetip, the better. Substrates, like the coating, can change with experimentalconditions and consequently influence experimental resultsthat an experimenter might attribute to coating propertiesalone. The best way to avoid substrate effects is to increasethe thickness of the sample. Ideally, samples should be about500 um (20 mils) thick, but films this thick are rarely found inany application. Moreover, increasing the thickness of thesample may improve resolution at the expense of validity. Inpractice, films measuring 20 um (about 1 mil) will yieldexcellent quantitative results. In general, if you can make thesample thicker without compromising the validity of theresults, you should. The need for thick samples doesn’t meanthat thin samples may not be tested. In fact, significant quali-tative results can be obtained at film thicknesses as small as5 um provided that the sample preparation conditions areextremely well controlled. If you have doubts about potential substrate effects, ana-lyze the uncoated substrate and try to determine if the sub-strate will contribute to changes in the TMA’s response. Somesoftware packages will allow you to subtract baseline effectsfrom the total response of the coated substrate. As with theDMA, ensure uniform thermal histories by preparing speci-mens in a controlled environment. around 5C. The primary consideration in selecting a heatingrate are potential problems with thermal lag in the sample.Temperature gradients within the sample can broaden transi-tion regions and force them to occur at artificially high tem-peratures. In contrast, slow heating rates allow the entiresample to equilibrate to temperature change, which, in turn,improves the accuracy of transition temperature assign-ments. ments because dilatometric experiments require that theprobe be brought into very light contact with the sample. Inpenetration experiments, applying very low forces may notprovide adequate change in the sample to accurately monitorsubtle transitions during an experiment; conversely, largeforces may actually damage the sample during an experi-ment. In instruments that use weights, the applied forceshould be between 5 and 20 g. In servomotor-controlledTMAs, use 0.05 to 0.2 N forces for probe tips with a 0.4-mmradius. vide a stable test environment and ensure uniform heat trans-fer to the sample. Use the manufacturer’s recommendedpurge rates for all experiments. TABLE 5-TMA softening point temperatures (℃) and probe displacementvalues (um). Production Probe Rebake Probe Material SPT Displacement SPT Displacement Passed 100 1.1 104 0.3 Failed 91 4.8 99 0.9 Special Applications::Many of the newest commercialTMA’s are quite versatile instruments and come with specialattachments for performing unique experiments. For exam-ple, most TMAs come with clamps for tensile testing-goodfor measuring everything from tensile modulus to shrinkagewith age or cure. These techniques almost always requirespecial preparation and operating conditions. Work closelywith the supplier when designing these experiments, or,bet-ter still, ask the manufacturer for a contact familiar with thetechnique. DIELECTRIC ANALYSIS Dielectric thermal analysis (DEA) is a convenient nonde-structive test that relates fundamental molecular motions to avariety of polymeric properties. Applications in coatings sci-ence include the characterization of new materials and pro-cesses, cure studies, film formation studies, formulationsoptimization, applications development, performance pre-diction, competitive product evaluation, and QC/QA appli-cations. General descriptions of dielectric properties can befound in a variety of papers [27,39-41]. Because engineering limitations prohibit the characteriza-tion of the complete continuum of dielectric properties, thereare a number of commercial dielectric analyzers available,each offering advantages in their potential range of applica-tions. The operating principle of all of these instruments,however, is the same: a polymeric system is polarized in anelectrical field and the time, temperature, and frequency-dependent dielectric relaxations monitored. Commerciallyavailable instruments may be divided into two broad catego-ries: those polarizing samples with an alternating current (ac)and those using a direct current (dc). Each instrument mayalso have one or more sensors or analytical configurations;these include remote single-surface, ceramic-single-surfaceor parallel plate geometries. All dielectric analyzers measure two fundamental electrica]characteristics of a material-capacitance and conductance.Capacitance measures a material’s ability to store electricalcharge, and conductivity measures its ability to transfer elec-tric charge. These components are used to determine geome.try-independent values for the material's permittivity (e') andloss factor (e"), serving as molecular probes that correlatewith the changing chemical and physical states of the mate-rial. Permittivity corresponds to the alignment of dipoles inthe electrical field; permittivity values are relatively low attemperatures below Tg or in highly cross-linked polymersand relatively high above the Tg. The loss factor correspondsto the amount of energy required to align dipoles and moveions in the electrical field. The latter term is frequently used inmonitoring rheological changes during processing or formonitoring the progress of a cure reaction.More completedescriptions of the use of dielectric analysis in thermal analy-sis [9], film formation [42], and thermoset cross-linking[43-45] can be found elsewhere. Thermally stimulated current (TSC) represents a relativelynew approach where dipole moments are polarized in a d-cfield at temperatures above the sample's main transition tem-peratures [46]. Following polarization, the sample is quenchcooled to a low temperature, and then scanned at a constantheating rate through the polarization temperature. As the sample depolarizes, the charge stored in the polarizationprocess is then measured as a function of time. Current peaksobtained this way correlate well with transition temperaturesobtained by mechanical relaxation, DSC, or by a-c dielectricspectroscopy. Another d-c technique—relaxation map analysis (RMA)-is closely allied to TSC and represents a sophisticated exten-sion of TSC experiments. According to theory, this procedureisolates the individual relaxation modes that constitute atypical TSC by varying the polarization temperature andmonitoring the depolarization current over small (less than5℃) temperature “windows." In this way, individual relaxa-tion modes can be isolated from the entire spectrum of modesthat make up a typical TSC curve. An Arrhenius plot of theindividual relaxation times forms a relaxation map for a ma-terial. Coatings characterization using TSC and RMA is de-scribed in more detail elsewhere [47,48]. Although the dielectric techniques date back to the early1900s, the lack of high-quality equipment and the attendantexperimental difficulties limited the value of DEA for coat-ings characterization and in materials science generally. Ad-vances in engineering design have dramatically improved theutility of commercial DEAs and rekindled interest in thetechnique. DEA now promises to play an important role incoatings characterization. The two examples describedhere-powder coating cure and resin characterization-underscore the value of DEA for coatings characterization.Ceramic single-surface sensors were used in both of the stud-ies. Powder Coatings-Changes in the complex permittivity e*of unpigmented powder coatings were correlated with themelt transition (about 60℃) and the onset of cross-linking(about 100℃) in these powders. Dielectric measurements,particularly transition temperatures and relative intensities,correlated very well with DSC results. Five powders, eachformulated at different cross-linker levels, were scanned during and after cure. Figure 11 illustrates a typical DEA plotcombined with results from the DSC. As the results showmajor transitional features in these two sets of data corre-spond closely. One significant deviation occurs in the regionbetween roughly 65 and 80℃ where e* exhibits a dramaticincrease at all frequencies; there is virtually no DSC responseover the same temperature range. The increase in e* probablycoincides with increasing molecular mobility as the poly-mer’s volume increases above the melt. Dielectric propertiesshould change rapidly over this temperature range whilechanges in enthalpy (and therefore DSC heat flow measure-ments) should be minimal. Resin Properties-A comparison of the dielectric propertiesof an appliance powder coating formulated with polyesterfrom two different manufacturers reveals distinct differ-ences. Figure 12 reveals differences in the breadth of the melttransition and the cure onset temperature. Although the per-formance properties of the resins were indistinguishable, theDEA results clearly indicate the technique’s sensitivity to rela-tively small differences in materials that were virtually identi-cal by all other measures. Film Formation-The complexity of the film formationprocess in coatings, particularly latex coalescence, makes this Temperature (C°) FIG. 11-DEA and DSC results for powder coating cure. a difficult subject to characterize and understand. Improve-ments found in newly available dielectric analyzers indicatethat DEA will offer, at the very least, a significant step for-ward in our ability to follow film formation. Figure 13 followsthe change in the dielectric constant (complex permittivity)in two latexes, one catalyzed and the other uncatalyzed, afterthey were applied to a DEA sensor. By comparing the changesin log e* with the observations from optical microscopy, DSCand TGA (results not included here), some inferences aboutthe nature of the film formation process were made. In thecatalyzed sample, the drop in e* over the first 20 min of theexperiment correlates to the loss of free water. Betweenroughly 20 and 30 min, the latex particles begin to deformand pack tightly together. Finally, over the next hour or so,there is a loss of ionic mobility that probably coincides withpolymer interdiffusion at the particle-particle interface. Thecatalyzed latex had formed a clear, uniform film by the end ofthe experiment. The dielectric behavior of the uncatalyzed film was fardifferent. While changes in permittivity associated with waterloss and particle packing were evident, the lengthy periodthought to correlate with interdiffusion was missing. In fact,this latex was a poor film former, leaving an opaque, severelycracked film on the surface of the sensor. Coatings Characterization by DEA Sample Preparation: This depends very much on the typeof sensor used. Parallel plate sensors are typically used for free films, while film formation studies would typically em-ploy single-surface sensors. As with other approaches,freefilms should be made in well-controlled environments andmust meet the minimum film thickness specifications of themanufacturer. Whenever possible, though, the sample thick-ness should closely approximate the thickness of the coatingafter application. As noted earlier, free films can be made bycoating low-energy surfaces like PTFE or polypropylene orcoating thin aluminum sheet stock and dissolving the alumi-num (after the film has formed, of course) with an alkali. Single surface sensors can be used for any material, butthey are especially useful for studying liquids or materialsthat require a gas/polymer interface for proper analysis. Ap-plying liquids, for example in film formation studies, oftenrequires special preparation to ensure that the electrode sur-face is completely and evenly covered. For example, whenstudying low-viscosity liquids, we first calibrate the sensor,then build a low silicone polymer border at the edge of theelectrode to keep the sample in place. The volume of liquidapplied should leave a final film roughly twice as thick as thedistance between electrodes when the sensor uses in-terdigitated comb electrodes. Always use analytical pipettesto ensure that the applied volume is uniform from experi-ment to experiment. While absolute measurements of dielec-tric properties may be in doubt using this approach, it is avalid way to make relative comparisons provided that eachmaterial is prepared and handled in exactly the same way. Frequency Selection:In general, there are two compo-nents of the dielectric response to an applied electrical field:dipole polarization and free charge migration. The former ismost frequently associated with high frequencies (100 kHz or Temperature (C°)FIG. 12-A comparison of the dielectric properties in identically formulated resins from two manufac-turers. more) while the latter is associated with lower frequencies.Because the dielectric response of polymers varies widely inpolymers (and sometimes within classes of polymers), thereare no specific rules governing the selection of a test fre-quency. As a general rule, apply as broad a range of frequen-cies as your equipment will allow early in the experimentalprocess. After the kinds of responses for given material arebetter understood, use more limited frequency ranges in sub-sequent experiments. Heating Rate:This is an extremely important factor thatdepends inherently on the frequencies selected for an experi-ment. Our heating rates are chosen to ensure that we haveapproximately one data point for each ℃ increment at eachfrequency. Low frequencies (<0.1 Hz) require slow heatingrates so that the sample has reequilibrated after imposing thea-c electrical field. For example, if we choose to test at fre-quencies ranging from 0.1 Hz to 100 kHz in order ofmagni-tude increments in our equipment, then a complete cycle (sixfrequencies) takes about 1.1 min. Based on this cycle time, wewould choose a 1℃/min heating rate. Cycle times are muchfaster at higher frequencies, usually less than 0.2 min, socorrespondingly higher heating rates may be used. In isother-mal studies we usually collect about 6 to 12 data points perapplied frequency for each minute of the experiment depend-ing on the length of the experiment. Gas Flows:Where possible, apply a uniform gas flow. Aswith the DMA, we set our gas flow rates so that the ovenchamber"turns over"about once every 1 to 2 min. Since thesize of the oven chambers in various instruments varies con- siderably, flow rate requirements will as well. If in doubt, usethe manufacturer’s recommended purge rates. Most DEAs are also excellent instruments for running con-trolled atmosphere experiments. For example, controlled hu-midity experiments (to 80%RH) require bubbling the purgegas through water (or a salt solution of known humidity)before entering the instrument chamber. THERMOSET CURE STUDIES The interrelationship between the network formation pro-cess and performance properties make cure process studiescritically important in product development. A thermosetcoating's performance properties depend inherently on cureconditions. Important characteristics of the cross-linking re-action include the gel point, Tg, and the kinetics of the cross-linking reaction. These properties establish a quantifiablelink between the cure reaction and the development of ther-moset properties. In essence, they provide a way to“picture"the cure process and a tool for optimizing materials handling,processing, and cure. Characterizing cure behavior also helps to distinguish be-tween complete cure and optimum cure, an important dis-tinction in thermoset applications. Completely cured thermo-sets are "ideal systems"where the cross-linking reaction hasreached 100% conversion and properties are constant forpractical purposes. Optimally cured thermosets are"non-ideal" systems where the cross-linking reaction is incompleteand satisfactory performance properties rather than 100% File: C: SIDEA.03 Operator: Neag FIG. 13-Changes in complex permittivity during latex film formation chemical conversion mark the end of the cure process. Inpractice, coatings can usually be categorized as nonidealthermosets. DSC Cure Studies-DSC cure studies have been particu-larly beneficial in optimizing cure schedules for gel coats-polyester/styrene thermoset coatings used in marine and san-itary applications. The initiation of the cure reaction in gelcoats begins with the decomposition of a peroxide and thesubsequent copolymerization of styrene with unsaturatedgroups in the polyester resin backbone [49]. When fullycured, these systems are highly cross-linked. Elementary ki-netics analysis [50] indicates that the reaction order shouldbe 1.5, first order in monomer and half order in initiator. Evaluation of the kinetics of the gel coat cross-linkingreaction using DSC and FT-IR agreed remarkably well. The. data in Table 6 also show that the order of reaction obtainedby both DSC and FT-IR almost match the value of 1.5 ob-tained using a theoretical kinetics approach. TABLE 6-Kinetics parameters for the cure of gel coat resins. E, kJ/mole ln A, s DSC 1.56 105.0 28.4 FT-IR 1.54 107.6 29.2 DSC studies revealed that the onset of the gel coat cureprocess corresponds to the decomposition of the peroxideinitiator; according to these results, the reaction began atabout 75℃ and ended just prior to 150℃. The temperaturerange (72 to 148℃) selected for the kinetics evaluation usingDSC was based on FT-IR spectra. These results showed thatthe reaction of styrene, and presumably its reaction with thepolyester, began and ended at similar temperatures in theDSC and FT-IR. FT-IR reaction kinetics were based on thedisappearance ofthe styrene vinyl group (779 cm-). Whileboth methods produced excellent results, the DSC resultswere obtained in a single temperature sweep, while the FT-IRresults required significantly more experimental effort to pro-duce and analyze. Results for gel coat cure by DSC, FT-IR,and also DMA are covered in detail elsewhere [51,52]. DMA Cure Studies-As a thermoset cures and the numberof cross-links increases, a coating's modulus, or resistance todeformation, also increases. In dynamic mechanical analysis,a rise in resonant frequency or relative modulus parallels thedevelopment of properties during network formation. Thecharacteristic rise in relative modulus-particularly its rateand intensity-reveals much about the cross-linking process.The curves in Fig. 14 illustrate how a coating's relative modu-lus (or stiffness) and damping (energy dissipation) changeduring cross-linking or film coalescence. Throughout the FIG. 14-Generalized dynamic mechanical cure response. glass transition region-between roughly -80 and 20℃-the relative modulus of the sample decreases until it reachesa minimum. Between 50 and 180℃, the coating is really alow-viscosity liquid that has little measureable dynamic me-chanical response. The only measurable mechanical re-sponse in this region is due to the substrate used in the experi-ment. As the temperature increases, cross-linking (or filmcoalescence) begins and the relative modulus begins to rise.When the reaction is complete, about 220℃ in this example,the development of mechanical properties reaches a plateau.Cure studies by DMA can also help explain the interrela-tionship between cross-linker characteristics and the cureprocess. Figure 15 shows the change in the rate and degree ofcure in relation to the reactive groups on melamine cross-linkers. As the imino (NH) concentration increases, therate and degree of cure both increase. At low imino levels, therate and degree of cure are low; beyond about 15%-NH, therate of cure changes significantly, while the DOC appears toreach an asymptotic limit. INDUSTRIAL WATERBORNE SYSTEM FIG. 15-The relationship effects of cross-linker characteris-tics on the rate and degree of cure of a waterborne coating. When the experimental objective is to make a quick com-parison of the effects of formulation variables like cross-linker levels or catalyst levels, simple cure curves like theseoffer an excellent way to make qualitative judgments aboutthe cure process. Sometimes, however, customers may de-mand more than simple"faster/slower”or “more/less” com-parisons. For example, a customer may want to know howlong the film formation process will take under a variety ofcure conditions different, often substantially different, fromthose used in past experiments. In cases like these, models ofthe film formation process are a valuable tool for predictingthe time required to complete the film formation process. Thevirtue of modeling lies in its ability to provide a well of infor-mation from a relatively small database or, in this case, a fewfilm formation experiments. The time-temperature superposition (TTS)i) approach,while somewhat more demanding experimentally, is a farmore versatile method for characterizing the cure processthan individual cure scans. This approach uses a series ofisothermal cure curves (usually four) to determine the activa-tion energy for the cross-linking process. Once the activationenergy is known, an Arrhenius model is used to predict rela-tive rates of cure at different isothermal cure temperatures.The curves shown in Fig. 16 illustrate portions of the storagemodulus curves typically used in TTS cure studies. Thesecurves were obtained for an epoxy-polyester powder cured atfour isothermal temperatures. The characteristic form ofthese "cure"curves discloses several important aspects of thecross-linking process, such as the time to gelation, the rapidincrease in relative modulus during cure, and a plateau re-gion that marks the end of the cross-linking process. From a processing perspective, the onset of the rise inmodulus about 3 min into the “bake"scan represents themost important feature of the curve. The onset of the rise infrequency in these curves approximates the time to gelation,or the point where the polymer transforms from a viscousliquid to an elastic gel; this point marks the processing limitof the thermoset. Beyond this point, cross-link density in-creases, approaching a plateau which marks the end of thecross-linking process. In Fig. 16, these powder coatings fail toreach this plateau, even at the highest cure temperaturesand/or longest cure times. The continued rise in relative mod-ulus indicates incomplete network formation, even after 100min at temperatures as high as 210℃. Longer cure times orhigher cure temperatures would eventually establish the end-point of the cure process. The modest increase in relativemodulus at later cure times may be related to annealingeffects or some combination of cure and annealing. Gener-ally, thermosets cured to the plateau will possess less damp-ing, have higher Tg’s, and are more brittle than thermosetscured to a point below the plateau. Degree of cure curves for powder coatings were obtainedfrom DMA data by measuring the increase in relative modu-lus (measured as a frequency increase here) occurring ascross-linking proceeds. The DMA degree of cure was calcu-lated from Eq 1 below. This equation allows the estimation ofthe relative degree of cure between the gel point (0% DMADOC) and the fully cured thermoset (100% DMA DOC). Intheseexperiments, the gel point is defined by the initial rise inthe modulus curves. This point in the modulus curve marksthe formation of an intractable gel. Full cure is defined by the DMAEPOXY-POLYESTER POWDER COATING FIG. 16-Dynamic mechanical cure response of an epoxy polyester powder coating at fourisothermal temperatures. plateau region of the modulus curve occurring just after thesharp rise in modulus. DMA DOC is defined as: where Hz(t,T) is the frequency measured during cure at time tand isothermal temperature T; Hzmin is the minimumpregelation frequency (roughly equivalent to the resonantfrequency of uncoated stainless steel mesh) and Hz (o,T) isthe frequency of a fully cured coating at temperature T afterreaching complete cure. The DMA degree of cure curves shown in Fig. 17A revealsthat the rate and degree of "mechanical cure" vary dramati-cally with the cure temperature. These differences carry im-portant kinetic information about the cure process, informa-tion that forms the basis for generating mathematical modelsof the cure process. By applying a time-temperature superpo-sition method developed by Prime [53], the data from theisothermal cure curves at several different isothermal tem-peratures can be shifted to form DMA degree of cure mas-tercurves. Based on the shift factor required to superimpose the dataof Fig. 17A, the activation energy for the epoxy-polyester curereaction in this example was estimated at 77.4 kJ/mol. As theDMA mastercurve in Fig. 17B shows, the superposition ofdata to times at 191℃ is very good. The key advantage inapplying reaction kinetics analysis in dynamic mechanicalanalysis (and other applicable techniques) is efficiency: a fewexperiments can provide as much information about the curebehavior as far more extensive laboratory work under many different baking conditions. For example, in Fig. 18, simu-lated DMA degree of cure curves were generated at three baketemperatures and compared with the DOC at minimum im-pact resistance. The time required to reach a minimum per-formance level varies considerably; at 150℃, the coating failsto reach the minimum DOC even after 90 min. At 177 and204C, minimum DOC is reached after roughly 15 and 30min, respectively. Obtaining the same information by a con-ventional experimental approach would require a consider-able amount of time and effort in the laboratory. Moreover,techniques like the DMA TTS methods described here canpredict the time required to reach a specified level of perform-ance for any isothermal cure schedule. COMBINED TECHNIQUES IN PROBLEMSOLVING Thermal techniques usually reserved for routine analysisand characterization or research support are also useful forsolving problems that arise in process or production. Becauseproblems in manufacturing present unusual experimentaldifficulties, solving them usually requires several methods foradequate characterization. A solitary piece of evidence, what-ever the quality, usually needs corroborating informationfrom other sources. Multiple techniques are particularly valu-able in settling financial or legal claims where the need forundisputable evidence becomes preeminent. In the exampledescribed below [54], quality control tests in manufacturingindicated that container coatings sprayed on the interior ofaluminum beverage cans were improperly cured, the cus- DMA ISOTHERMAL CURE CURVESEPOXY-POLYESTER POWDER COATING ·210c 191°℃ 163C -150℃ FIG. 17A-Epoxy polyester powder coating degree of cure curves. DMA MASTERCURE CURVEEPOXY-POLYESTER POWDER COATING E=18.5 kcal/mole 191°c ·163°C ·210°C ·150°c TIME (min) AT 191°c FIG. 17B-Epoxy polyester powder coating DMA mastercurves for cure at 191℃and an activation energy of 18.5 kcal/mol. tomer attributing the cure problem to errors in the synthesisor formulation of the coating. Four analytical techniques were required to adequatelycharacterize various coating materials and pinpoint thecause of the problem. Compositional differences were as-sessed by FT-IR; morphological characteristics were ob- served with scanning electron microscopy (SEM); DSC wasused to assess differences in thermal behavior; and relativecure kinetics were measured using DMA. Each of the analysesrevealed that differences between the problem coatings andother materials-either laboratory standard or productionline standards-were not due to differences inherent in the EPOXY-POLYESTER POWDER COATING FIG. 18-Predicted time to minimum acceptable impact resistance at three isother-mal bake temperatures. chemistry of the coatings or formulation. Instead, these testsrevealed that oven temperatures were probably too low toproperly cure the coatings. After raising the oven tempera-ture a few degrees, all of the coatings passed the QC test.Figure 19 compares the DSC heat flow characteristics of a properly cured standard with curves of the problem coatingbefore and after rebake. The key feature shown in this figureis a weak endotherm, apparently related to the level of cure inthe problem coating. After rebake, this endotherm disappearsand the thermal behavior of the problem coating is virtually FIG. 19-Comparison of the DSC heat flow characteristics of a production standard, aproblem coating, and the rebaked problem coating (Aq = heat flow). identical with that of the properly cured coating. Similarcomparisons using FT-IR to follow changes in reactive sitesduring cure showed that the “good”and"bad"coatings werevirtually indistinguishable (provided that their thermal his-tories were the same). In fact, the results obtained from eachof the instruments led to the same conclusion: when theproblem coating was rebaked, it was virtually identical to theproperly cured material. Taken together then, these resultsshowed that the manufacturing problem was unrelated to thecoating's chemistry. Instead, QC failures were caused by oventemperatures set too low to properly cure the coating. SUMMARY Thermal analysis occupies a unique place in research anddevelopment. In most instances, the utility of an analyticaltechnique is strictly limited by its output. For example, spec-troscopic tools like NMR or IR tend to be viewed as stand-alone operations that provide a specified result. TA differsfrom other analytical operations because the instrumentsoffer greater versatility. In fact, thermal analysis is generallyrecognized as a broad technology encompassing many in-struments and many more applications. Depending on theneed, the results delivered by TA can range from the straight-forward, like Tg’s, to the complex, like reaction kinetics pa-rameters. TA realizes its greatest value, however, when more thanone instrument is focused on a research or production prob-lem. In combination, these instruments can provide tremen-dous insight into the relationship between formulation, pro-cessing, and the ultimate performance of material, oftenclarifying hard-to-understand relationships [55]. When ap-plied throughout the product development cycle, these in-struments can reduce product development time, manufac-turing costs, and, in the end, help shape the best possibleproduct. Acknowledgment Thanks are due to the many coworkers at Glidden for theircontributions to the work described in this paper. The authoris particularly indebted to Leo Tischer, Tony Parker, MaryLogue, Tammy Chalmers, Sharon Chang, and Patti Wilsonfor their diligence in obtaining much of the experimental datadescribed here and also to Richard Holsworth for histhoughtful contributions to experimental design and theanalysis of the results over many years. In addition, MarkKoehler, Ted Provder, Ted Niemann, and Ann Kah deserverecognition for their pioneering efforts in the automation ofthe DSC and DMA. Without the time savings acquired in dataacquisition and analysis made possible through their efforts,much of this work would have been a practical impossibility.Thanks also to Ann for redrawing many of the figures used insupport of the text. Finally, I’m indebted to Dr. StephenCheng (University of Akron), Dr. Richard Chartoff (Univer-sity of Dayton), Dr. David Kranbuehl (William & Mary), Dr.Don Burlett (Goodyear), Dr. Charles Earnest (Berry College),and Dr. Peter Kamarchik (PPG Industries) for their valuablecomments and insights on instrument operation and experi-mental detail. ( REFERENCES ) ( [1] Van K revlan, D. W., Properties o f Polymers, 3 r d ed., E lsevier,New York, 1990, p. 49. ) ( [2] Wendlandt, W .W., Th e rmal Analysis, P. J. E l ving and J. D. Winefordner, Eds., J ohn Wiley & Sons, New York, 1986. ) [3] Compositional Analysis by Thermogravimetry, STP 997, C. M.Earnest, Ed., American Society for Testing and Materials, Phila-delphia, 1988. [4]“Computer Applications in the Polymer Laboratory,"T. Provder,Ed., ACS Symposium Series 313, American Chemical Society,Washington, DC, 1985. ( [5]"Computer Ap plications i n A p plied P o l ymer Science,” T.Provder, Ed., ACS Symposium Series 404, American Chemical Society, Washington, D C, 1 988. ) [6] Holsworth, R. M., Journal of Paint Technology, Vol. 41, 1969, p.167. [7] Wunderlich, B., Thermal Analysis, Academic Press, New York,1990. [8] Thermal Characterization of Polymeric Materials, 1st ed., E. A.Turi, Ed., Academic Press, New York, 1981. [9] Thermal Characterization of Polymeric Materials, 2nd ed., E. A.Turi, Ed., Academic Press, New York, in press. [10] Fox, T. G., Bulletin of the American Physics Society, Vol. 1, 1956,p. 123. [11] Johnston, N. W., Journal of Macromolecular Science-ReviousMacromolecular Chemistry, Vol. C14, No. 2, 1976, pp.215-250. [12] Cowie,J. M. G. and Toporowski, P. M., European Polymer Jour-nal, Vol. 4, 1968, p.621. [13] Acitelli, M. A., Prime, R. B., and Sacher, E., Polymer, Vol. 12,1971, p. 335. [14] Widmann, G., Thermochimica Acta, Vol. 11, 1975, p. 331. [15] Sourour, S. and Kamal, M. R., Thermochimica Acta, Vol. 14,1976, p. 41. [16] Borchardt, H. J. and Daniels, F.,Journal of the American Chemi-cal Society, Vol. 79, 1957, p. 41. ( [17] Fava, R . A., Polymer, Vol. 9, 1968, p. 137. ) [18] Kissenger, H. E., Analytic Chemistry, Vol. 29, 1957, p.1702. [19] Ozawa, T., Journal Thermal Analysis, Vol. 2, 1970, p. 301. [20] Bamford, C. H. and Tipper, C. F. H., Comprehensive ChemicalKinetics, Vol. 22, Elsevier, New York, 1980. [21] Benoit, P. M. D., Ferrillo, R. G., and Granzow, J., Journal ofThermal Analysis, Vol. 30, 1985, p. 869. [22] Provder, T., Holsworth, R. M., Grentzer, T., and Kline, S. A.,"Polymer Characterization: Spectroscopic, Chromatographicand Physical Instrumental Methods," C. Craver, Ed., “ACS Ad-vances in Chemistry,"No. 203, American Chemical Society,Washington, DC, 1983, p.234. [23] Neag, C. M., Provder, T., and Holsworth, R. M., Journal ofTher-mal Analysis, Vol. 32, 1987, p.1833. [24] Nielsen, L. E., Mechanical Properties of Polymers, 2nd ed., Dek-ker, New York, 1974. ( [25] Nielsen, L . E., Mechanical Properties ofPolymers, 2nd ed., Dek- ker, New York, 1 974. ) [26]Ward, I. M., Mechanical Properties of Solid Polymers, 2nd ed.,Wiley, New York, 1983. [27] McCrum, N. G., Read, B. E., and Williams, G., Anelastic andDielectric Effects in Polymeric Solids, John Wiley & Sons, Lon-don, 1967. [28] Ferry, J. D., Viscoelastic Properties of Polymers, 2nd ed., Wiley,New York, 1980. ( [29] Chartoff, R. P., Weissman, P. T., and Sircar, A. K. in Assignmentof the Glass T ransition, STP 1249, R . J. Seyler, E d ., ASTM, Philadelphia, 1994, p. 88. ) [30] Williams, M. L., Landel, R. F., and Ferry, J. D. in Journal of theAmerican Chemical Society, Vol. 77, 1955, p. 3701. [31] Hill, L. W. in Journal of Coatings Technology, Vol.64,1992, p.28. ( [32] Provder, T . in Journal of Coatings Technology, V o l. 61,No . 808, 1989, p . 33. ) ( [33] Neag, C. M. and Prime, R. B. in Journal of Coatings Technology,Vol.63, N o.7 9 7, 1 9 91, pp. 37-45. ) ( [35] D aniels, T. i n Analytical Proceedings (London), Vol . 18, 198 1 , p.421 . ) ( [36] Materials Characterization by Thermomechanical Analysis, ST P 1136, A. Riga and C. M . Neag, Eds., American So c iety for Test-ing and Materials, Philadelphia, 1 991. ) ( [37] Earnest, C. M.,"Assignment of the Glass Transition Using Ther-mal M echanical M e thods," Assignment of the Glass Transition,ASTM STP 12 4 9, Am e rican Society for Te s ting and Ma t erials, P hiladelphia, 1 994, p. 75. ) ( [38] Skrovanek, D. J. and Schoff, C. K.,"Thermal Mechanical Analy-sis of Organic Coatings," P r ogress i n O r ganic Coatings, Vo l . 16 , 1988, Elsevier Sequoia, pp. 135-163. ) ( [39] Hedvig, P . , Dielectric Spectroscopy of Polymers , Adam H ilger, Bristol, 1977. ) ( [40] Williams, G. in Materials Science and Technology, R. W. Cahn, P. Hassen, a nd E . G . K ramer, Eds., Vol. 1 2, E. L. Thomas, 1993,Chapter 11 , p. 471. ) ( [41] McGhie, A. R . in E lectrochemical S cience o f Polymers, V ol. 2 , R . G . L inford, Ed., E lsevier, London, 1 9 87, p . 222. ) ( [42] H ill,R. M., Dissado, L. A., and Strivens, T. A., Proceedings, 15 t h International Conference in O rganic Coatings S c ience a n dTechnology, Technomic P u blishing, 1989, p . 1 43. ) ( [43]Kenny, J. M . and Nicolais, L., Polymer News, Vol. 18, 1 993, pp. 230-236. ) ( [44] Sheppard Jr., N . F . a nd Senturia, S. D., Advances in PolymerScience, V ol. 80, 1 9 86, p. 1. ) [45] Kranbuehl, D. E., Delos, S. E., and Jue, P. K., Polymer, Vol. 27,1986, p. 11. ( [46] B ernes, A., L acabanne, C. et al. in Order in the Amorphous State of Polymers, S. E. Keinath, Ed., Plenum Press, N ew Y o rk, 1 9 87, pp. 305-306. ) [47] Neag, C. M., Ibar, J. P., and Denning, P., Journal Coatings Tech-nology, Vol. 65, No. 826, pp. 37-42. [48] Kumins, C. A., Knauss, C. J., and Ruch, R. J.,Journal of Coat-ings Technology, Vol. 66, No. 835, pp. 79-84. [49] Saunders,K. J.,Organic Polymer Chemistry, Chapman and Hall,Ltd., London, 1973, Chapter 10. [50] Odian, G., Principles of Polymerization, McGraw Hill,New York,1970, pp. 172-178. [51] Provder, T., Neag, C. M., Carlson, G. M., Kuo, C., andHolsworth,R. M.,Analytical Calorimetry, Vol.5, P. S. Gill and R.Johnson, Eds., Plenum Press, New York, 1984, p. 377. ( [52] Neag, C . M ., Carlson, G . M . , Provder, T., Ku o , C., an d Ele y , R. R., ACS P reprints, Polymer Materials Science and Engineering,Vol. 49, 1983, p. 404. ) [53] Prime, R. B., Proceedings, 14th NATAS Conference, Al Printing,New Jersey, 1985, p. 137. [54] Neag, C. M. and Holsworth, R. M., American Laboratory, Janu-ary 1986, pp. 48-54. ( [55] Chiu, J. in"Applied P olymer Analysis and Characterization,"J.Mitchell, Jr., Ed., Hanser, New York, 1 9 87. ) ( [56] For Better Thermal Analysis, J . Hill, E d., 3rd e d., ISTAC, 1 9 91. ) Authorized reprint from ASTM Manual Copyright marian eaniatu for ToctAmerican Society for Testing and MaterialsBarr Harbor Drive, West Conshocken, PA A- The simple yet highly sophisticatd character of these instruments has a major drawback: their simplicity significantly increases the potential foor misinterpreting experimental results.
确定


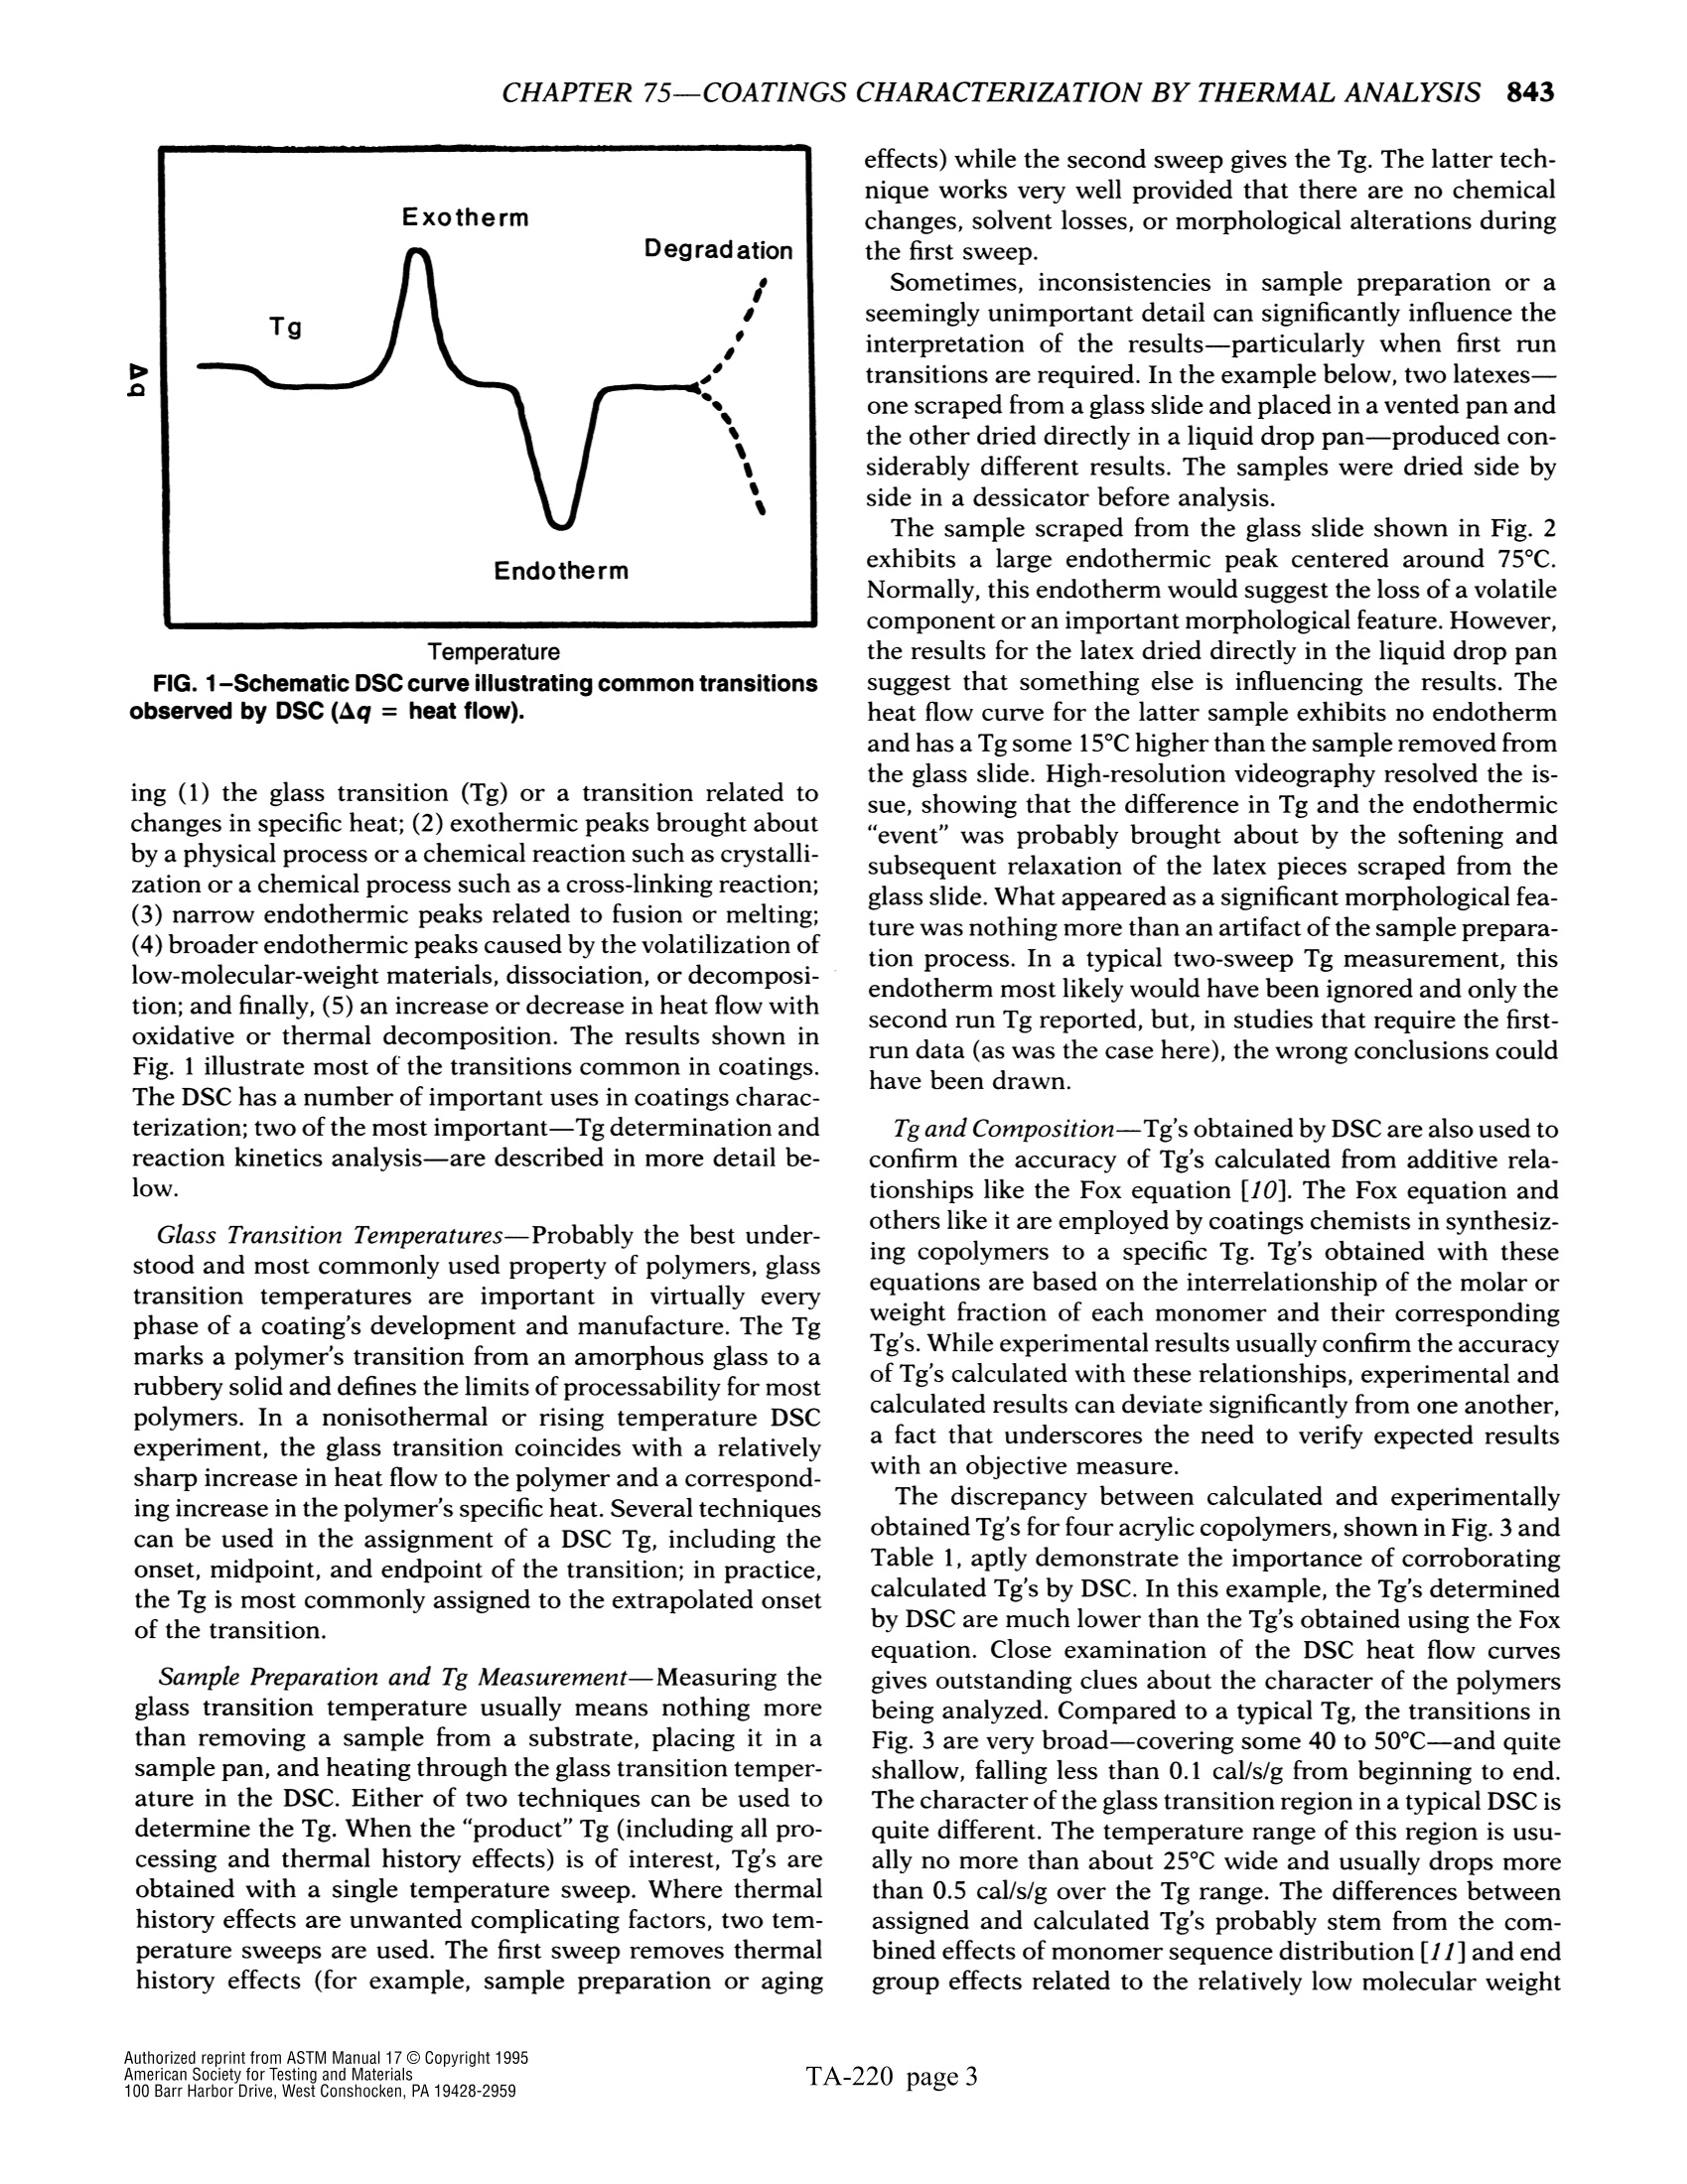

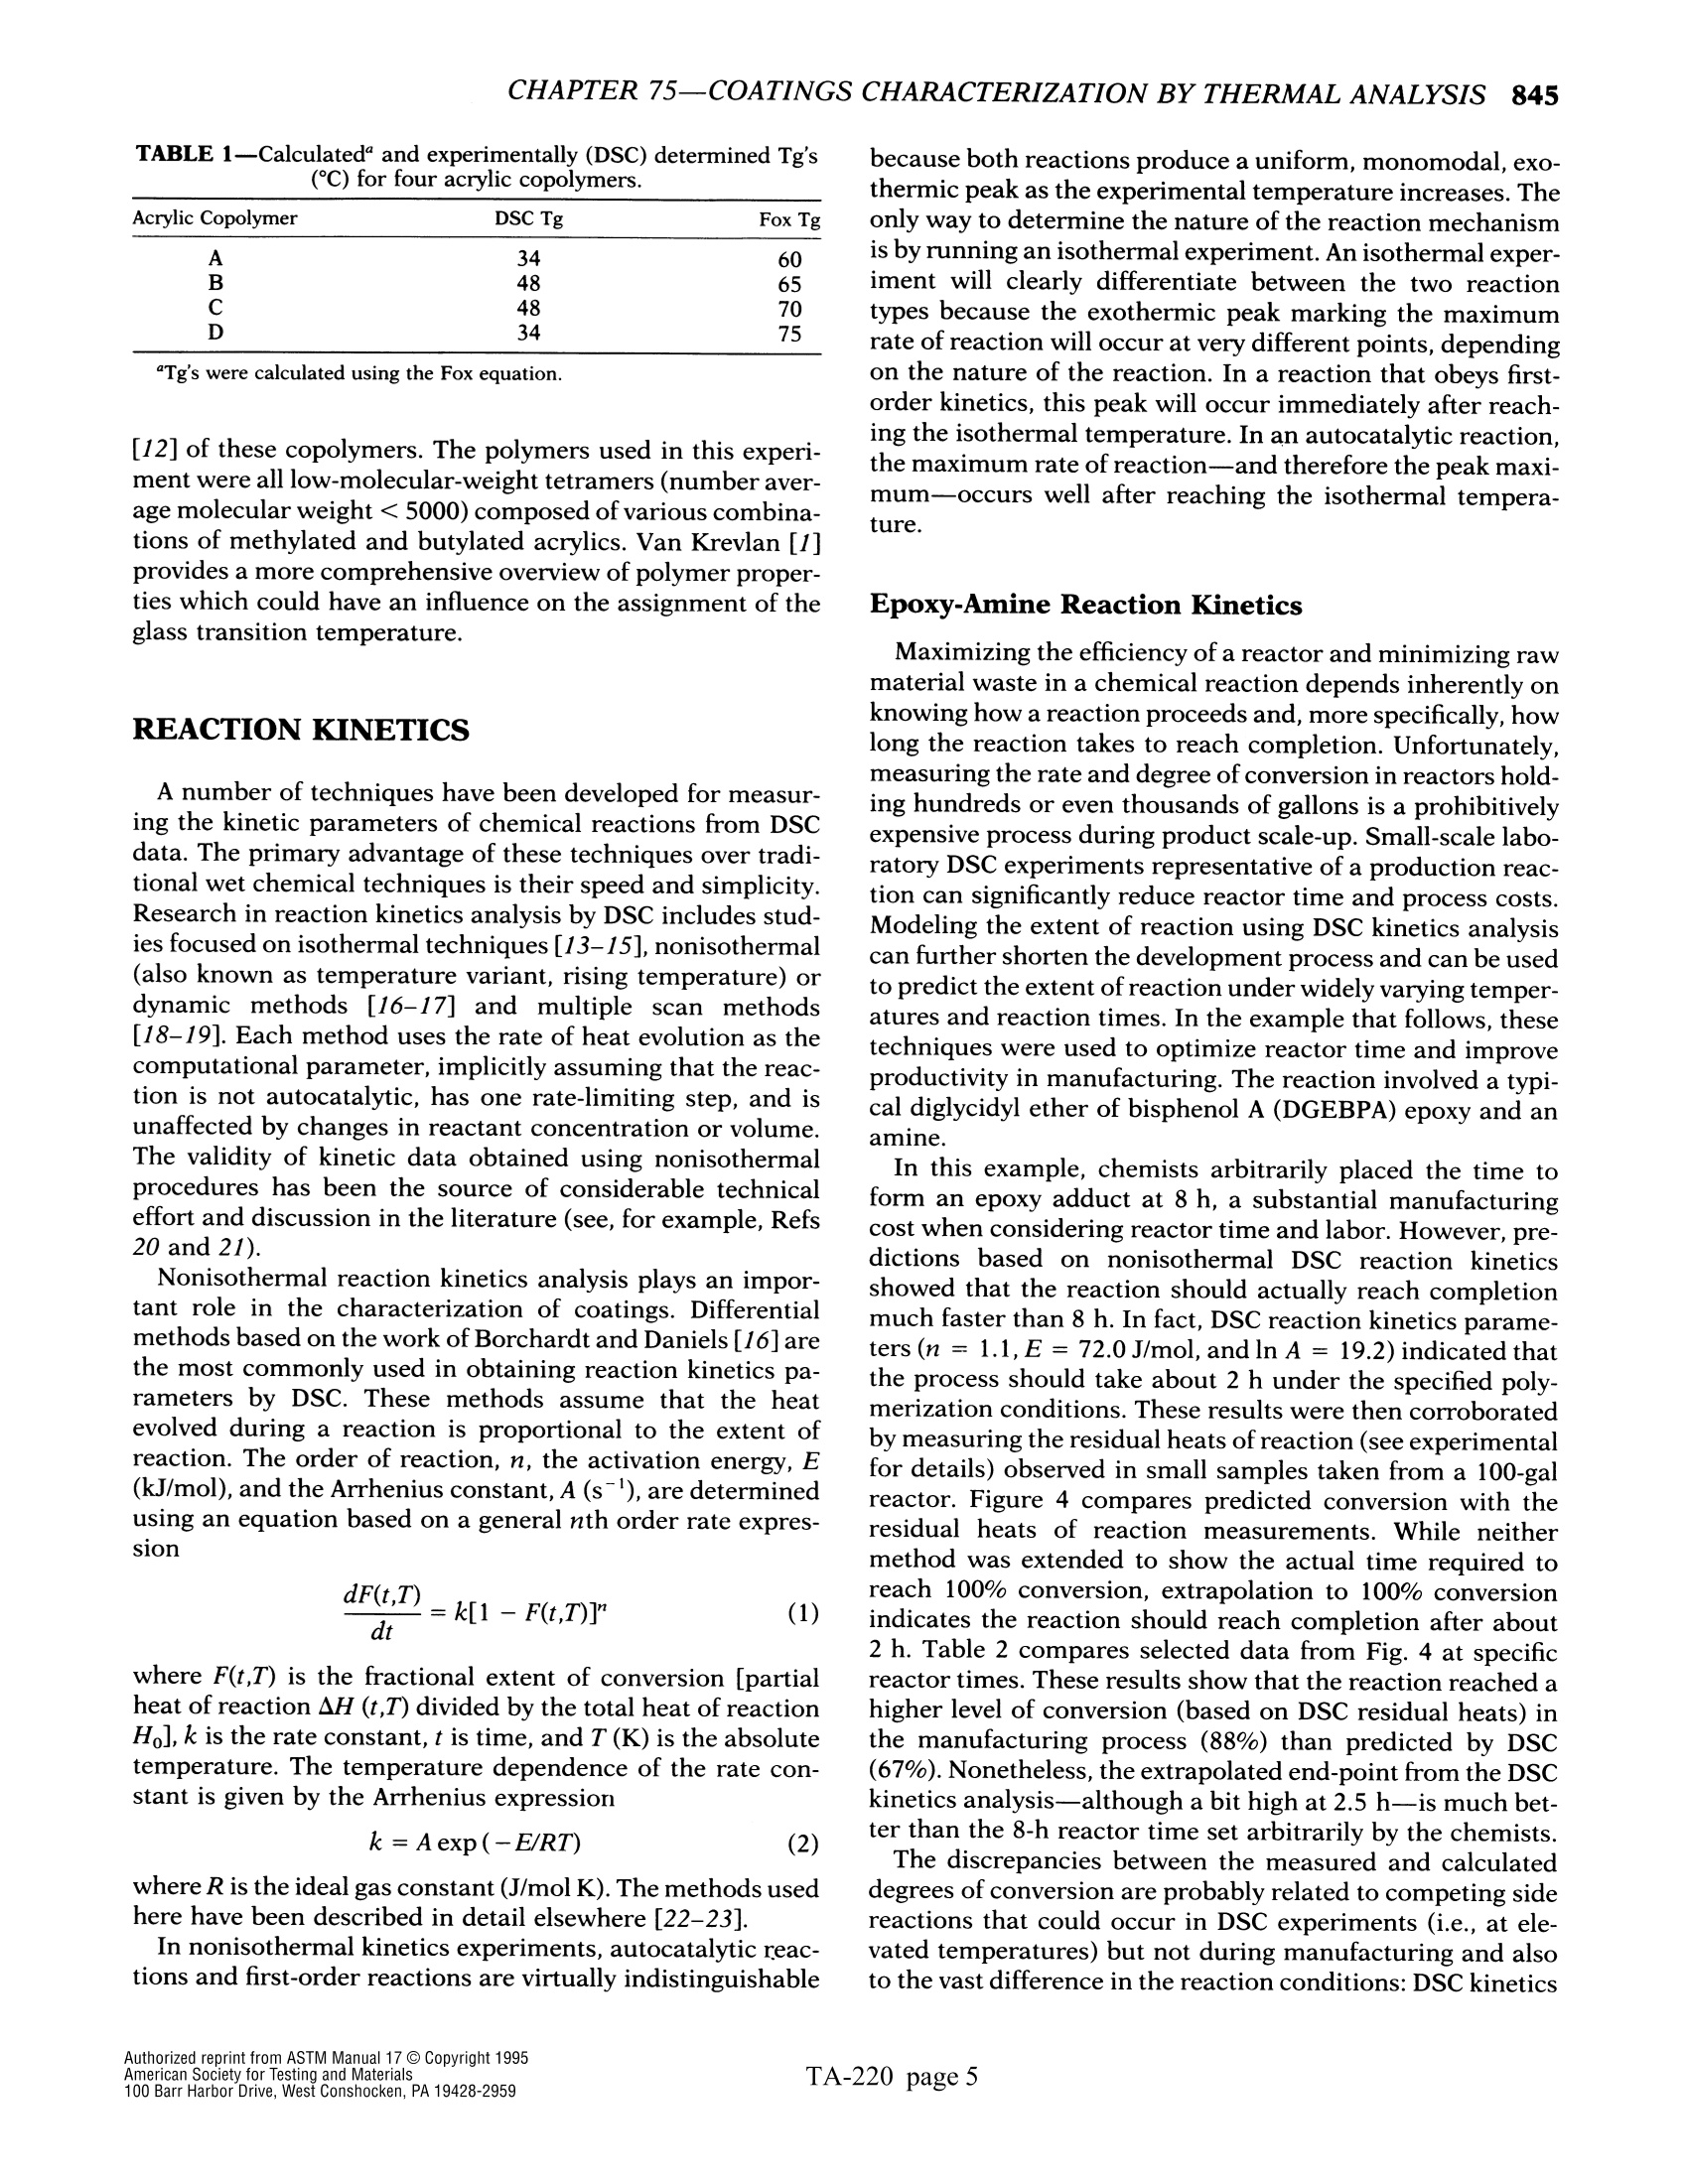
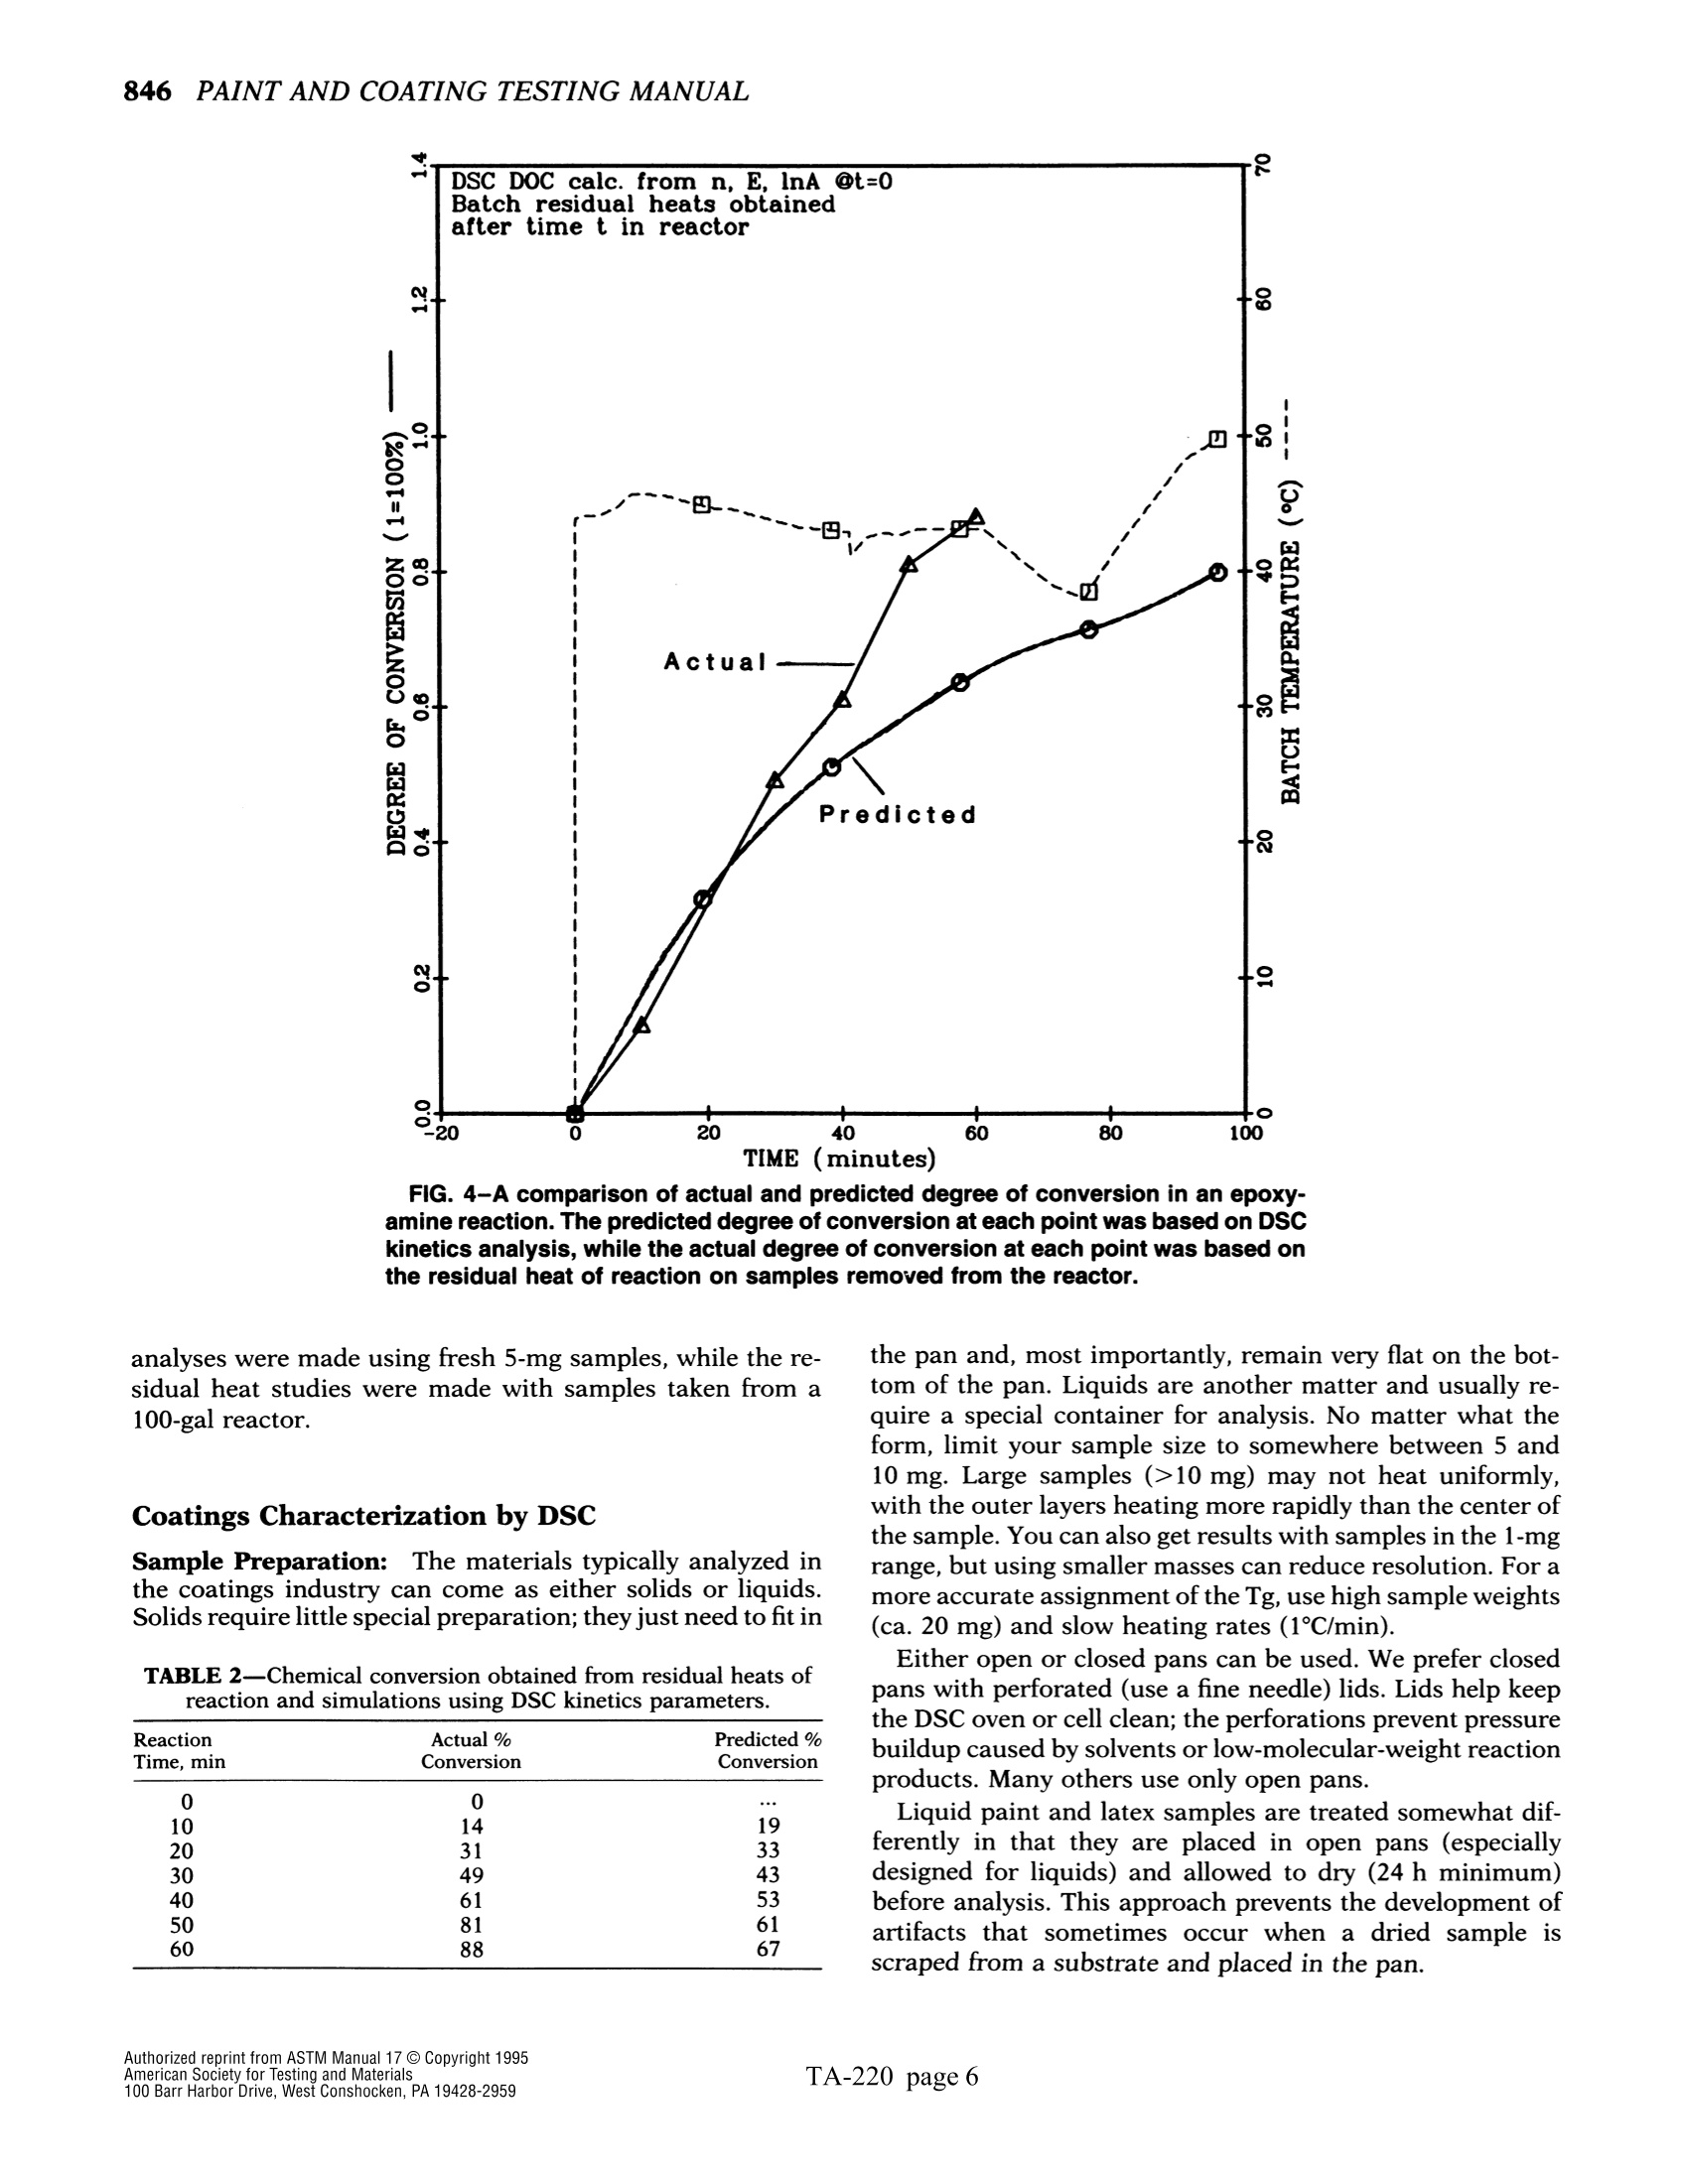


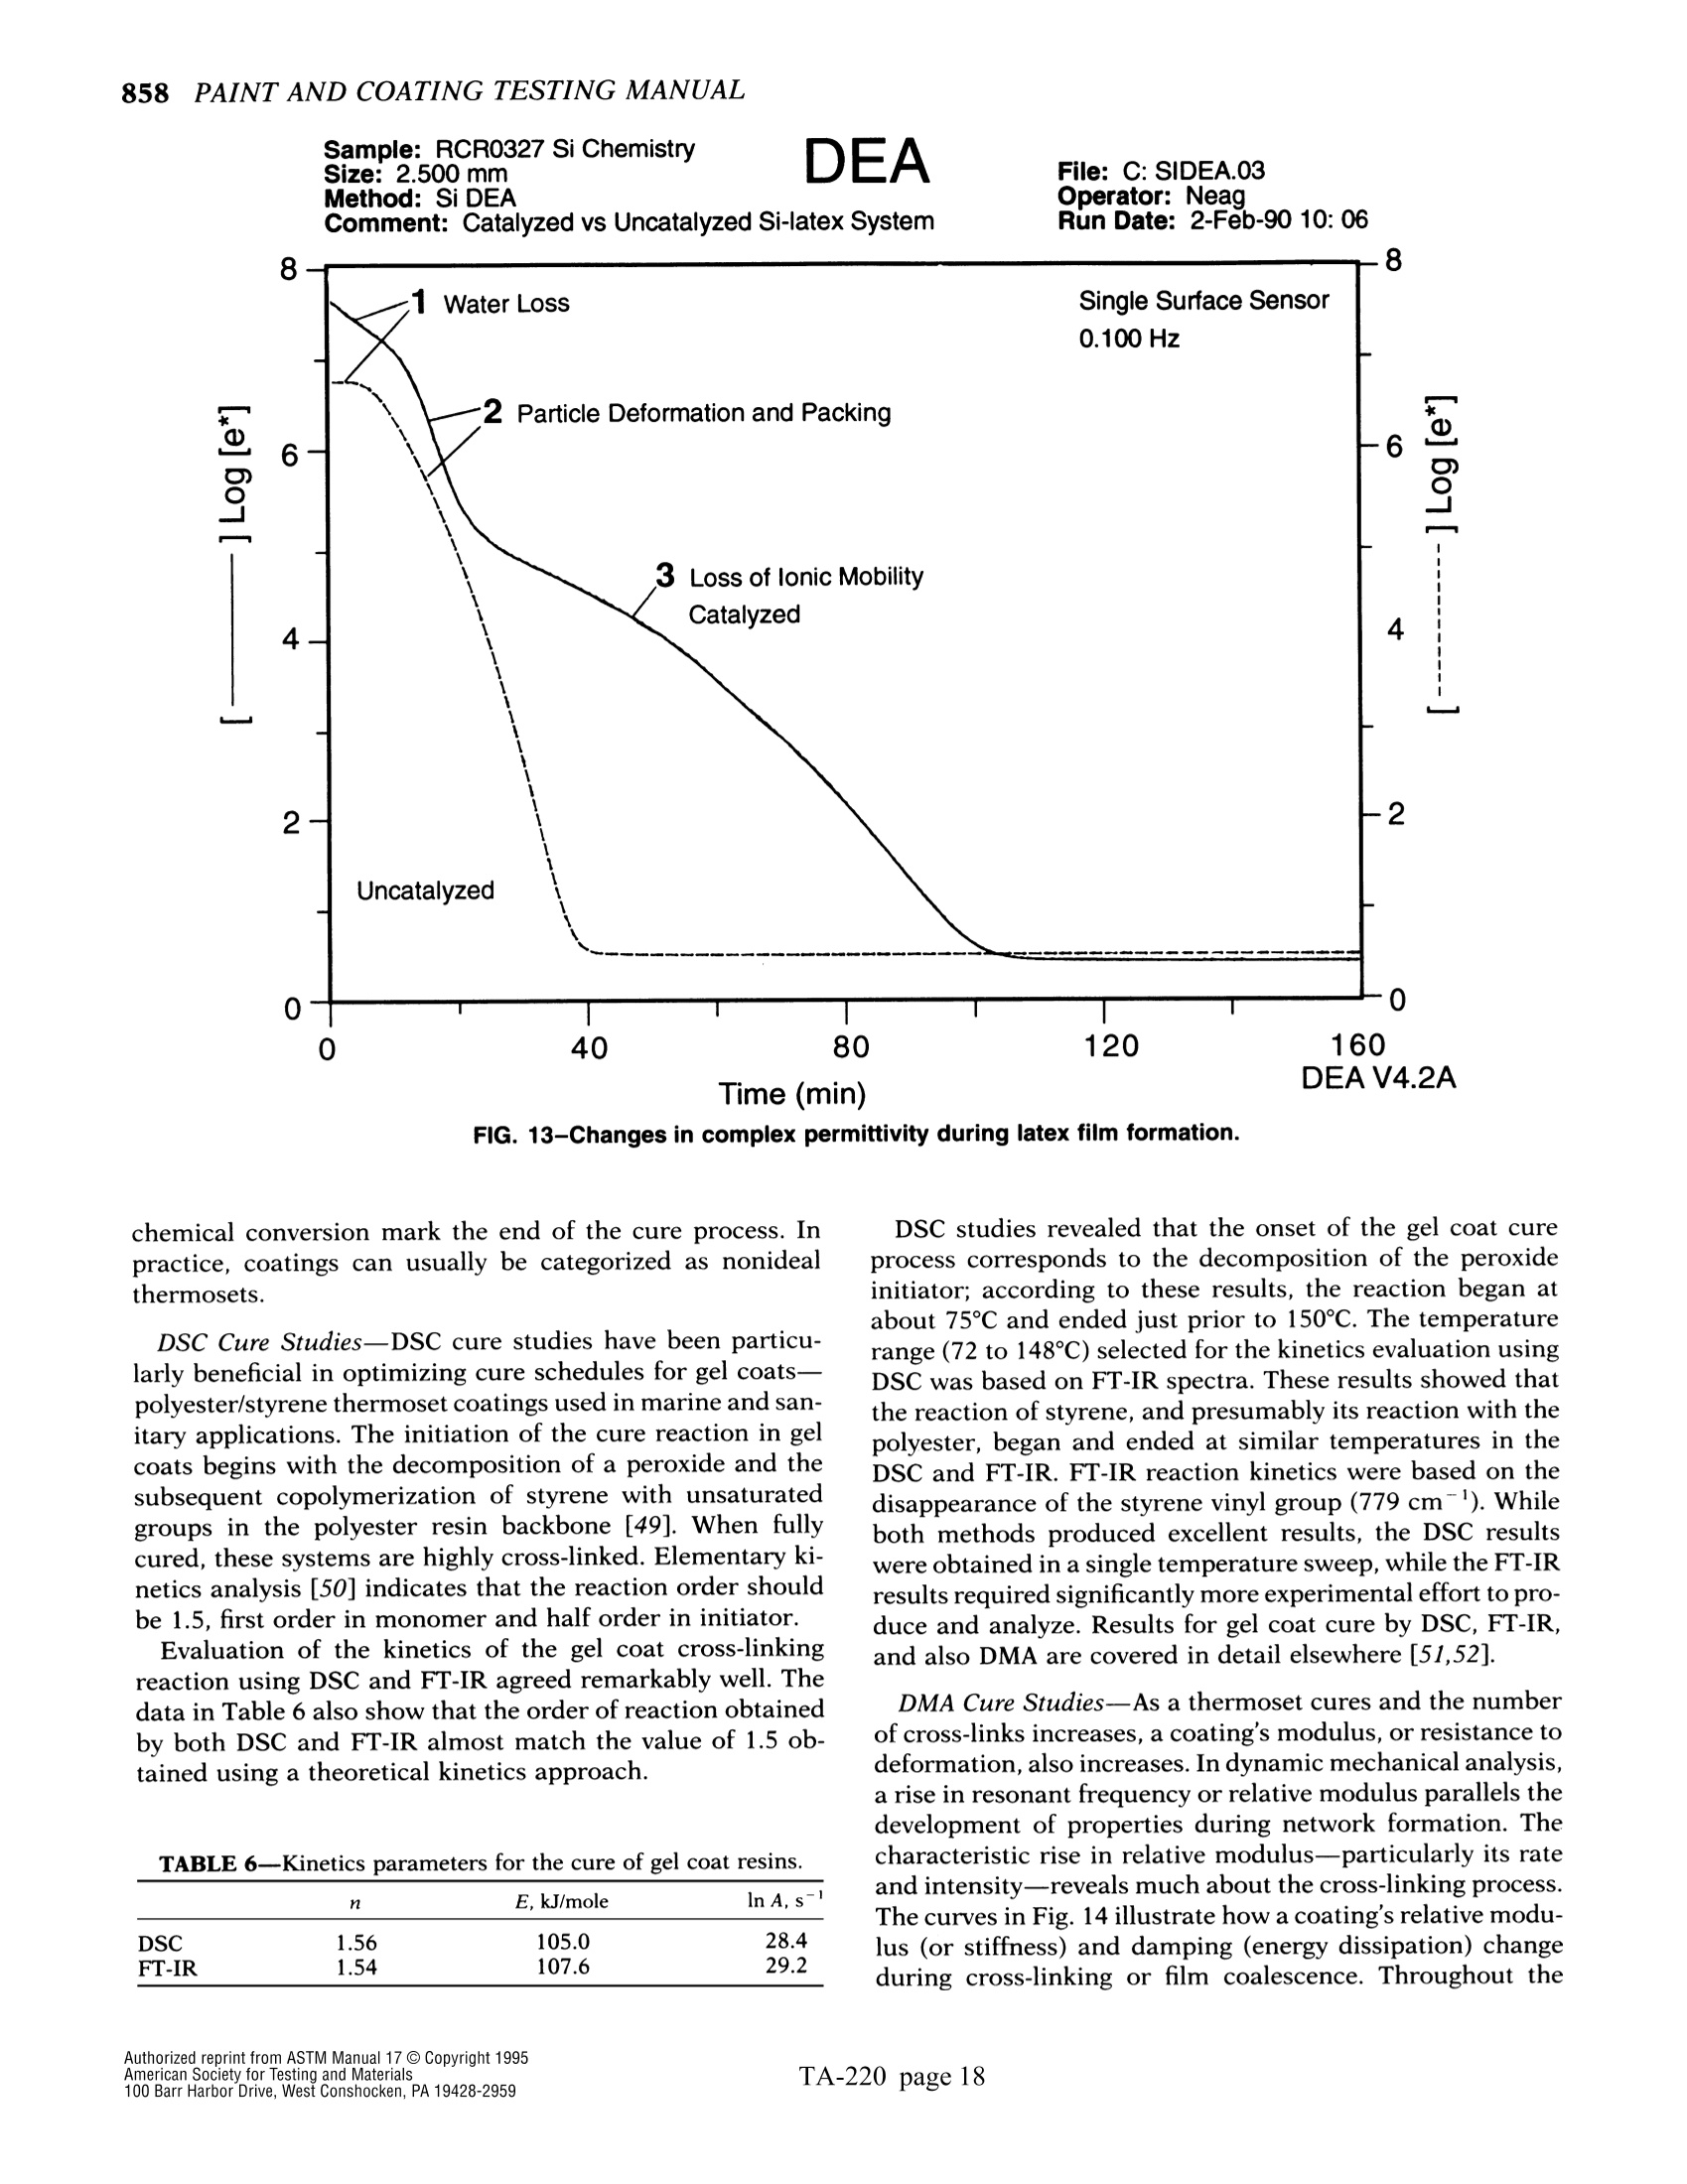

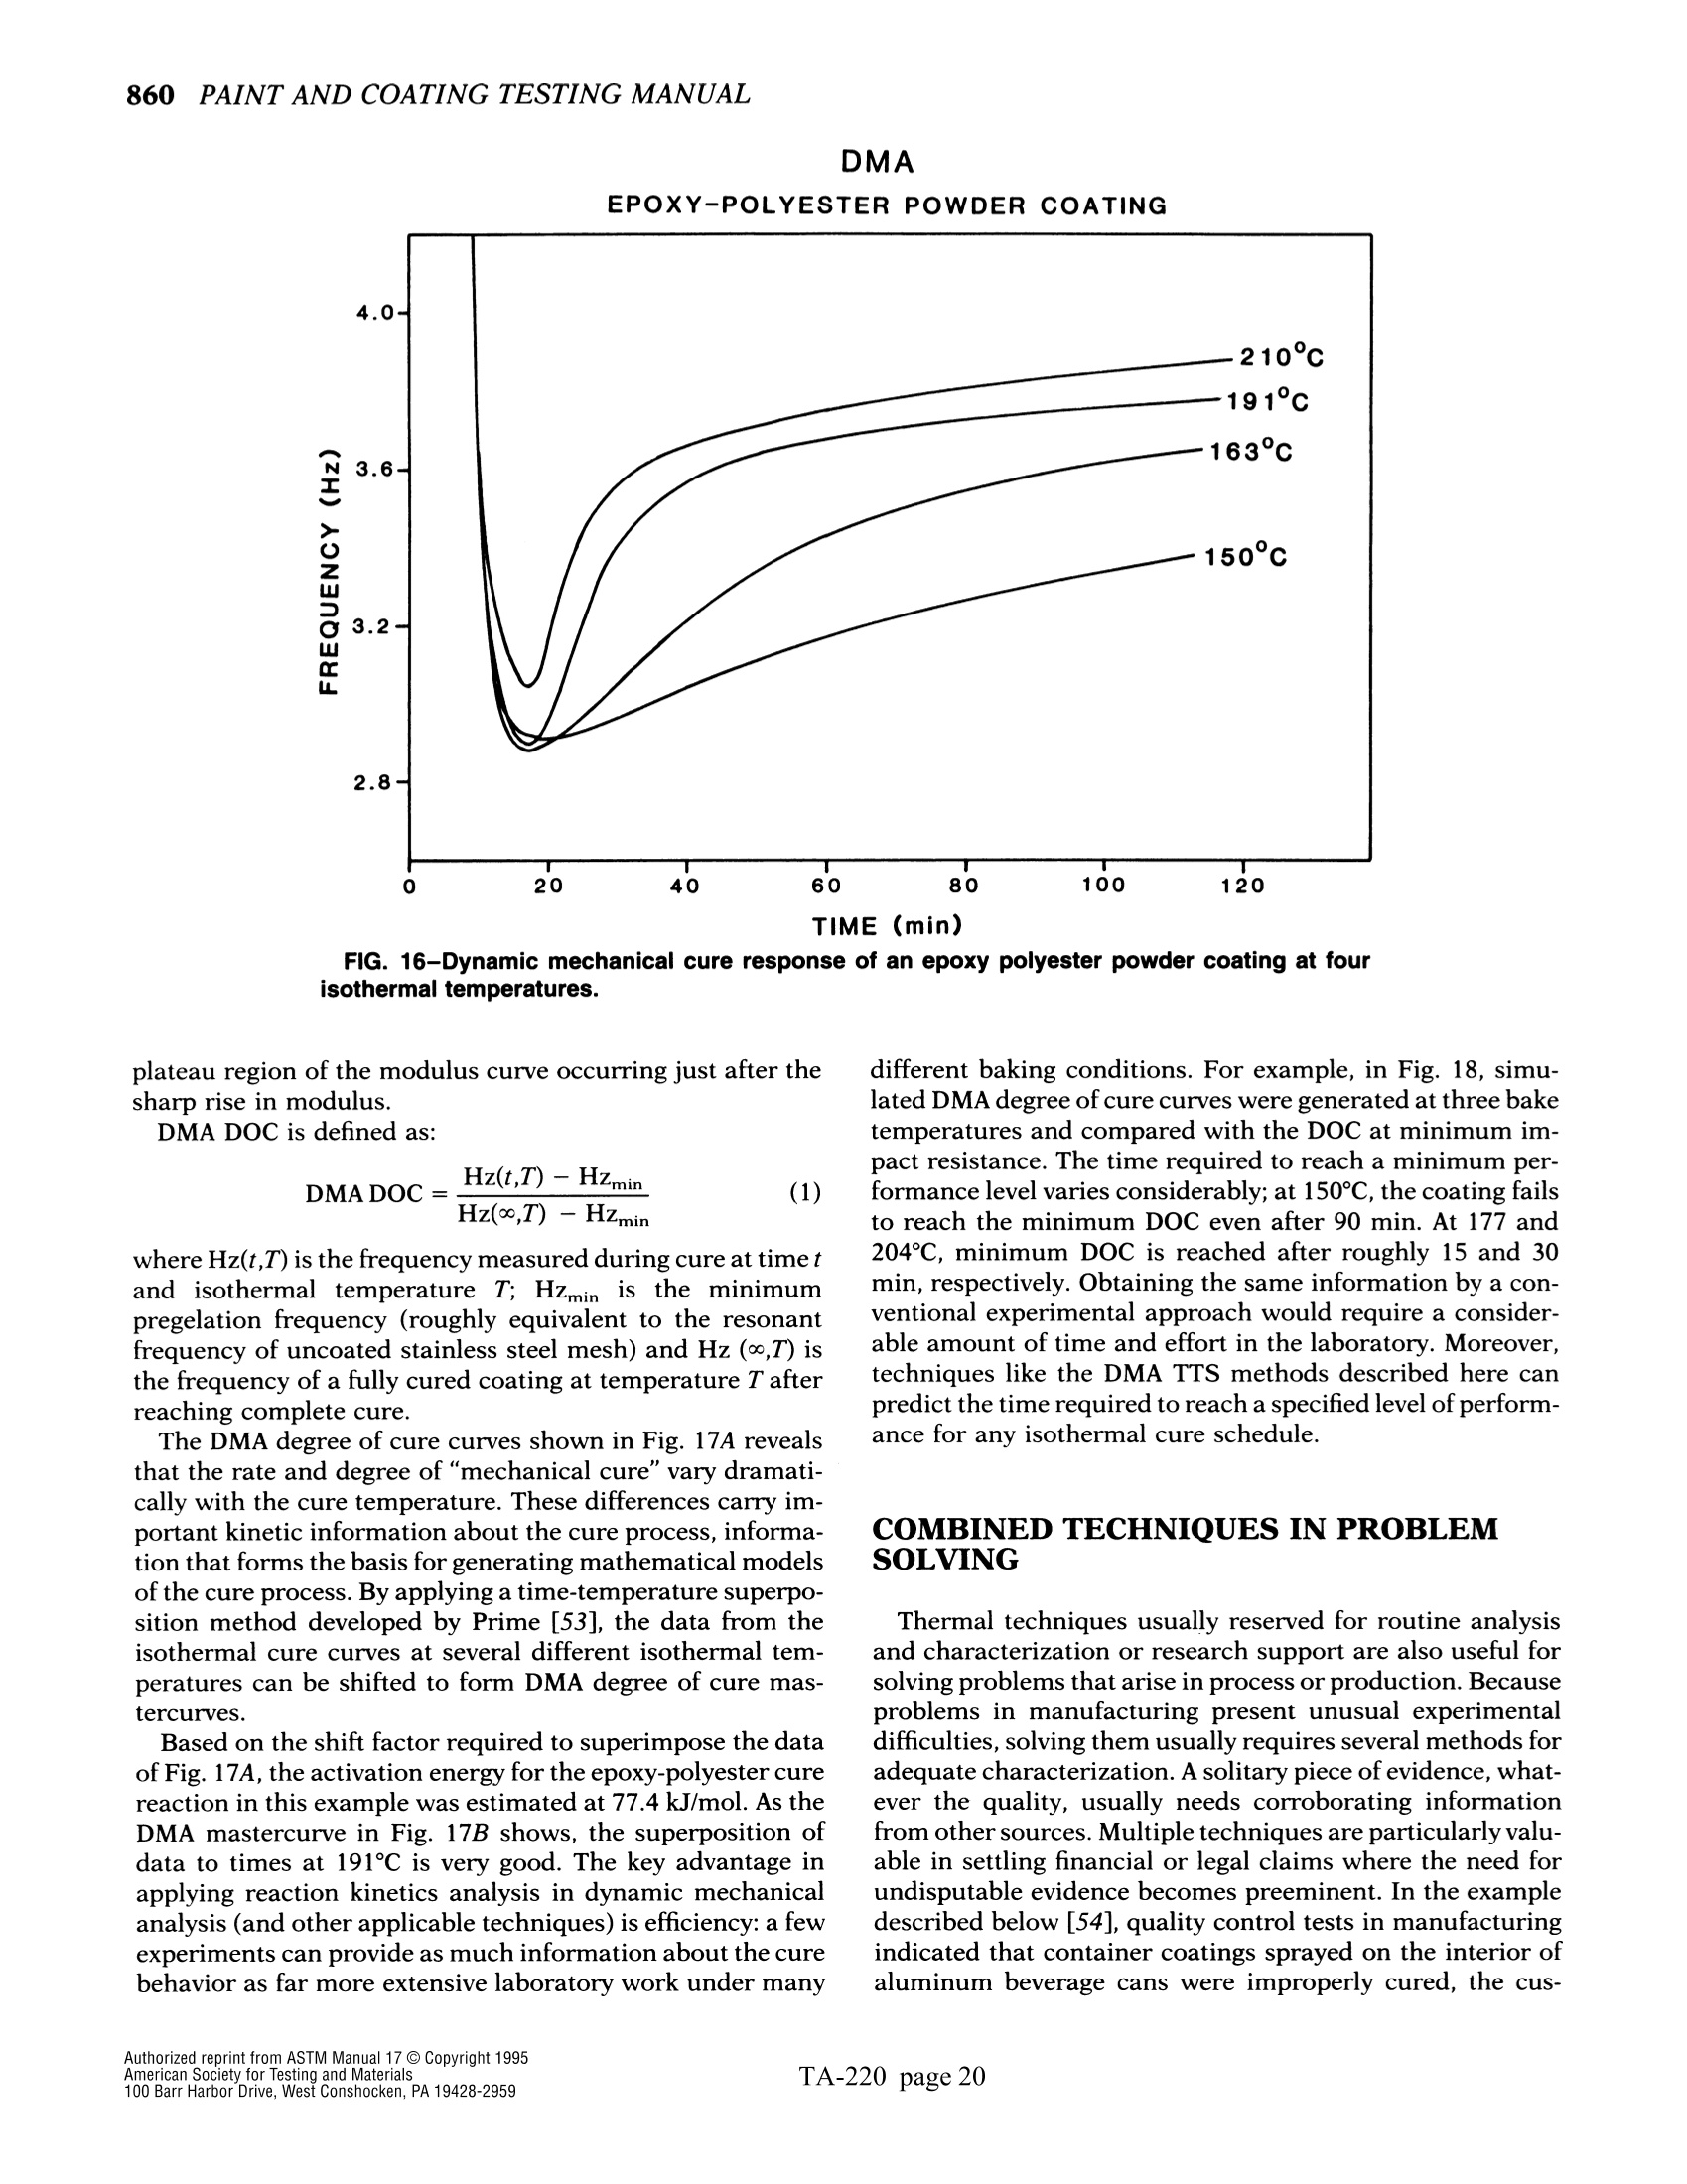
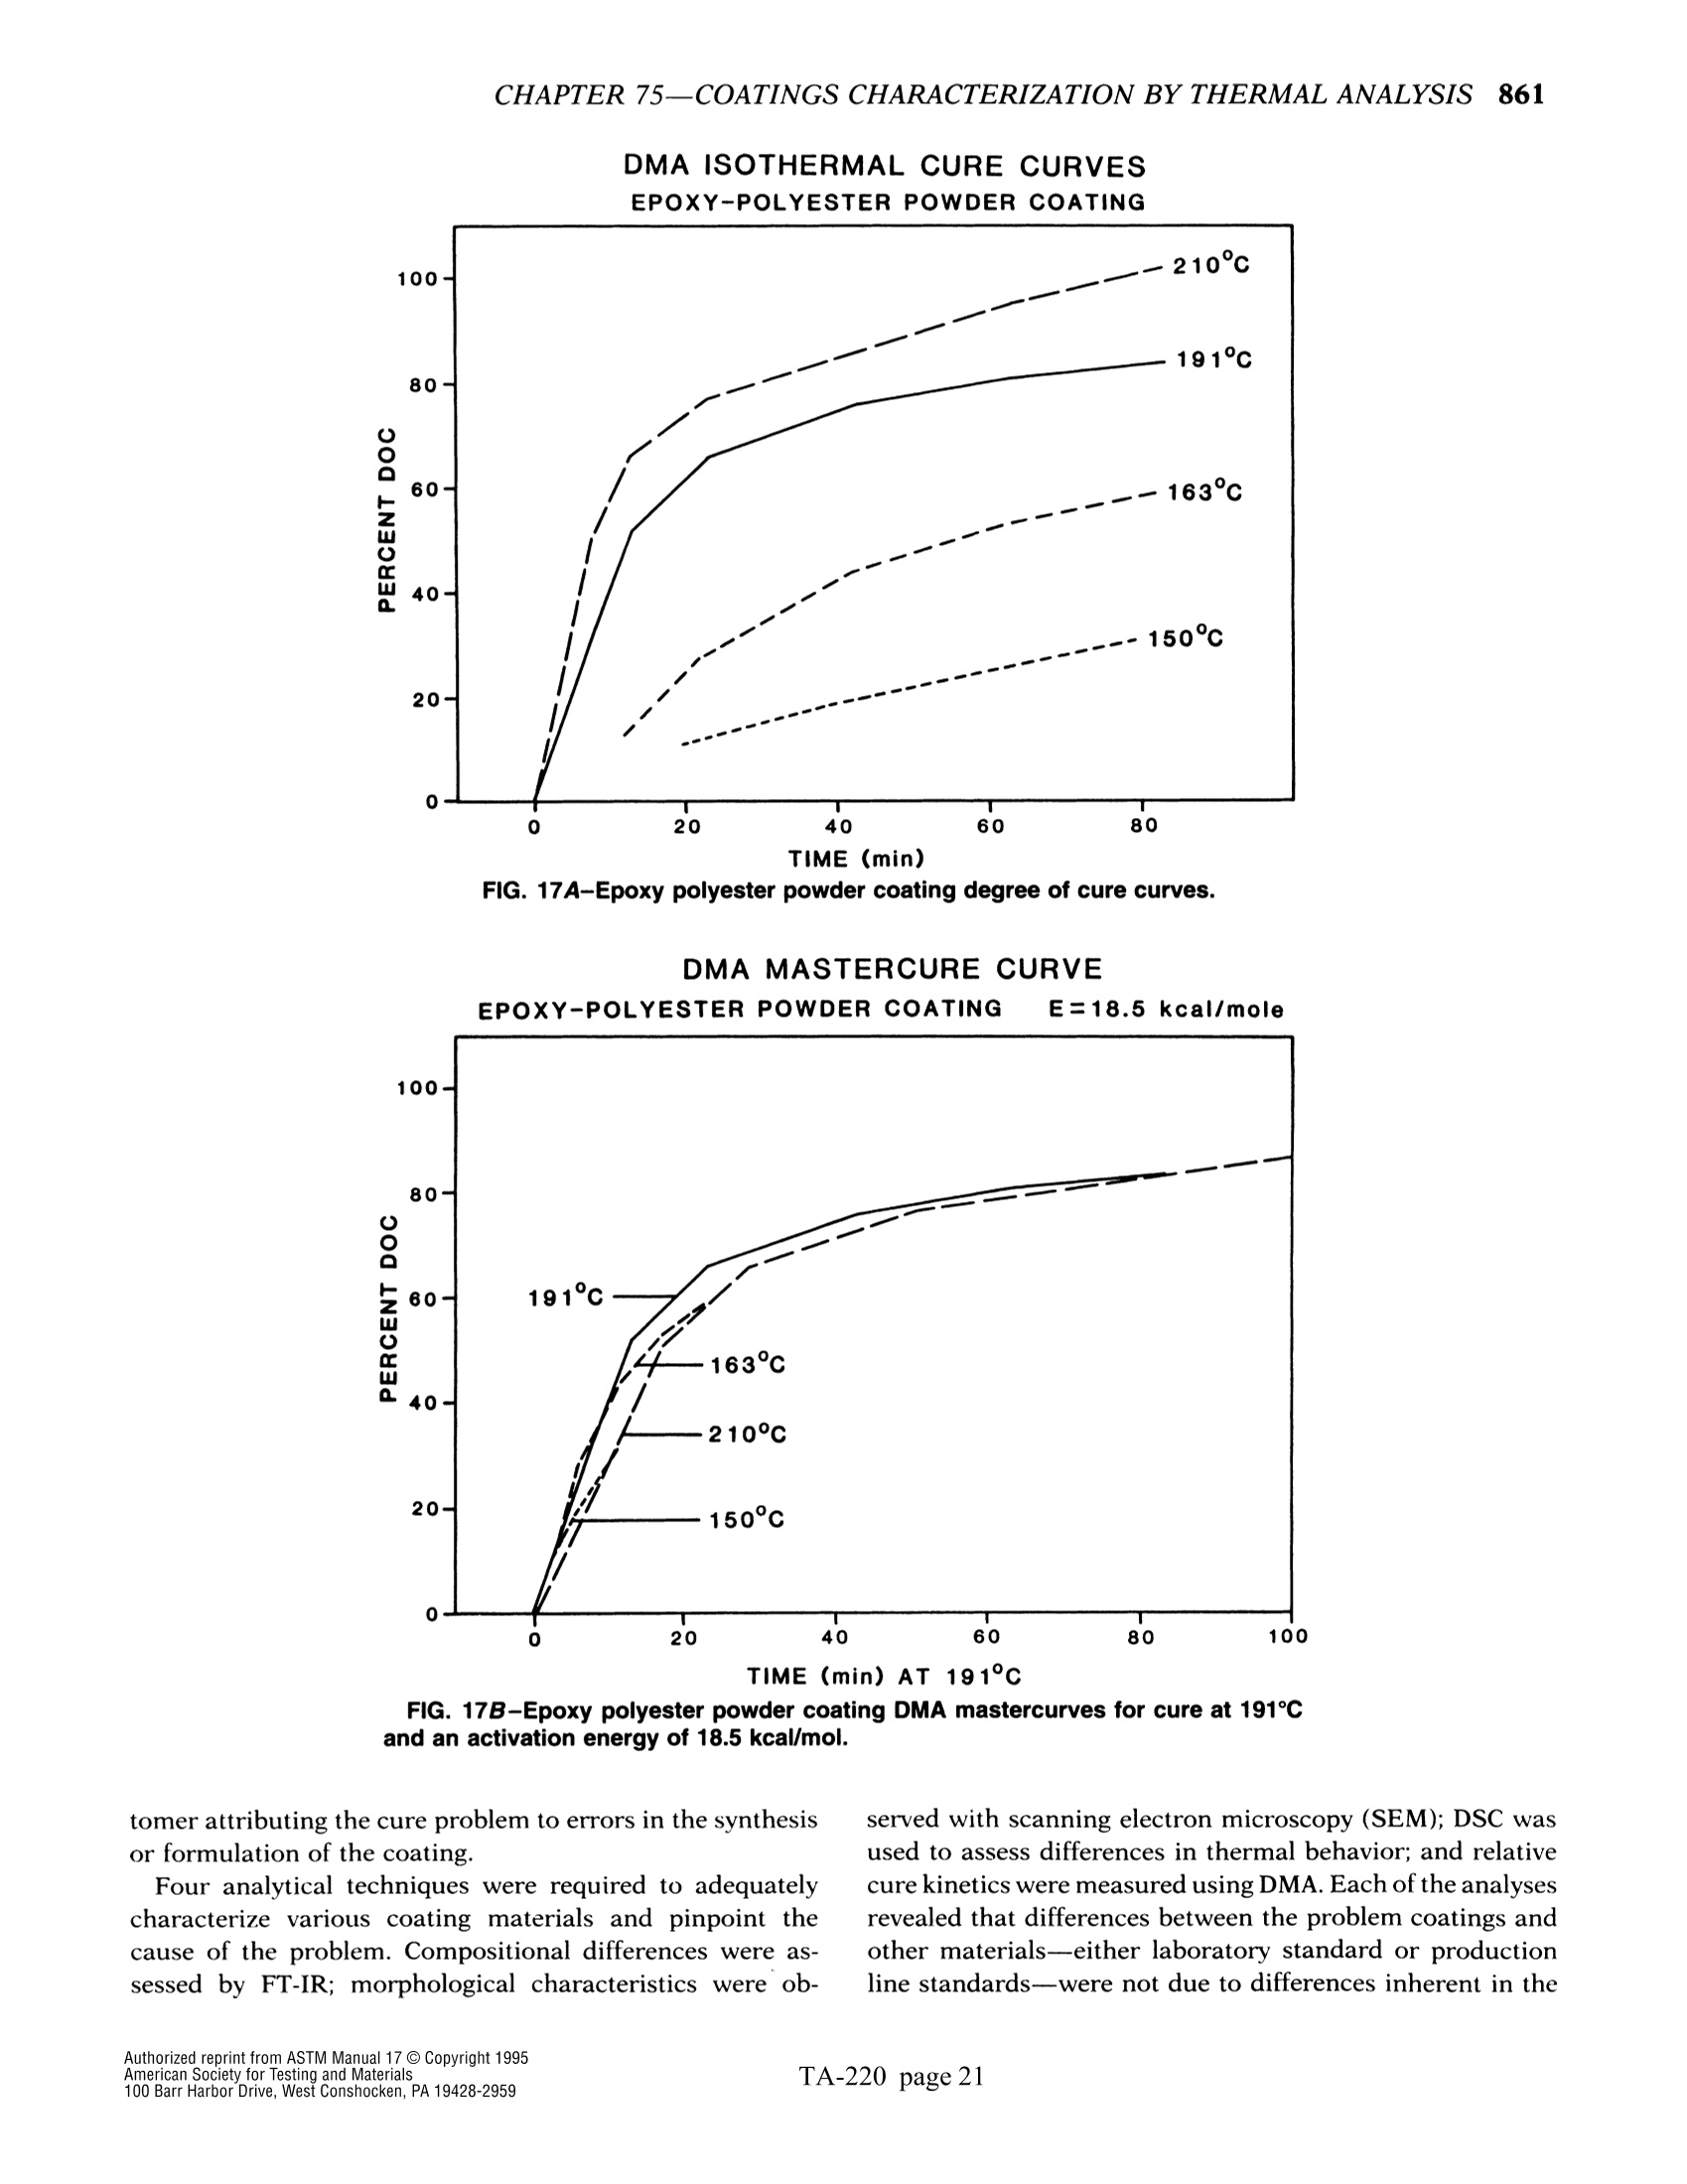
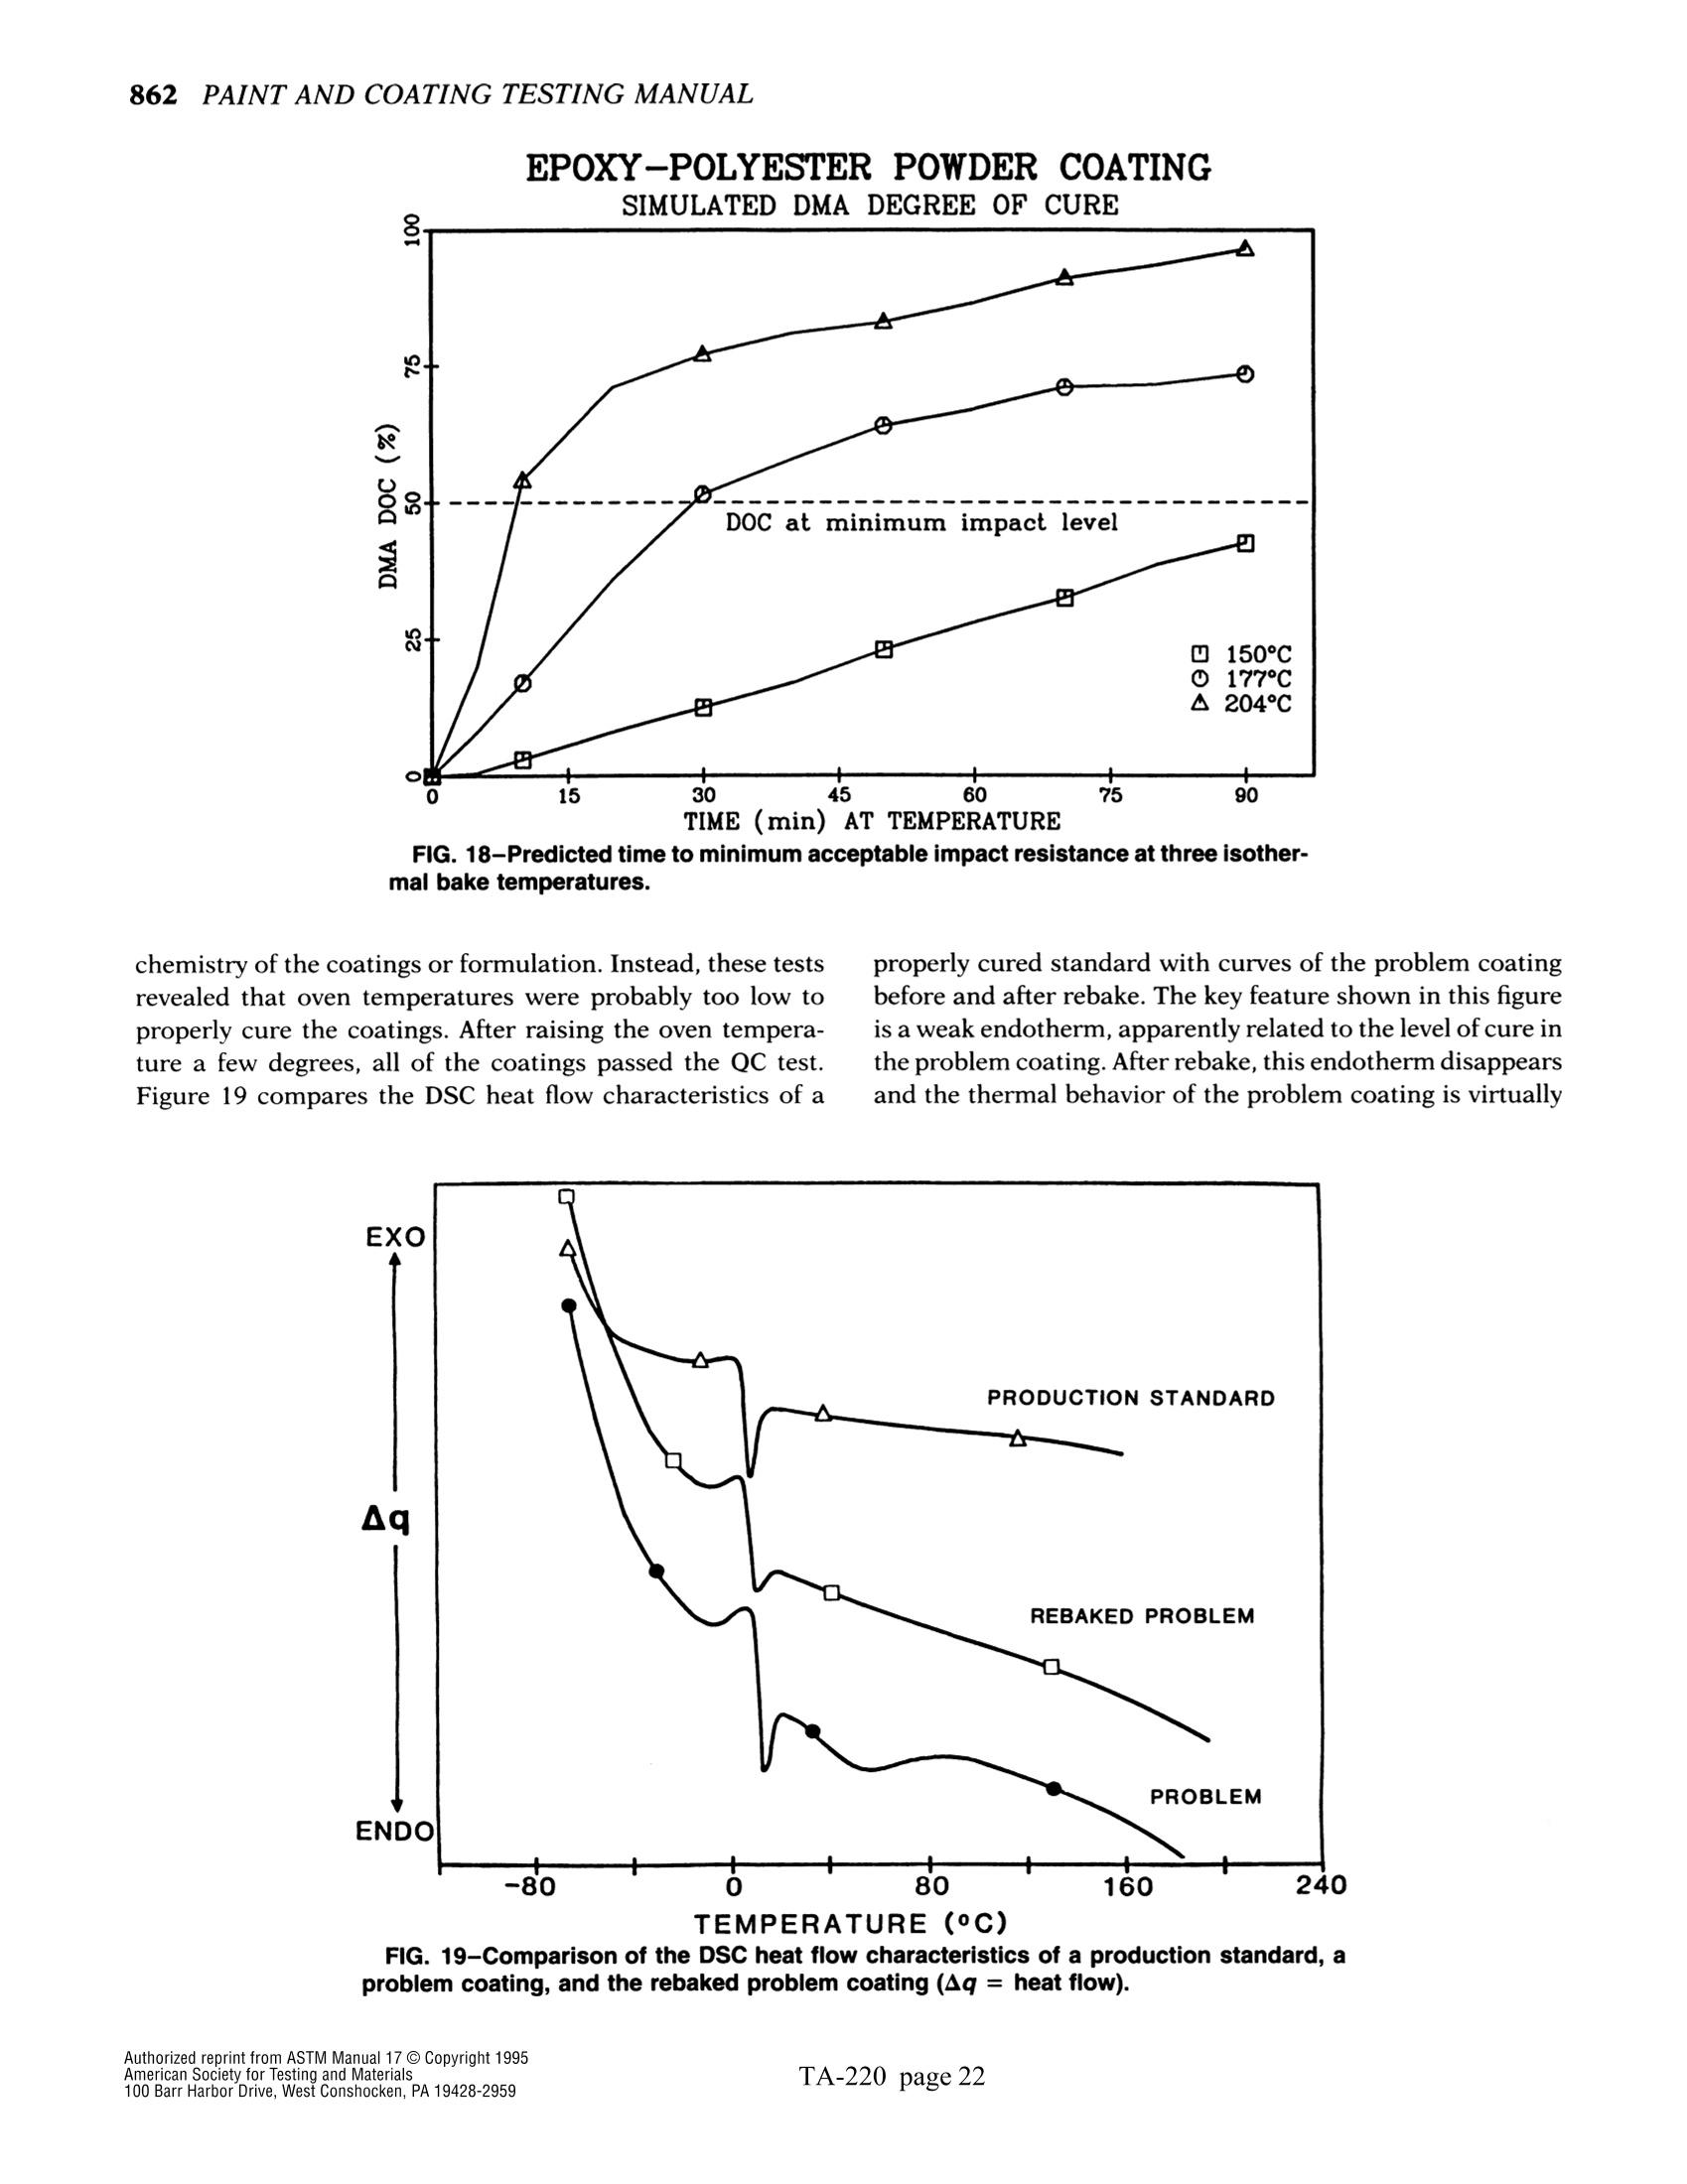
还剩22页未读,是否继续阅读?

产品配置单

TA仪器为您提供《薄膜涂料中热分析表征检测方案(差示扫描量热)》,该方案主要用于涂料中热分析表征检测,参考标准--,《薄膜涂料中热分析表征检测方案(差示扫描量热)》用到的仪器有TA仪器 Discovery差示扫描量热仪
相关方案
更多
该厂商其他方案
更多