


方案详情
文
本文运用热分析分析热塑性材料的物理性质。热分析是一系列的传统测量技术用于确定材料特性随温度的变化的技术。对两个工程热塑性塑料的短期和长期的物理性质研究的实验结果表明,热分析对描述热塑性材料的物理性质很有家价值。
方案详情

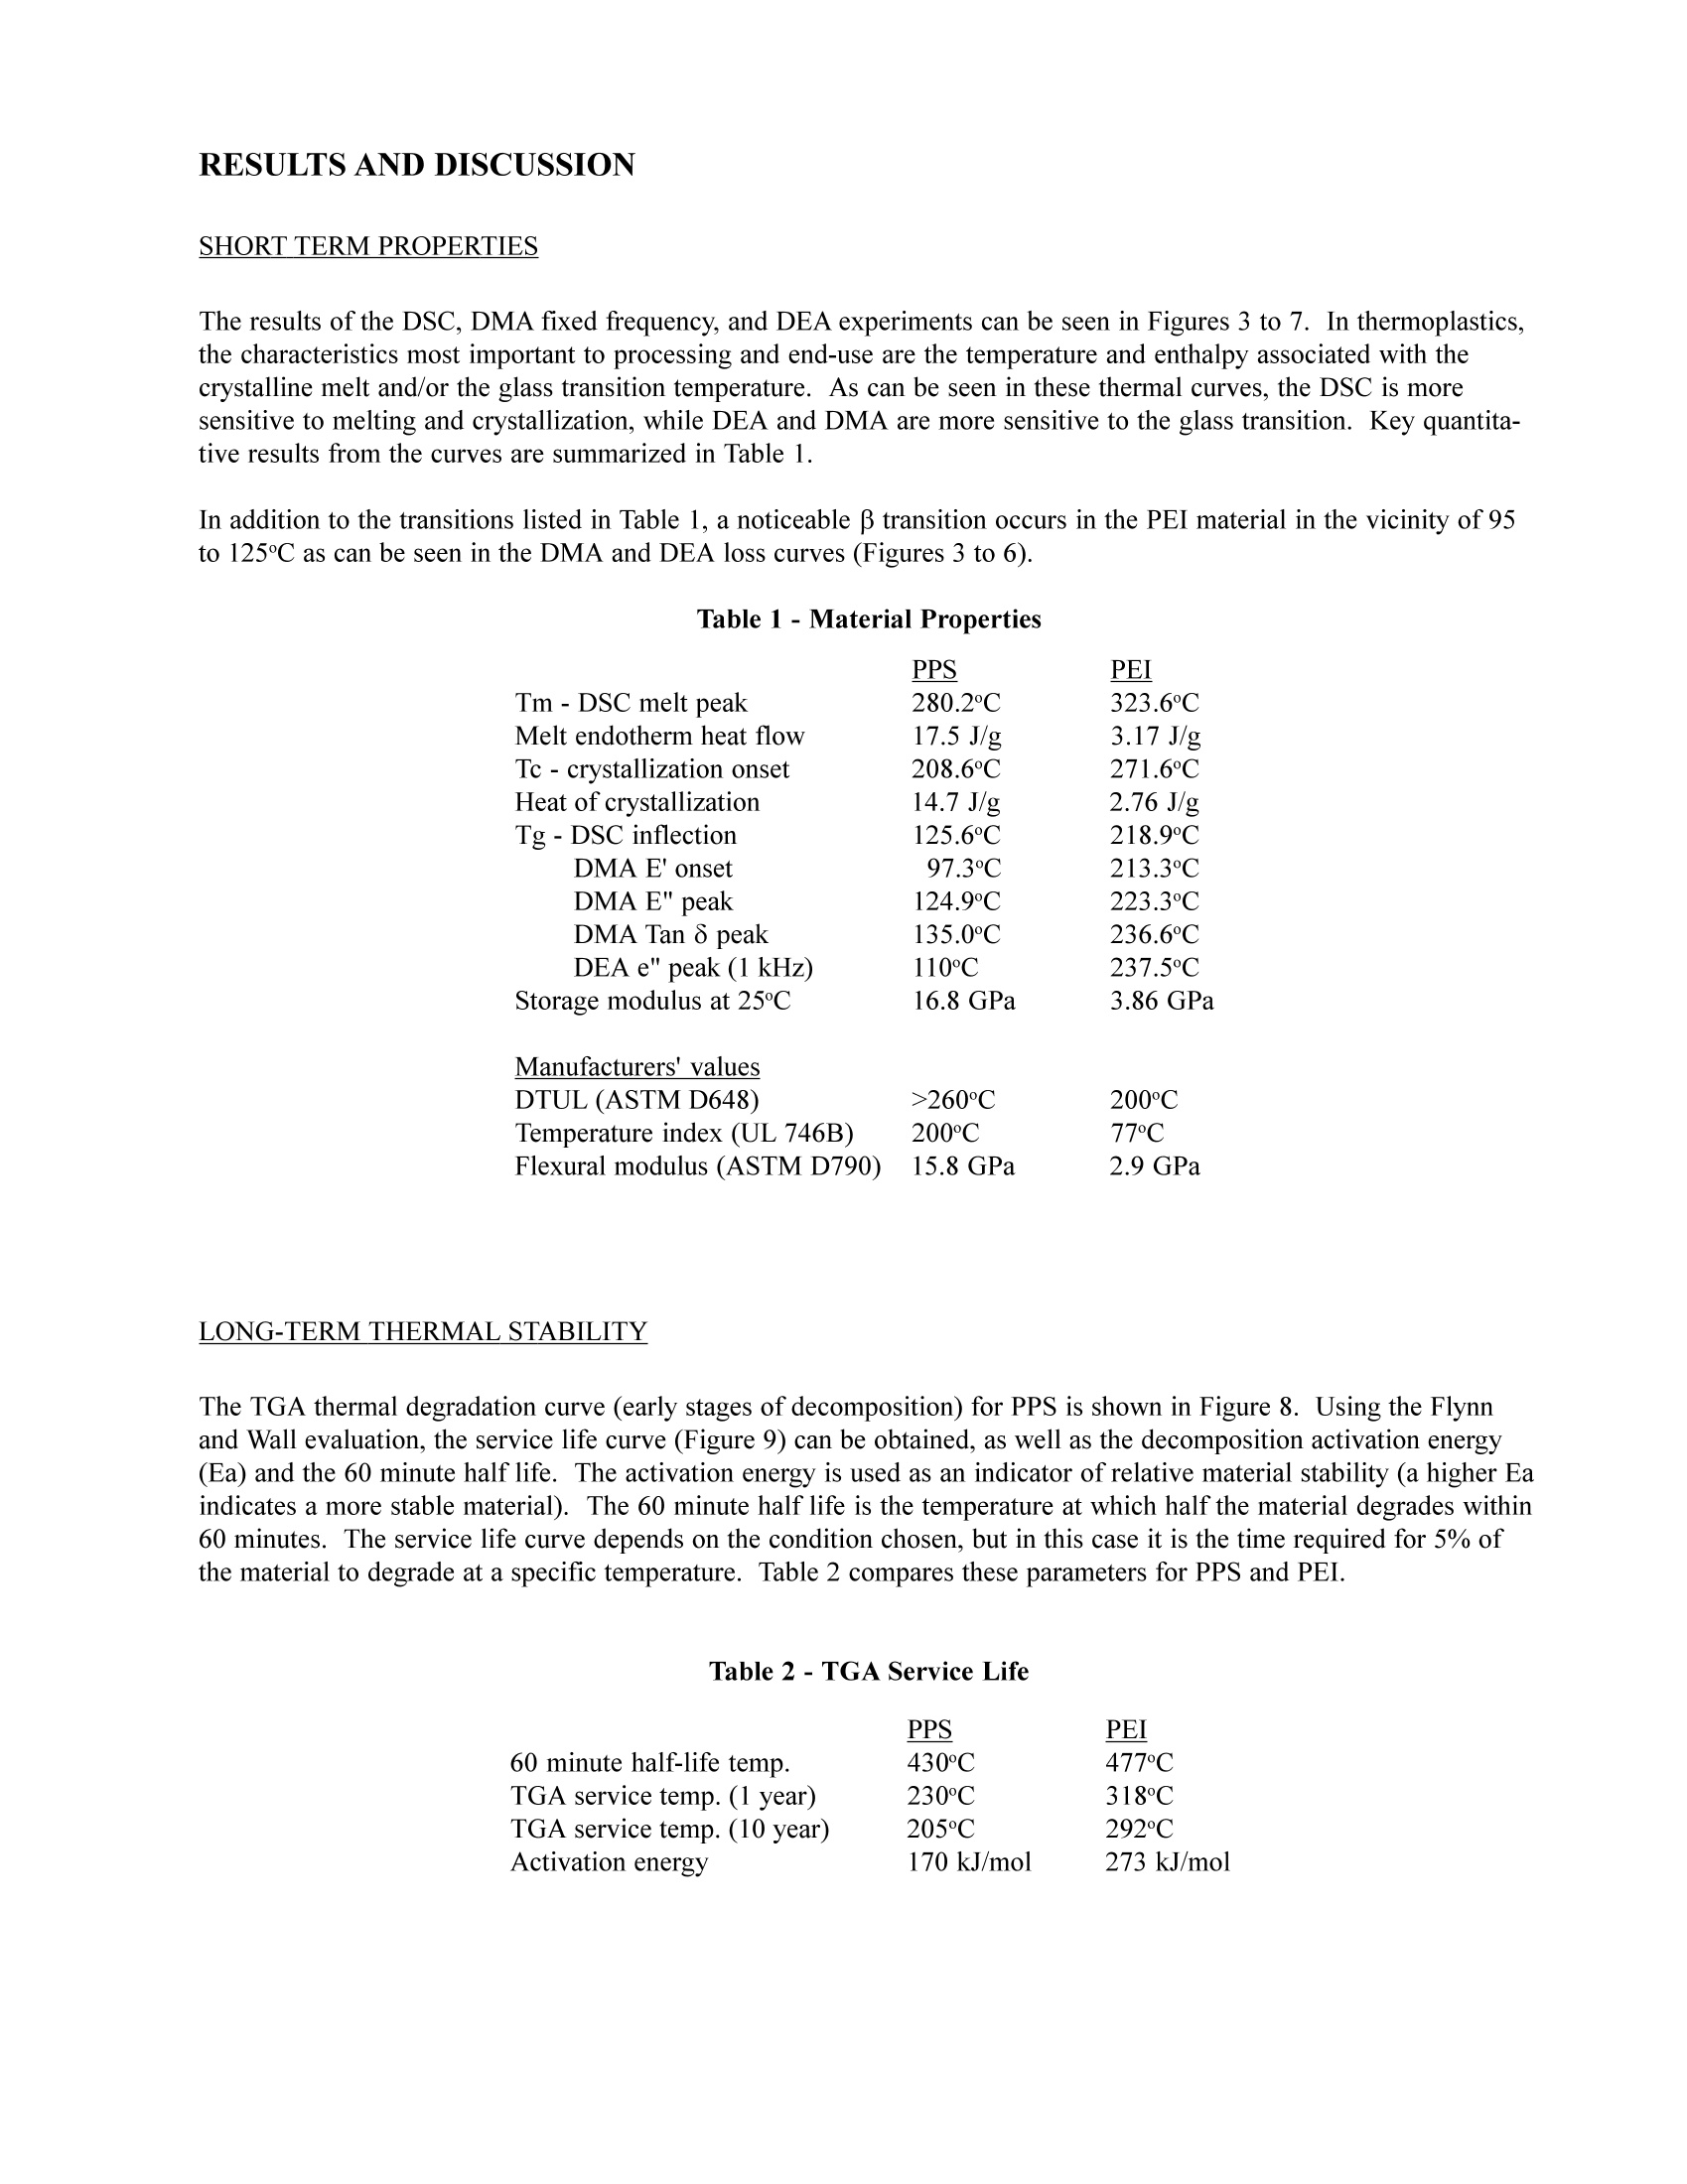
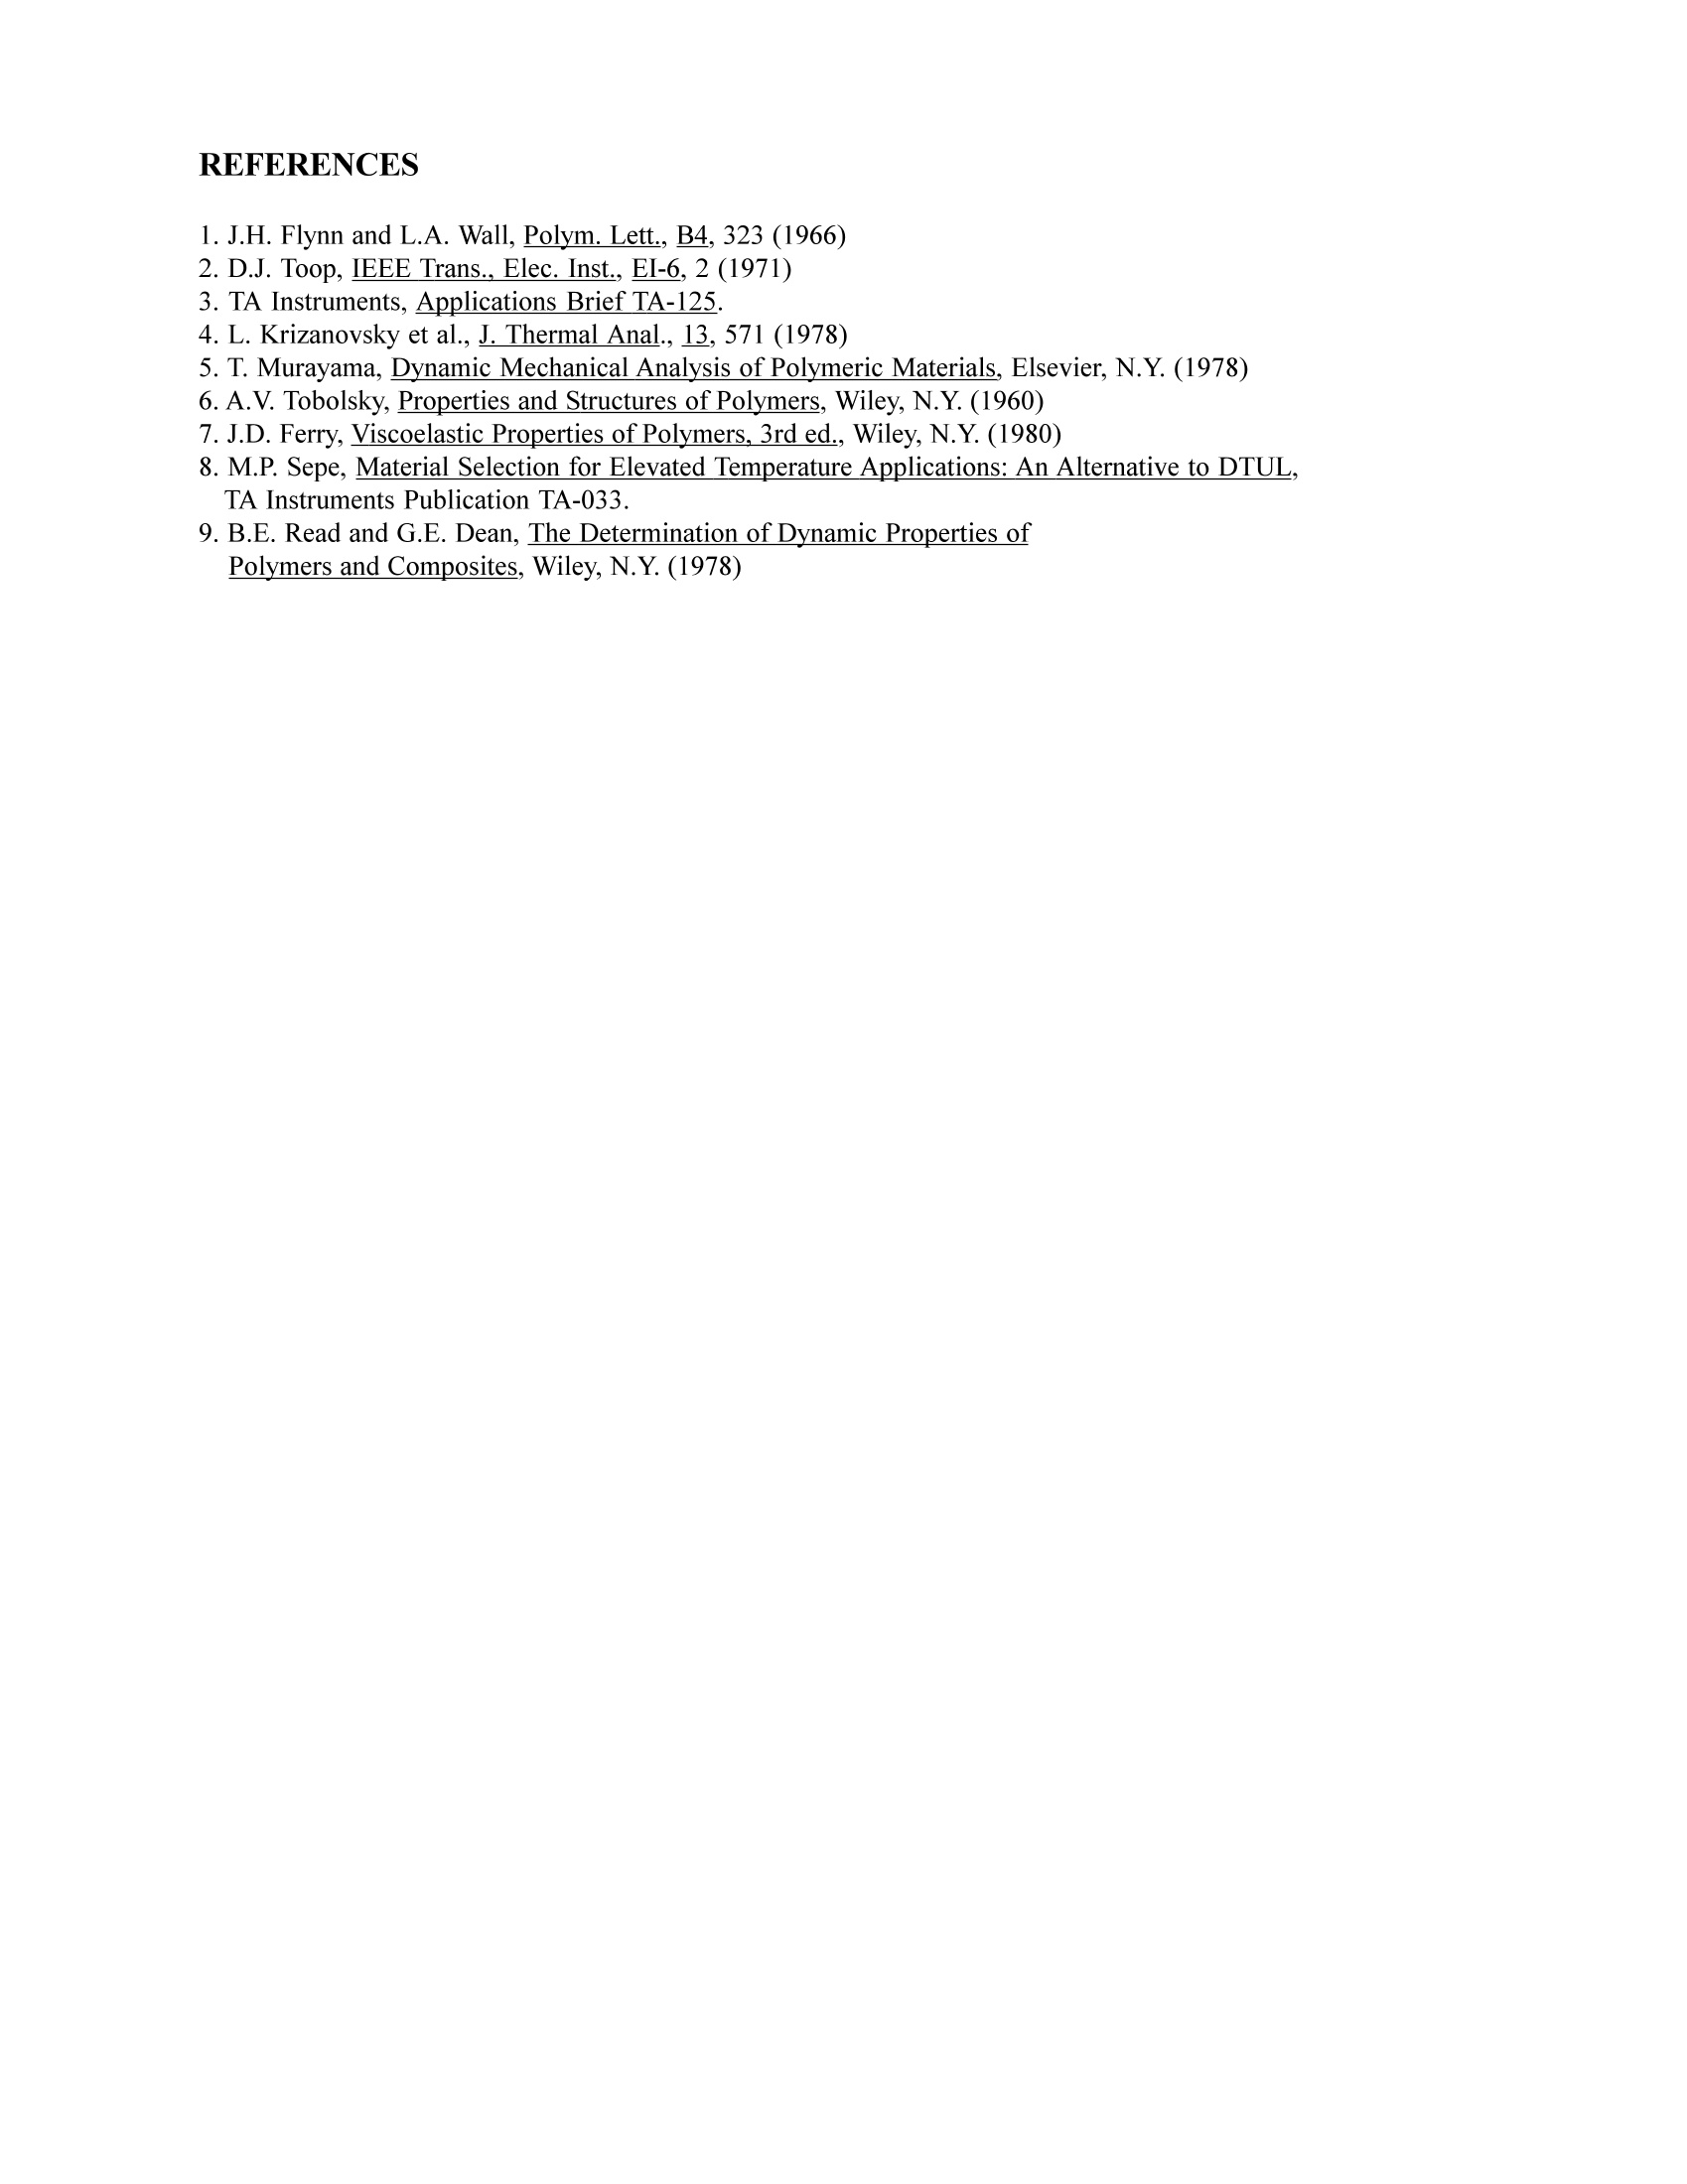
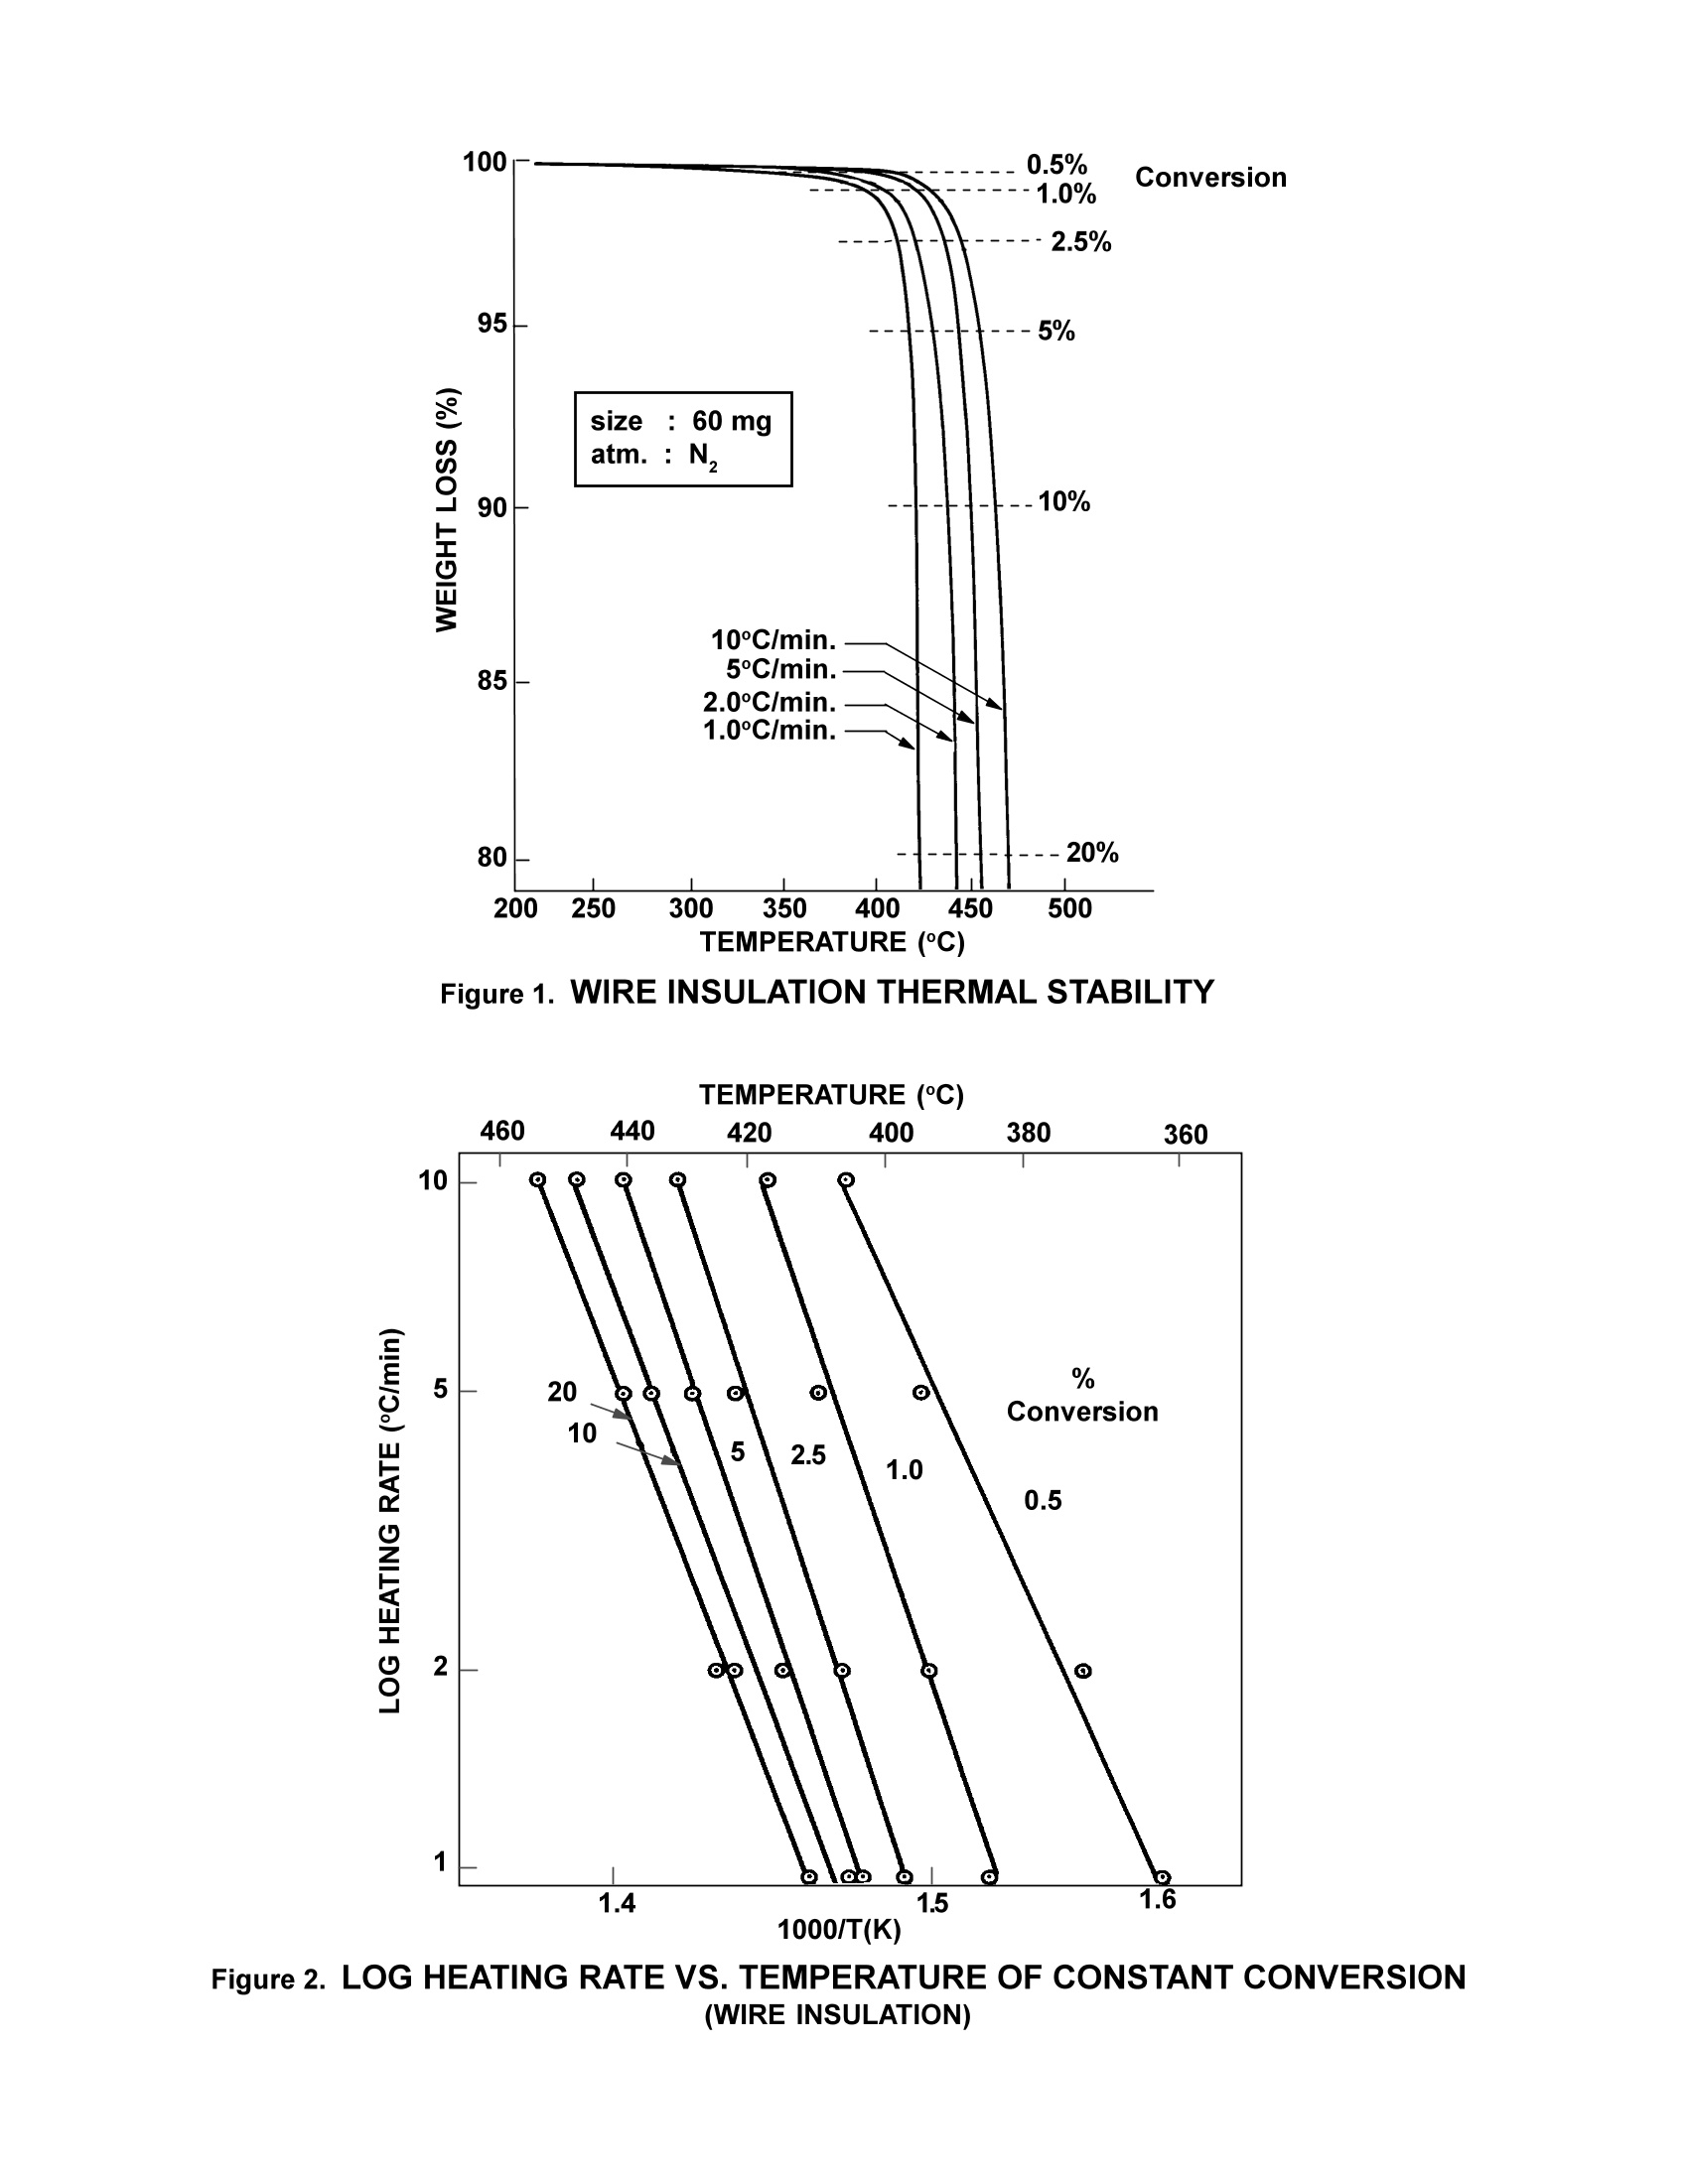
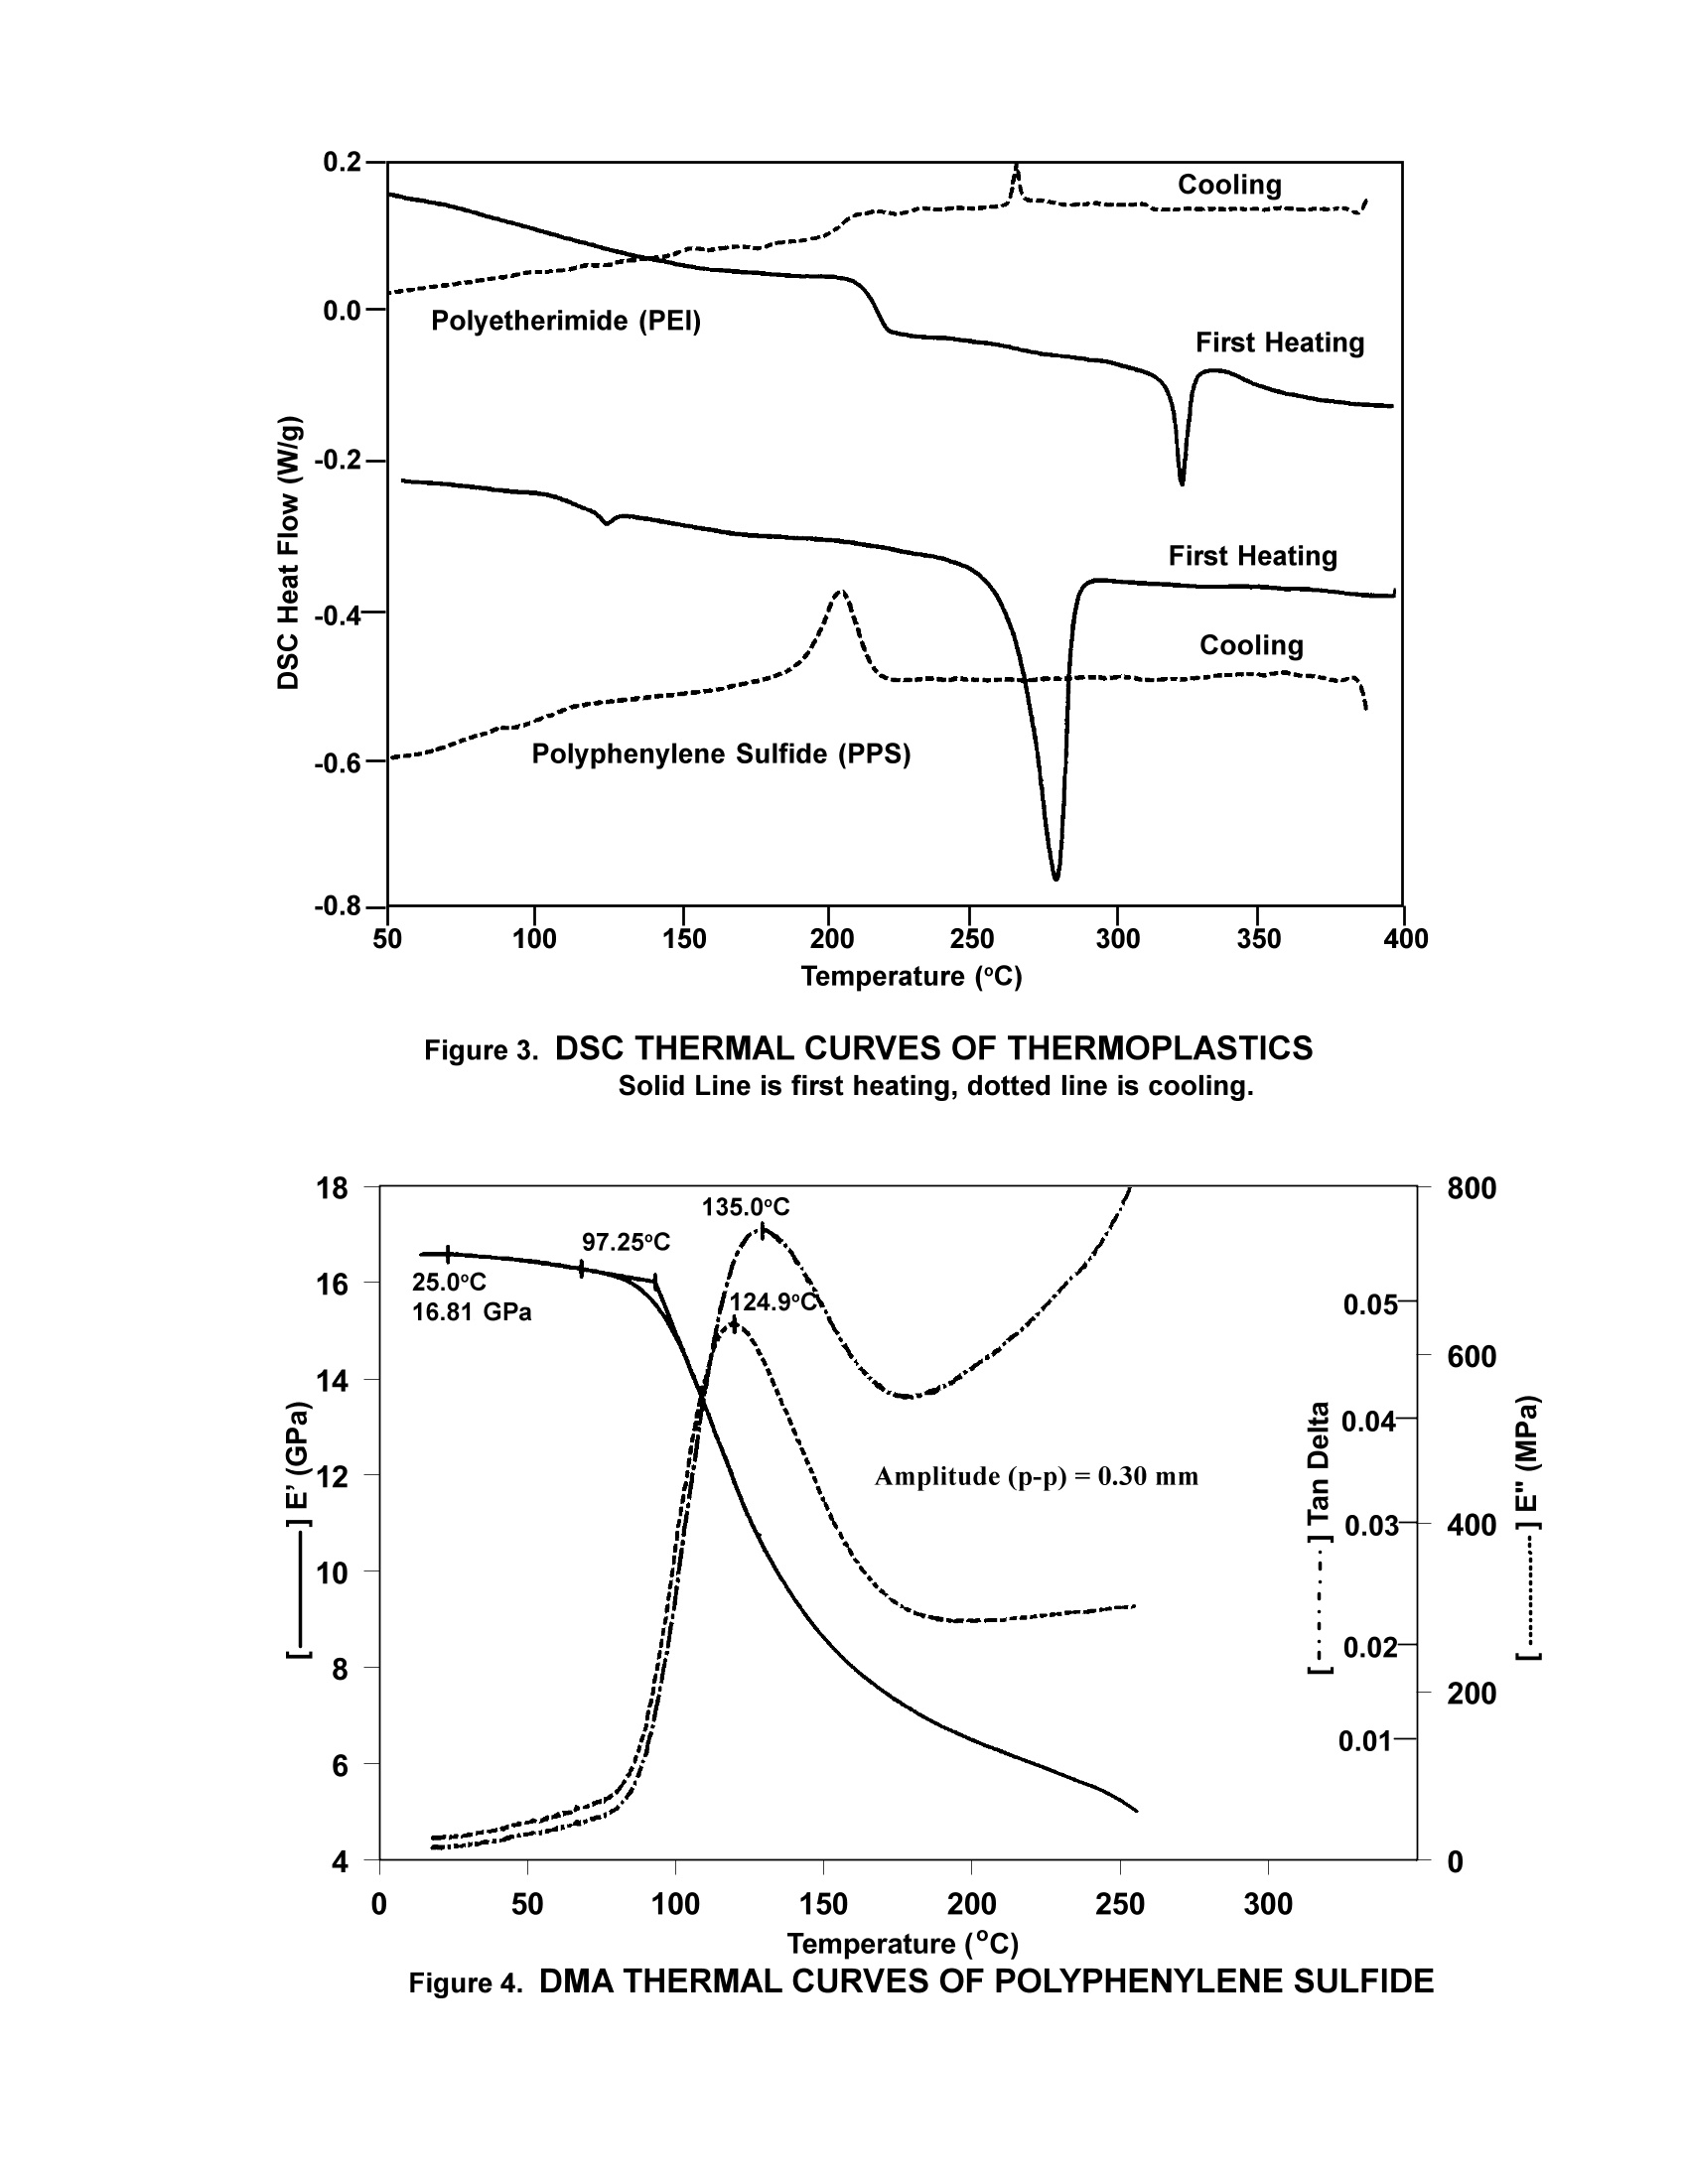
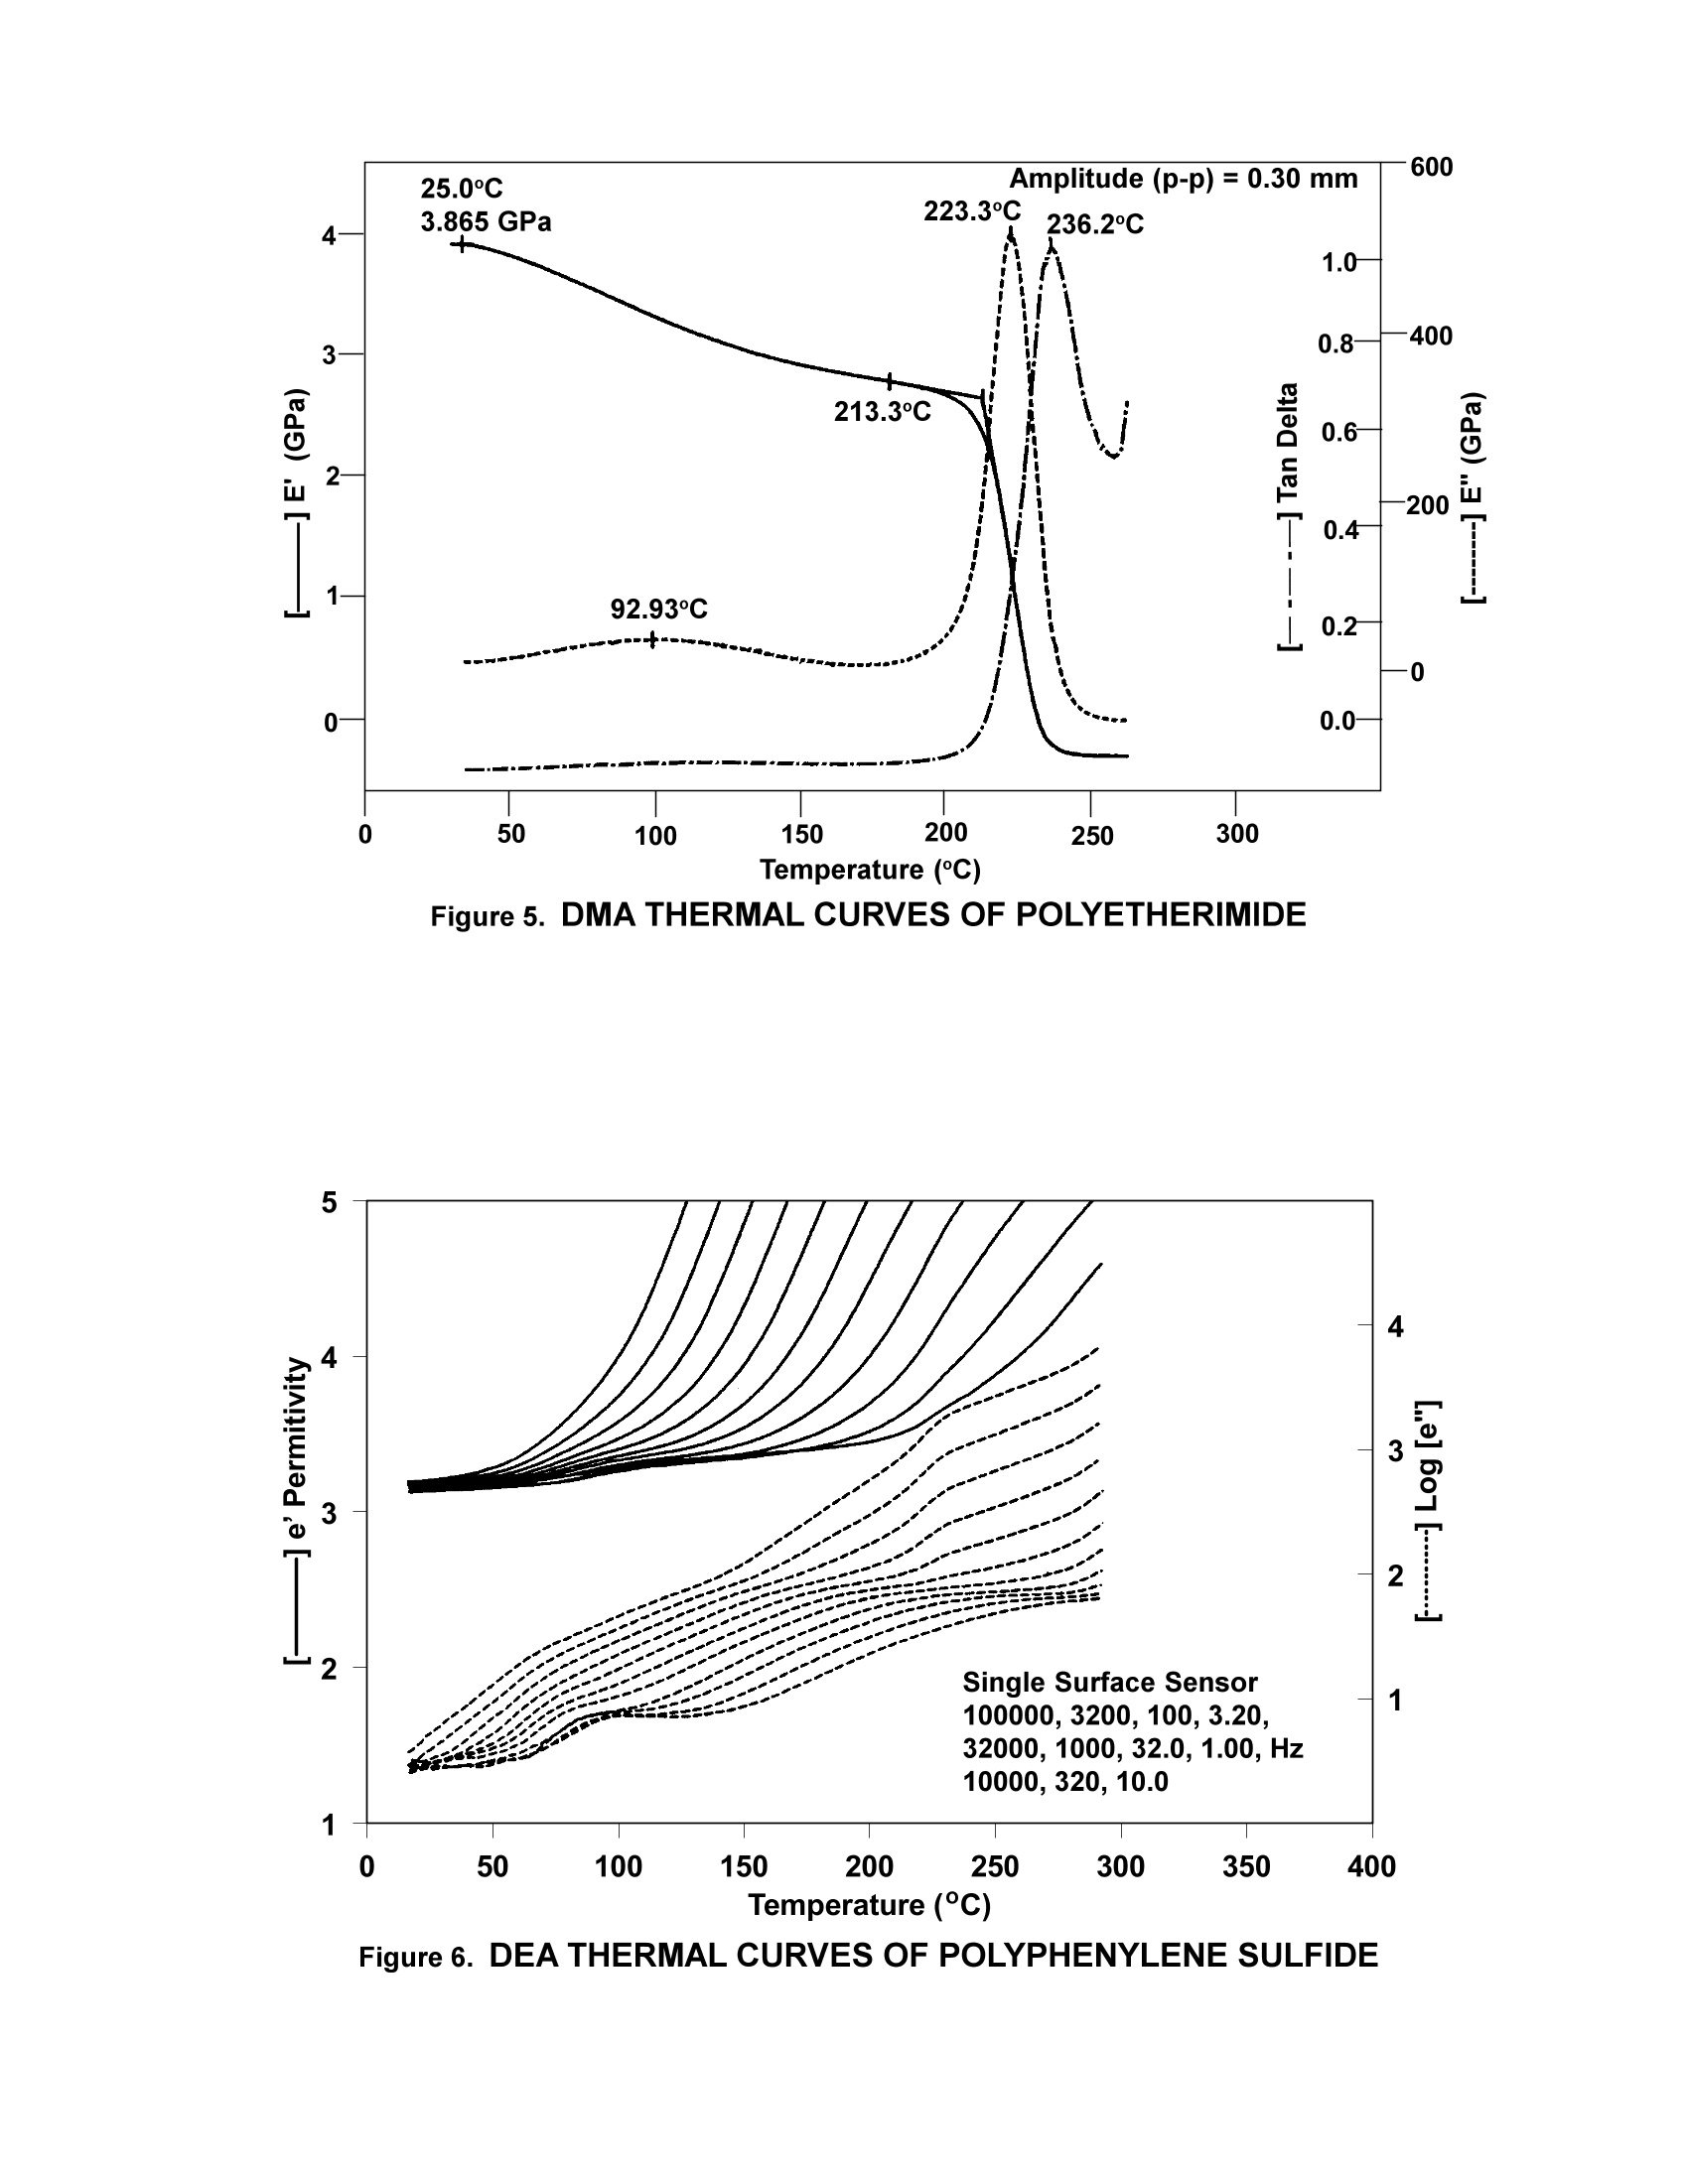
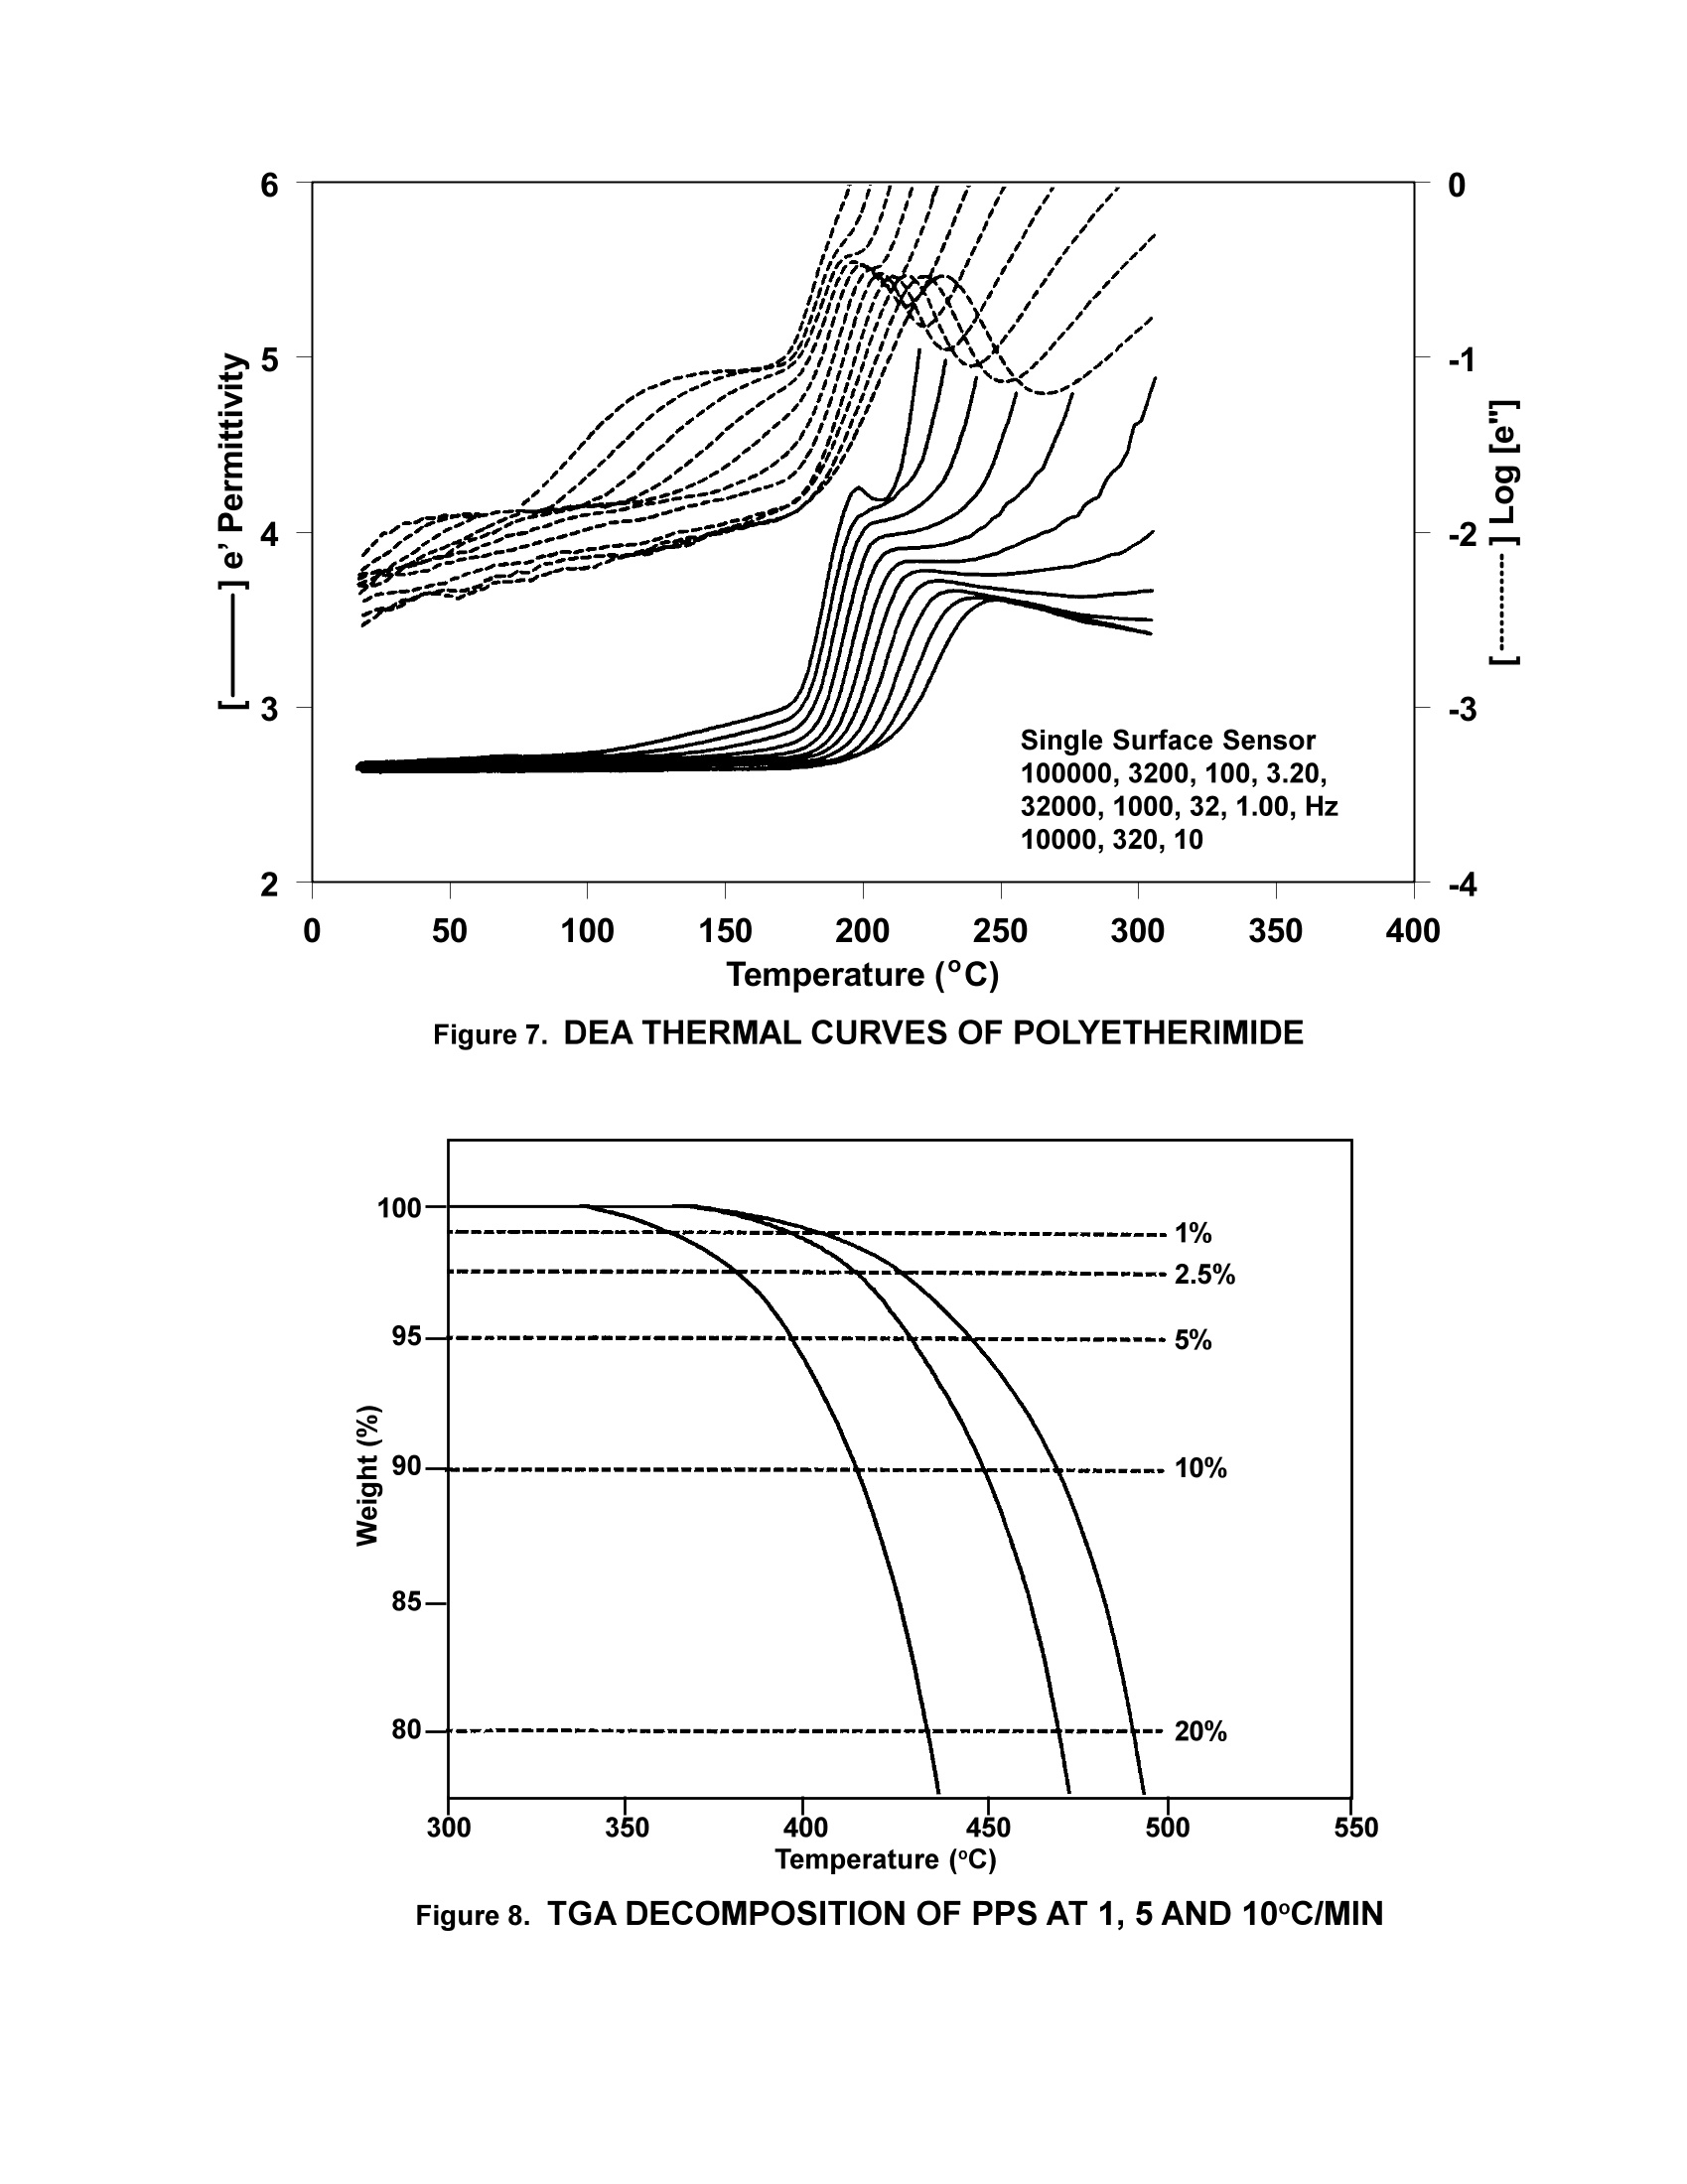
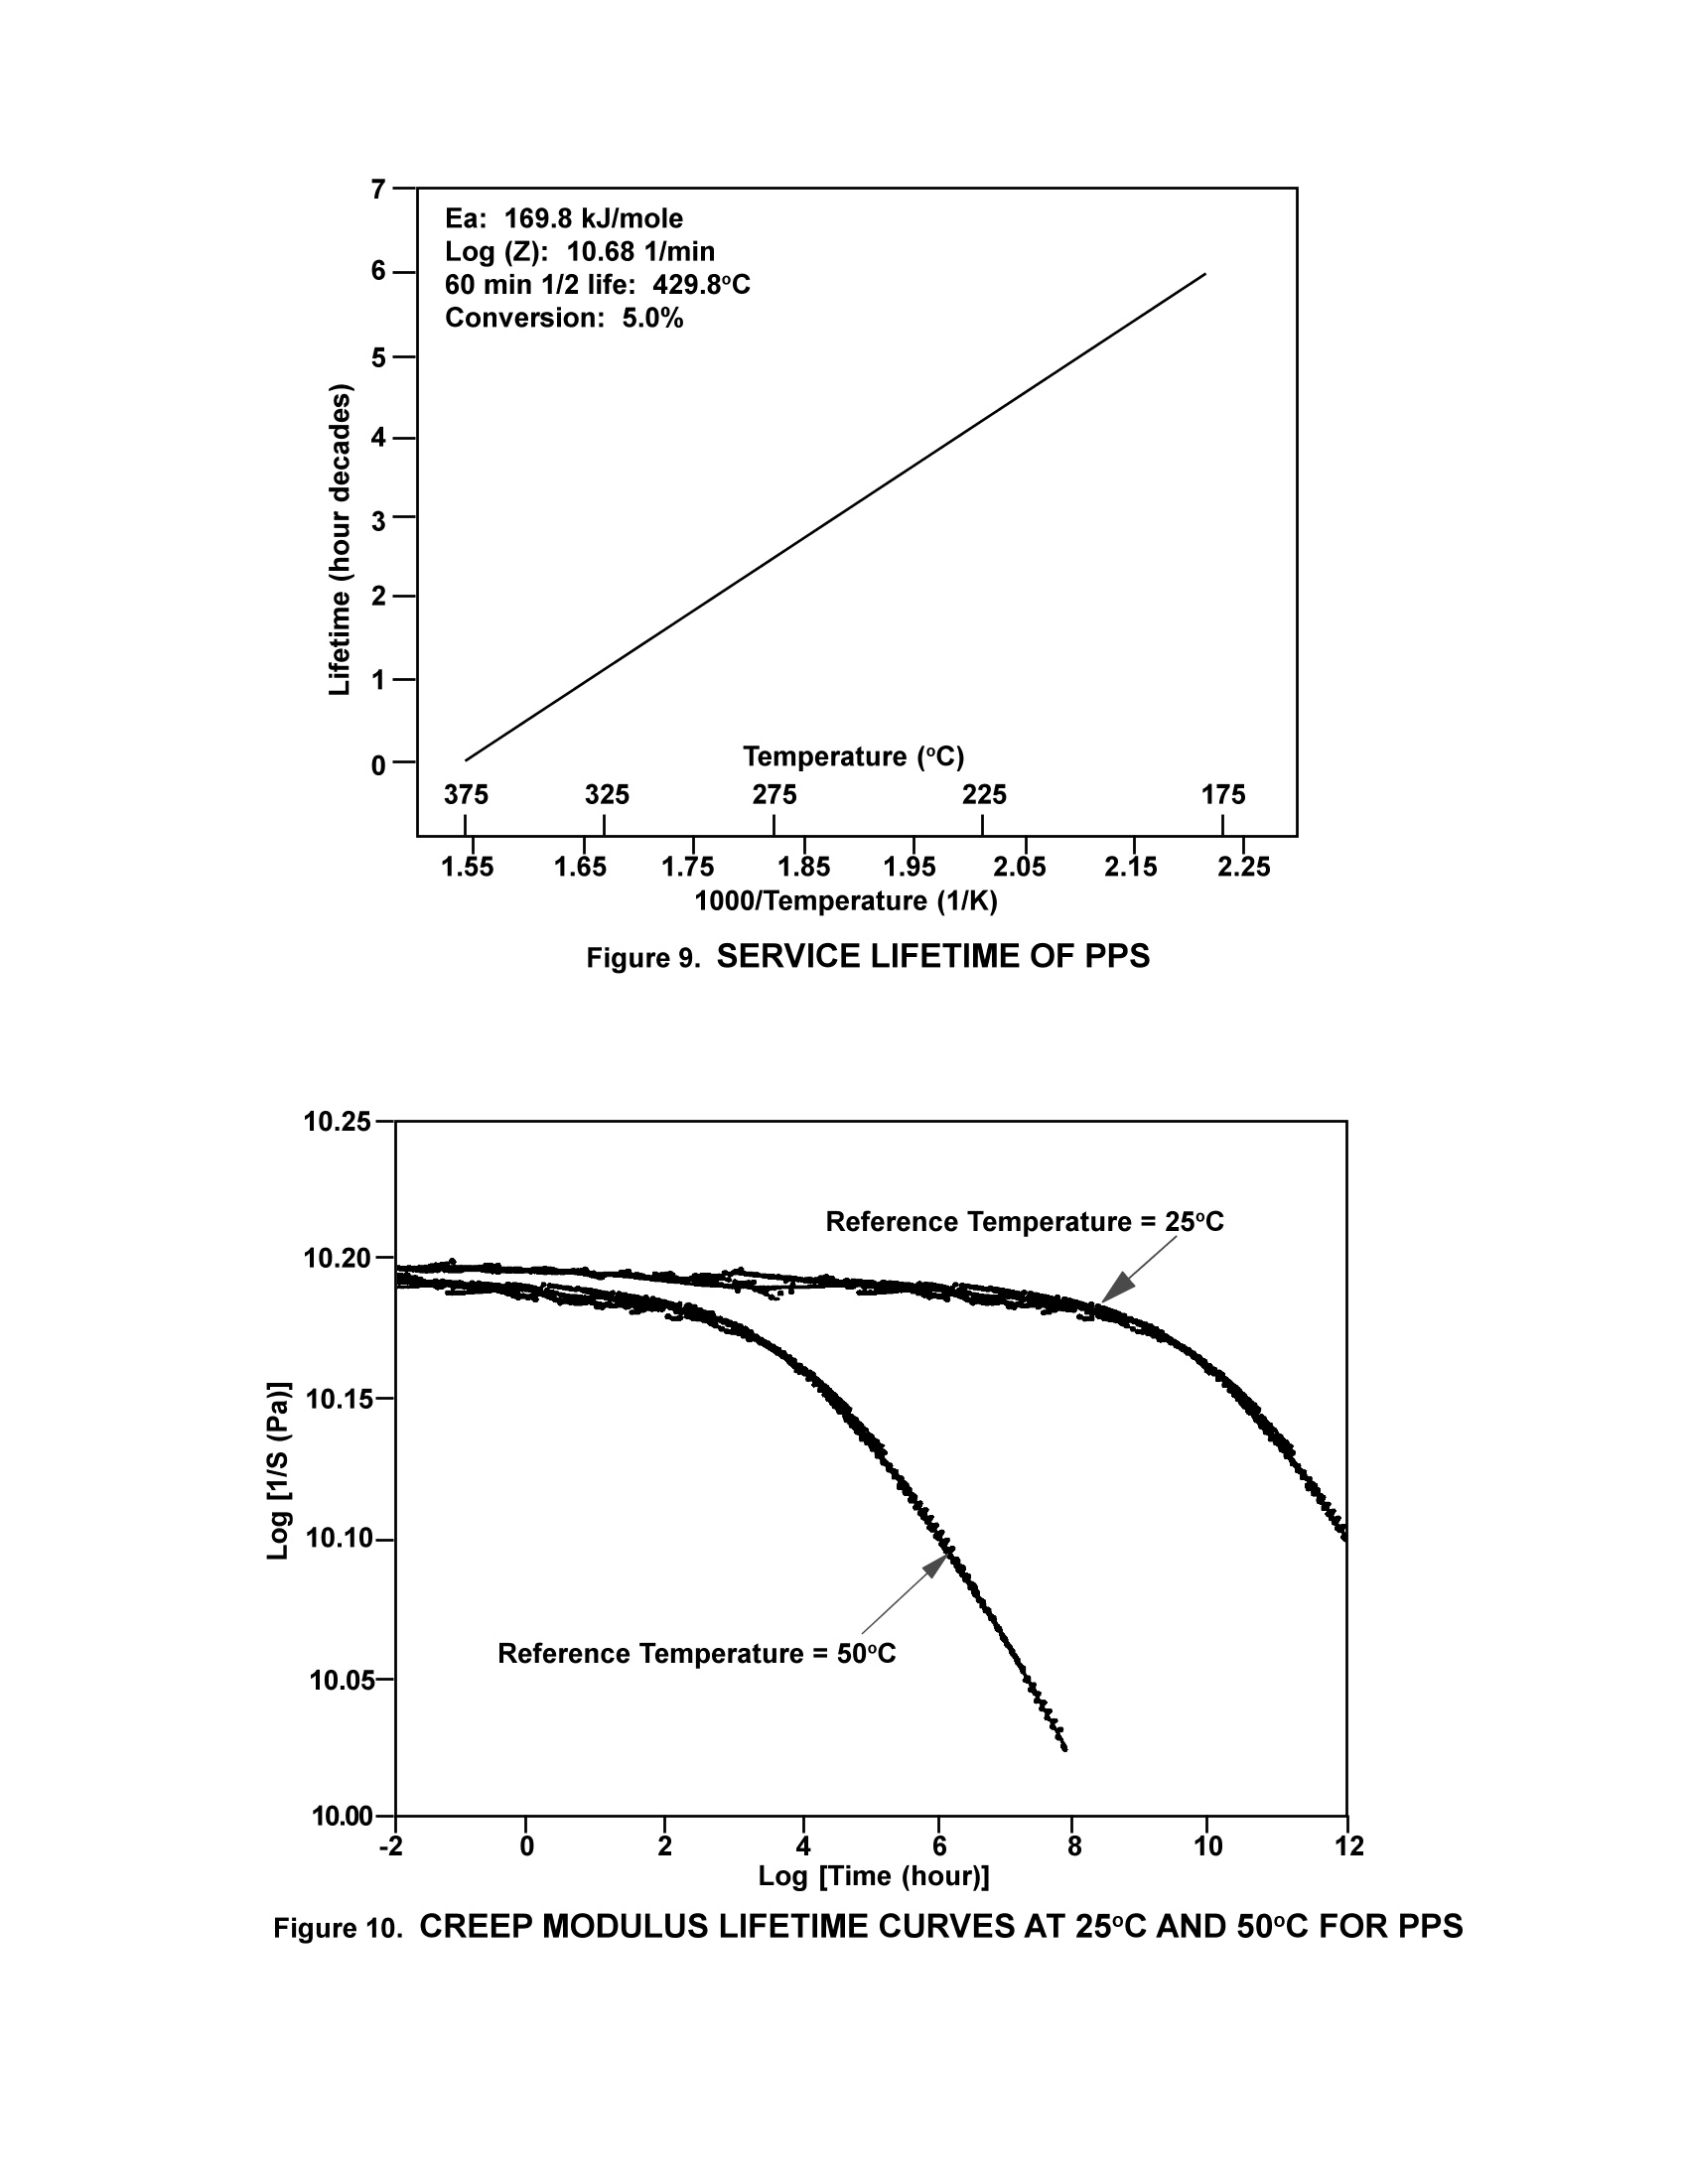
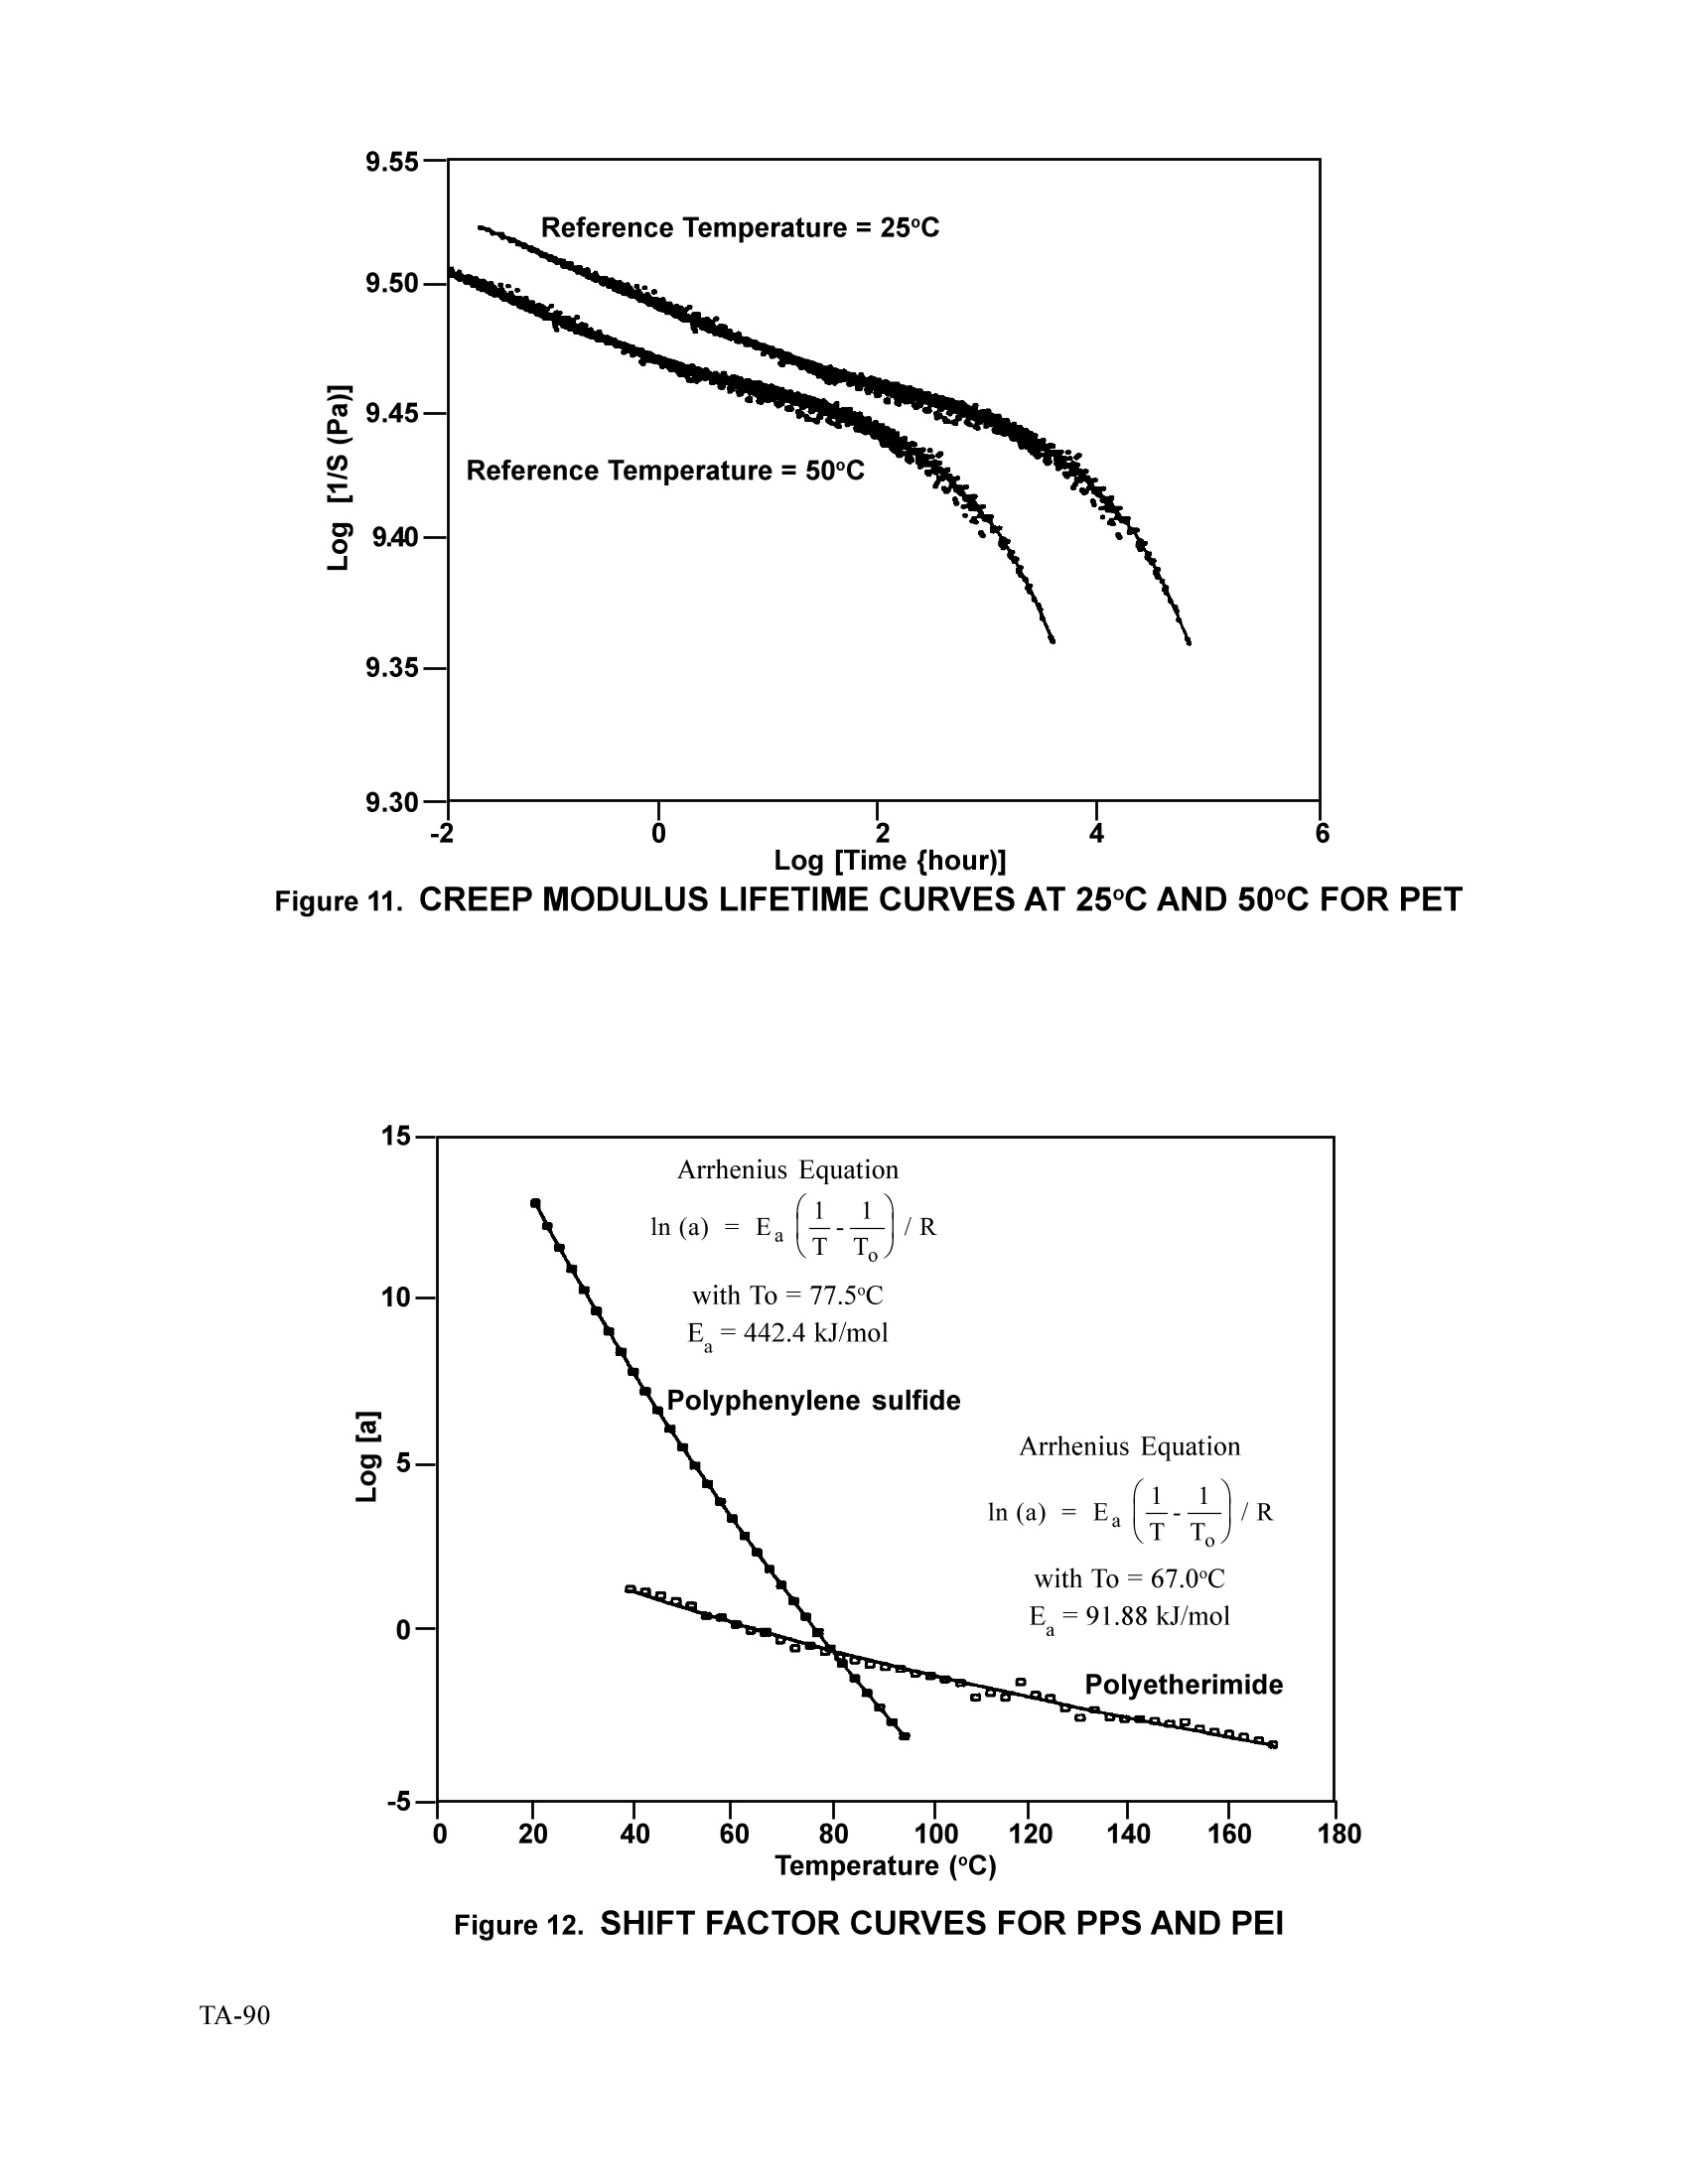
Thermal Analysis & Rheology MEASUREMENT OF THE PHYSICAL PROPERTIES OF ENGINEERING THERMOPLASTICSUSING THERMALANALYSIS J.A. Foreman, C.J. Lundgren, and P.S. Gill INTRODUCTION Thermal Analysis is the generic name for a series of measurement techniques traditionally used to determine changesin material properties with temperature. Common thermal analysis techniques include: Differential Scanning Calorimetry (DSC)- is the most widely used thermal analysis technique. DSC measuresthe heat flow in materials and provides information about phase changes (amorphous and crystalline transi-tions) as well as chemical changes (degradation and reactions). Thermogravimetric Analysis (TGA)-measures weight changes associated with thermal events. While TGAis most commonly used to determine compositional analysis, it is also valuable for determining thermalstability. Furthermore, by analyzing multiple TGA curves obtained under different heating rates, it is possibleto predict long-term as well as short-term thermal stability. Dynamic Mechanical Analysis (DMA)-measures the storage or elastic modulus and the loss or viscousmodulus of materials subjected to sinusoidal or static stresses. Dielectric Analysis (DEA)-is the electrical analog of DMA in which the current (phase and magnitude)resulting from a sinusoidally imposed voltage are measured. Because mechanical and electrical properties arehighly sensitive to small changes in material internal structures, DMA and DEA are more sensitive to lowenergy transitions, such as the glass transitions of filled epoxy systems, than are other thermal analysismethods. The static stress modes of the DMA further allow long term strength forecasts to be made using thecreep or stress relaxation methods at elevated temperatures. In this paper, the short-term and long-term physical properties of two engineering thermoplastics are explored. Theresults illustrate the value of thermal analysis for characterizing thermoplastic materials. THEORY Short term properties are those instantaneous material values measured over short durations of time. Since polymerproperties can change with time, the measurement of properties at one point in time does not ensure that the materialwill behave similarly at a future time. Fortunately, however, predictions of future behavior can often be made byperforming several short term experiments and then analyzing the data using kinetic treatments. This type of predic-tive testing is most common for thermal degradation and mechanical strength. Thermal degradation often follows the Arrhenius kinetics model: Where a is the fraction of weight lost, f(a) is a function of o not dependent on temperature, Z is the pre-exponentialfactor, Ea is the activation energy, R is the universal gas constant, t is time and T is Temperature. At a constant heating rate, do/dt =do/dT*B, where is the heating rate, Flynn and Wall [1] derived that the activationenergy has a small deviation from standard Arrhenius kinetics such that: Where b is an empirically calculated factor (0.457). By plotting the log heating rate against the inverse temperature ofa particular weight loss (typically 5%) for several heating rates, the activation energy can be found from the slope of thebest fit line. (See Figures 1 and 2) An alternative method developed by Toops [2] for determining the estimated lifetime from activation energy measure-ments yields thermal degradation quantities such as 60 minute half-life and time-temperature degradation levels underisothermal conditions. This method is discussed in detail elsewhere [3]. The results of this method have comparedwell to traditional oven aging tests [4]. Prediction of mechanical properties uses the principle of time-temperature superpositioning, which states that theviscoelastic properties of polymers are interdependent on both time and temperature [5] and that there is an equiva-lency between the effects of time and temperature [6]. Thus, data collected at one temperature can be superimposed ondata at a different temperature by shifting one of the curves along the time axis. In this study the viscoelastic functionmeasured is flexural creep,in which bending displacement of a sample under constant load is measured over time. Themeasurement temperature is held constant for each experiment and the creep modulus is measured at several tempera-tures. The degree of time shifting of the creep curves with respect to a reference can be described by several models. Twosuch models are the Williams-Landel-Ferry (WLF) equation [7] and the Arrhenius activation model. In this study, theArrhenius model is used, as it is generally accepted that changes in materials below the glass transition temperaturefollow simple activation kinetics. The Arrhenius relationship is: Where a is the shift factor of each curve, T is the temperature of the shifted curve, and To is the reference temperature.Using this relationship, the creep compliance or modulus can be predicted over several years from data at elevatedtemperatures with results comparable to traditional testing [8]. EXPERIMENTAL The samples for this study were two engineering thermoplastic materials, polyphenylene sulfide (PPS) andpolyetherimide (PEI), molded for ASTM tensile tests ("dogbones" per ASTM D638) or flexure tests (ASTM D790).Samples were cut from these molded bars to sizes appropriate for the particular test as noted. For DSC, 10 mg pieces were crimped into standard aluminum DSC pans. The TA Instruments DSC 2910 with coolinghead assembly and Liquid Nitrogen Cooling Accessory (LNCA) was used to perform DSC heating and cooling experi-ments. Nitrogen purged the DSC cell area at 50 ml/minute. The samples were heated from 0℃ to 400℃ at20°C/minute, cooled to 0℃ at 10℃/minute and reheated at 20℃/minute to 400°C. TGA samples, typically 10 mg pieces were loaded onto pre-tared platinum pans on the Hi-ResTM TGA 2950Autosampler. These samples were heated at rates of 1'C/minute,5℃/minute and 10℃/minute. The "Abort NextSegment" method segment was used to stop each experiment at 25% weight loss to limit the total time ofexperimenta-tion. For the DEA experiments, the thermoplastic materials were pulverized to fine powders in a freezer mill, and thenpressed into the ceramic single surface sensor of the DEA 2970 by applying 350 to 500 N of force while heating to350℃. The dielectric properties were measured during a second heating to 350℃ at 3℃/min. Frequencies of 1 Hz to100 kHz were employed. DMA samples, typically 40 mm long by 12.5 mm wide by 3.1 mm thick, were cut from the ASTM samples and sandedon the faces to remove the mold shrinkage region and to homogenize the thickness dimension. Samples were mountedin the standard vertical clamps (serrated faces) of the DMA 983 and clamping calibrations were performed according tothe method of Reed and Dean [9]. Two series of experiments were performed: fixed frequency temperature scans andelevated temperature creep experiments. In the former, samples were oscillated at 1 Hz with a oscillation amplitude of0.3 mm corresponding to an approximate 0.1% flexural strain. The DMA 983 oscillates with a constant strain ampli-tude. The temperature was ramped at 3℃/minute to 275℃. Creep experiments were performed at stress levels ofapproximately 3 MPa. Experiments were performed at 2.5℃ intervals, starting at 20℃ and ending at 110℃ (PPS) or170°℃ (PEI). At each temperature step, the samples were first held for 20 minutes to ensure thermal and mechanicalequilibration, then stress was applied for 20 minutes and finally creep recovery was followed for 20 minutes. RESULTS AND DISCUSSION SHORT TERM PROPERTIES The results of the DSC,DMA fixed frequency, and DEA experiments can be seen in Figures 3 to 7. In thermoplastics,the characteristics most important to processing and end-use are the temperature and enthalpy associated with thecrystalline melt and/or the glass transition temperature. As can be seen in these thermal curves, the DSC is moresensitive to melting and crystallization, while DEA and DMA are more sensitive to the glass transition. Key quantita-tive results from the curves are summarized in Table 1. In addition to the transitions listed in Table 1, a noticeable B transition occurs in the PEI material in the vicinity of 95to125℃ as can be seen in the DMA and DEA loss curves (Figures 3 to 6). Table 1 -Material Properties LONG-TERM THERMAL STABILITY The TGA thermal degradation curve (early stages of decomposition) for PPS is shown in Figure 8. Using the Flynnand Wall evaluation, the service life curve (Figure 9) can be obtained, as well as the decomposition activation energy(Ea) and the 60 minute half life. The activation energy is used as an indicator of relative material stability (a higher Eaindicates a more stable material). The 60 minute half life is the temperature at which half the material degrades within60 minutes. The service life curve depends on the condition chosen, but in this case it is the time required for 5% ofthe material to degrade at a specific temperature. Table 2 compares these parameters for PPS and PEI. Table 2-TGA Service Life LONG TERM MECHANICAL PROPERTIES Figures 10 and 11 show the flexural creep curves for PPS and PEI respectively resulting from Time-Temperaturesuperposition evaluation of the raw DMA data. These curves are plotted as log creep modules (1/s) versus log time.25℃ and 50℃ are the end-use temperatures chosen for comparison. Figure 12 shows the shift factor curves which helpexplain the kinetics of the creep behavior observed. Key values are highlighted in Table 3. Table 3- Creep Modulus Values PPS PEI Modulus,25℃,1 hour 15.7 GPa 3.08 GPa I year 15.4 GPa 2.88 GPa 30 years* 15.4 GPa 2.30 GPa Modulus,50°℃, 1 hour 15.4 GPa 2.94 GPa l year* 14.4 GPa 2.3 GPa 30 years 13.2 GPa *-to maximum time predictable with experimental conditions. CONCLUSIONS The most important differences between PPS and PEI are the composition and relative crystallinity, which control thephysical and chemical properties of the polymers. These significant differences can be exploited in end-use applica-tions. PPS has a relatively low glass transition temperature. However a significant portion of this compound is crystalline, ascan be seen by the relative sizes of the glass transition and melting peak in DSC. This accounts for its high modulusand low creep. The processing temperature is in the 300℃ range, slightly above the crystalline melting at 280℃. The PEI has a much higher fraction of amorphous phase as reflected in a low heat of fusion and strong glass transition.However, the Tg is quite high, which indicates a high stability material. This material could be processed eitheraround 250-275℃ or above 350℃, depending on the viscosities of the material in these ranges. The DEA ionicconductivity of PEI (not shown) is approximately 1000 times greater at 350℃ than at 250℃. Since viscosity isinversely proportional to conductivity, the material should flow much more readily at 350℃, though the absoluteviscosity at lower temperatures may still be suitable for certain processing situations. Service temperature and material lifetime are functions of composition and crystallinity. A material's maximum servicetemperature is described by three functions: the modulus of the material, the temperature and rate of thermal degrada-tion, and the long term creep properties. PPS has high strength up to 225℃. The modulus decreases over that tem-perature range from 16 GPa to 6 GPa, which is still quite strong. Furthermore, the decay of creep modulus at 50℃over 30 years is less than 15%, which also indicates good retention of strength. Further creep or stress relaxationstudies at higher temperatures are warranted. The maximum service temperature based on a 5% material loss over 30years is also in the 200℃ range. Thus, the thermal stability of the PPS is quite good, and a high service temperaturecan be expected, assuming high chemical resistance. The temperature range of PEI may be somewhat more limited. Although the glass transition is higher, the materialstrength drops to a small fraction of its room temperature value at the glass transition. Thus, although PEI has muchbetter resistance to thermal degradation than does the PPS, the maximum temperature may be limited to well below200°C. The creep behavior of PEI at low temperatures is dominated by the B transition at ca. 100°℃ rather than the glasstransition. The low activation energy of this transition results in high stability at lower temperatures, such that PEI haslow creep motion with almost no change in behavior (creep % and strength) until well above 100C. Closer to the glasstransition, however, the behavior does begin to change and the material begins to creep significantly. Hence, asexpected, Figure 11 shows modest changes in creep behavior at the temperature used in this study. REFERENCES 1. J.H. Flynn and L.A. Wall, Polym. Lett., B4, 323 (1966) 2. D.J. Toop, IEEE Trans., Elec. Inst.,EI-6,2(1971) 3. TA Instruments, Applications Brief TA-125. 4. L. Krizanovsky et al., J. Thermal Anal., 13,571 (1978) 5. T. Murayama, Dynamic Mechanical Analysis of Polymeric Materials, Elsevier, N.Y. (1978) 6. A.V. Tobolsky, Properties and Structures of Polymers, Wiley, N.Y. (1960) 7.J.D. Ferry, Viscoelastic Properties of Polymers, 3rd ed., Wiley, N.Y. (1980) 8. M.P. Sepe, Material Selection for Elevated Temperature Applications: An Alternative to DTUL,TA Instruments Publication TA-033. 9.B.E. Read and G.E. Dean, The Determination of Dynamic Properties ofPolymers and Composites, Wiley, N.Y. (1978) O工 Figure 1. WIRE INSULATION THERMAL STABILITY TEMPERATURE (C) Figure 2. LOG HEATING RATE VS. TEMPERATURE OF CONSTANT CONVERSION(WIRE INSULATION) Figure3. DSC THERMAL CURVES OF THERMOPLASTICSSolid Line is first heating, dotted line is cooling. Figure 4. DMA THERMAL CURVES OF POLYPHENYLENE SULFIDE Figure 5. DMA THERMAL CURVES OF POLYETHERIMIDE Figure 6. DEA THERMAL CURVES OF POLYPHENYLENE SULFIDE Figure 7. DEA THERMAL CURVES OF POLYETHERIMIDE Figure 8. TGA DECOMPOSITION OF PPS AT 1, 5 AND 10°C/MIN Figure 9. SERVICE LIFETIME OF PPS Figure 10. CREEP MODULUS LIFETIME CURVES AT 25°C AND 50C FOR PPS Figure 11. CREEP MODULUS LIFETIME CURVES AT 25°C AND 50C FOR PET Figure 12. SHIFT FACTOR CURVES FOR PPS AND PEI TA- Thermal Analysis is the generic name for a series of measurement techniques traditionally used to determine changes in material properties with temperature. Common thermal analysis techniques include:- Differential Scanning Calorimetry (DSC) - is the most widely used thermal analysis technique. DSC measures the heat flow in materials and provides information about phase changes (amorphous and crystalline transitions) as well as chemical changes (degradation and reactions).- Thermogravimetric Analysis (TGA) - measures weight changes associated with thermal events. While TGA is most commonly used to determine compositional analysis, it is also valuable for determining thermal stability. Furthermore, by analyzing multiple TGA curves obtained under different heating rates, it is possible to predict long-term as well as short-term thermal stability.- Dynamic Mechanical Analysis (DMA) - measures the storage or elastic modulus and the loss or viscous modulus of materials subjected to sinusoidal or static stresses.- Dielectric Analysis (DEA) - is the electrical analog of DMA in which the current (phase and magnitude) resulting from a sinusoidally imposed voltage are measured. Because mechanical and electrical properties are highly sensitive to small changes in material internal structures, DMA and DEA are more sensitive to low energy transitions, such as the glass transitions of filled epoxy systems, than are other thermal analysis methods. The static stress modes of the DMA further allow long term strength forecasts to be made using the creep or stress relaxation methods at elevated temperatures.In this paper, the short-term and long-term physical properties of two engineering thermoplastics are explored. The results illustrate the value of thermal analysis for characterizing thermoplastic materials.
确定

还剩10页未读,是否继续阅读?

产品配置单

TA仪器为您提供《热塑性材料中物理性质分析检测方案(差示扫描量热)》,该方案主要用于其他中物理性质分析检测,参考标准--,《热塑性材料中物理性质分析检测方案(差示扫描量热)》用到的仪器有TA仪器 Discovery差示扫描量热仪
相关方案
更多
该厂商其他方案
更多