


方案详情
文
采用LaVision的图像采集和处理软件平台以及LDY300型双脉冲PIV激光器,ImagerProSX 5M 型双帧双爆光相机,构成一套粒子成像测速系统(PIV) ,并利用该系统对轴流式血泵在三种工况下流场特性进行了实验研究
方案详情

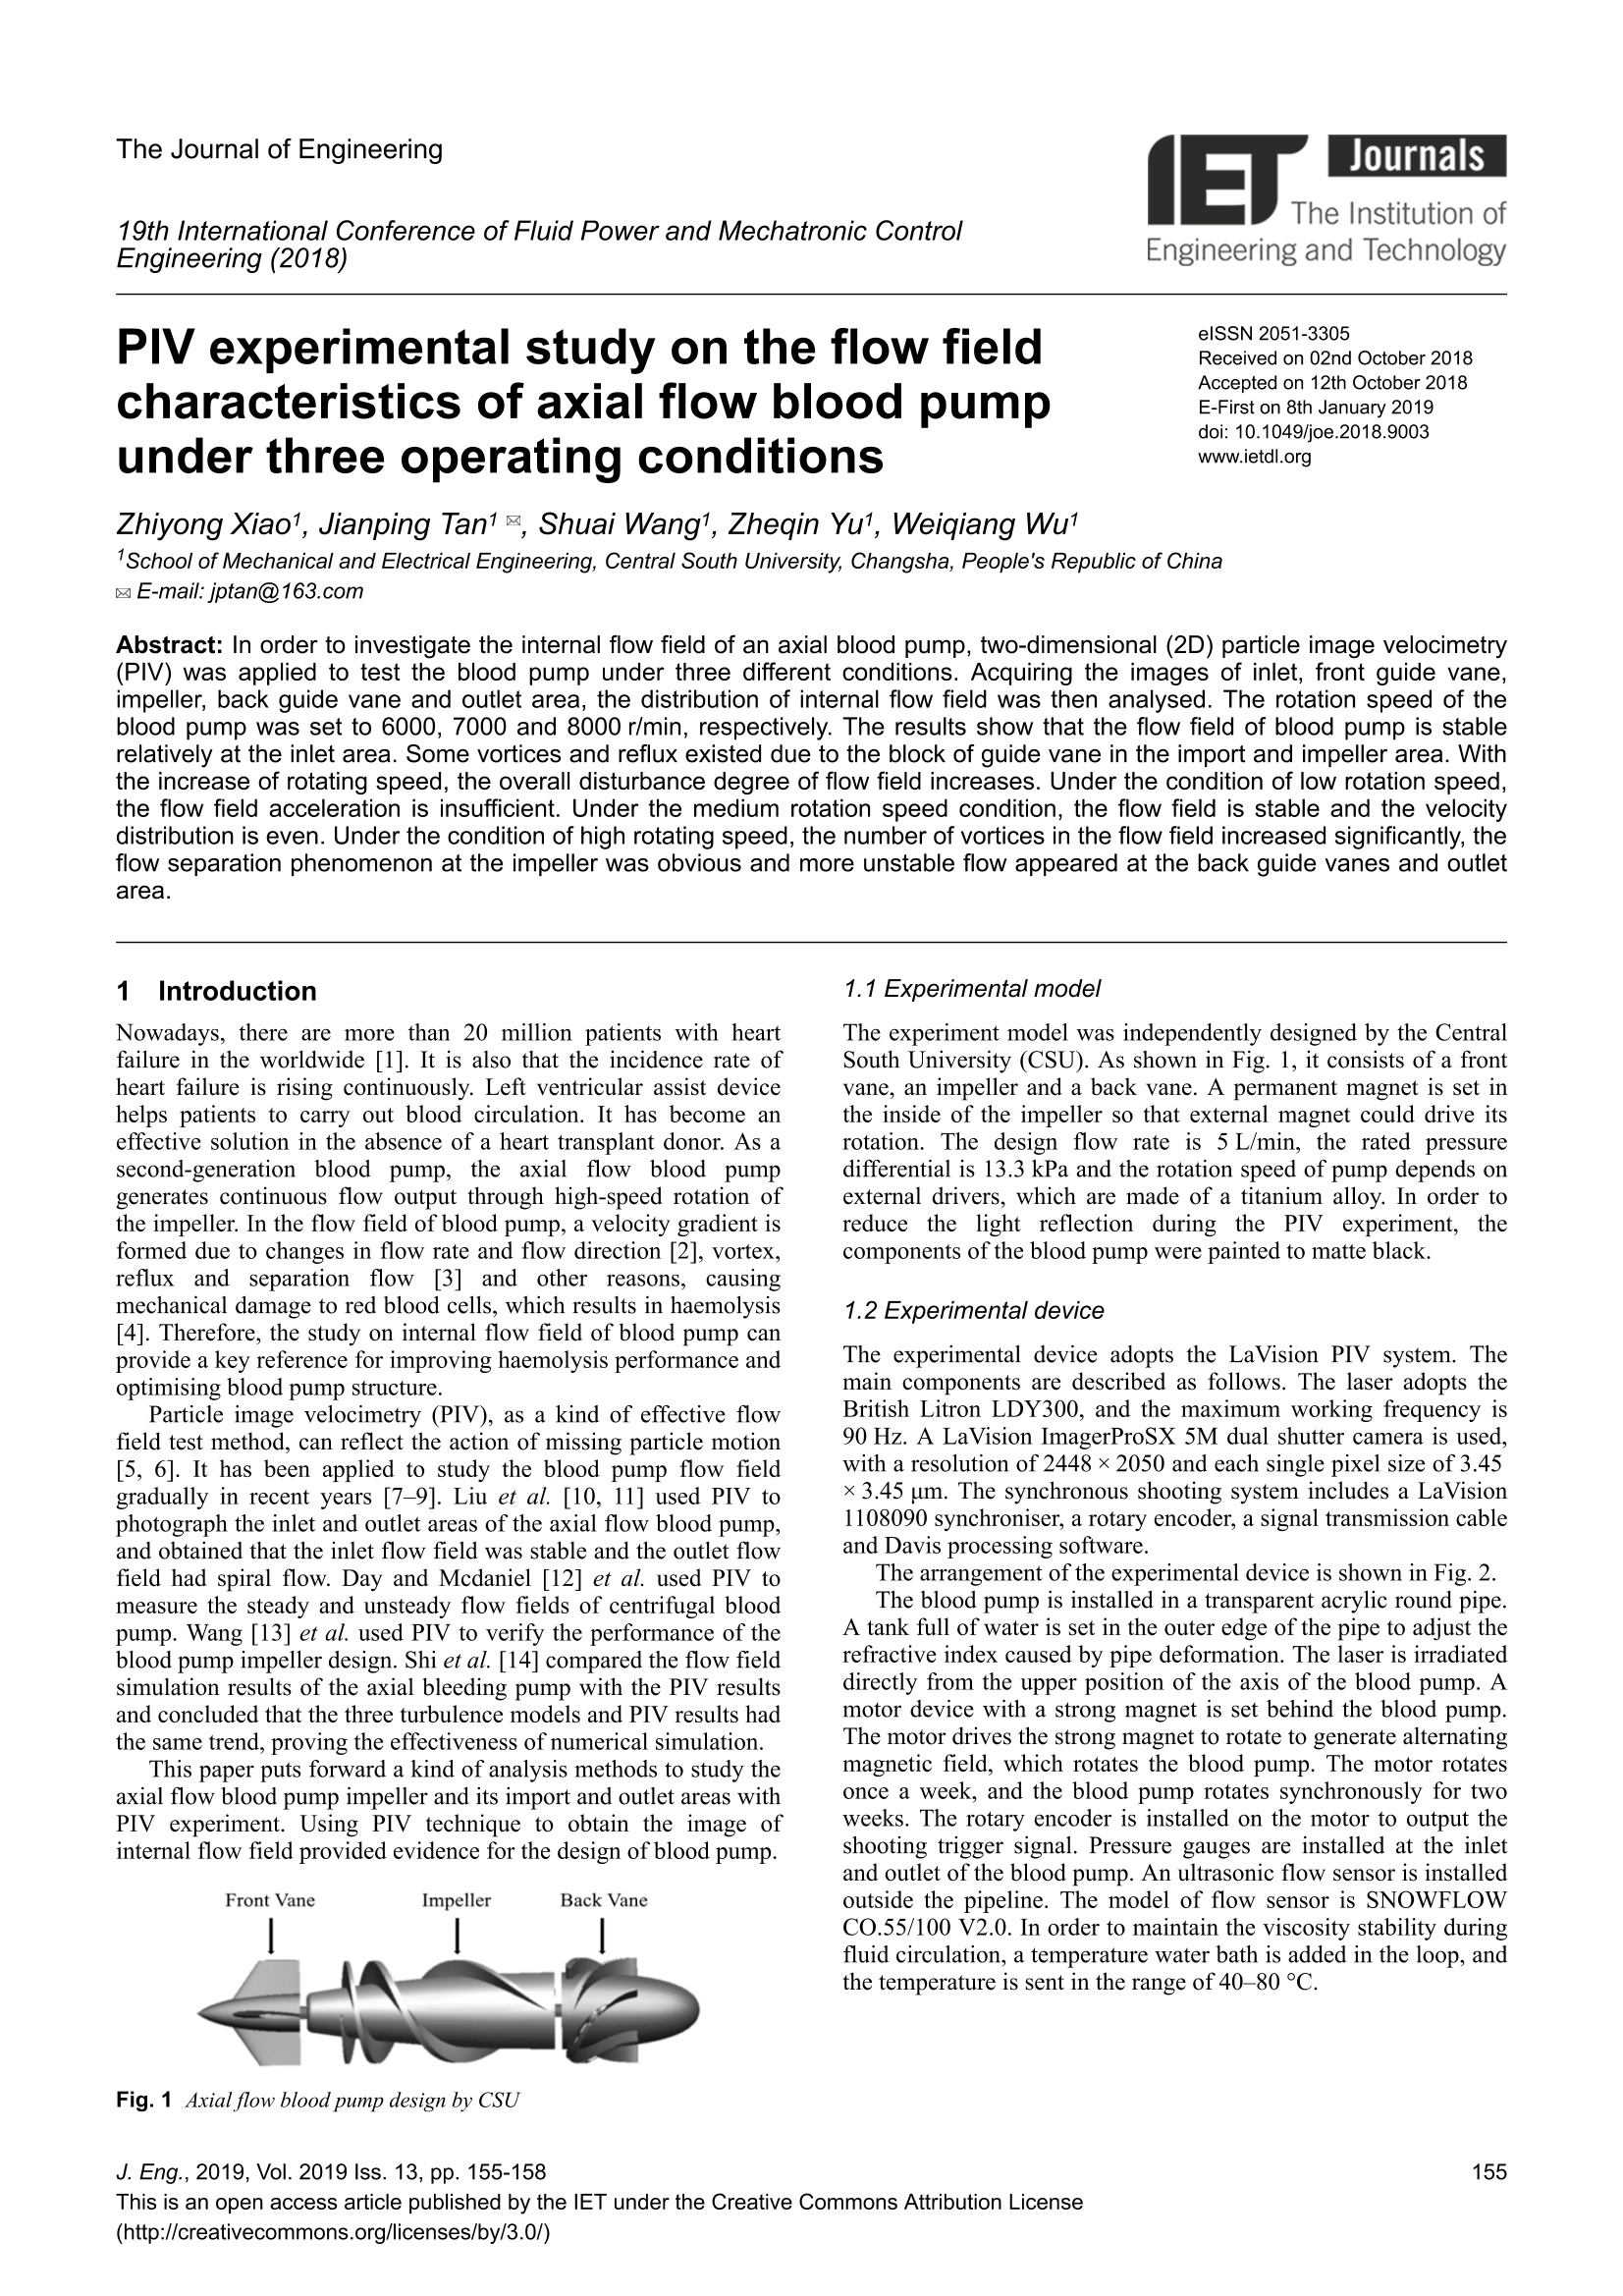
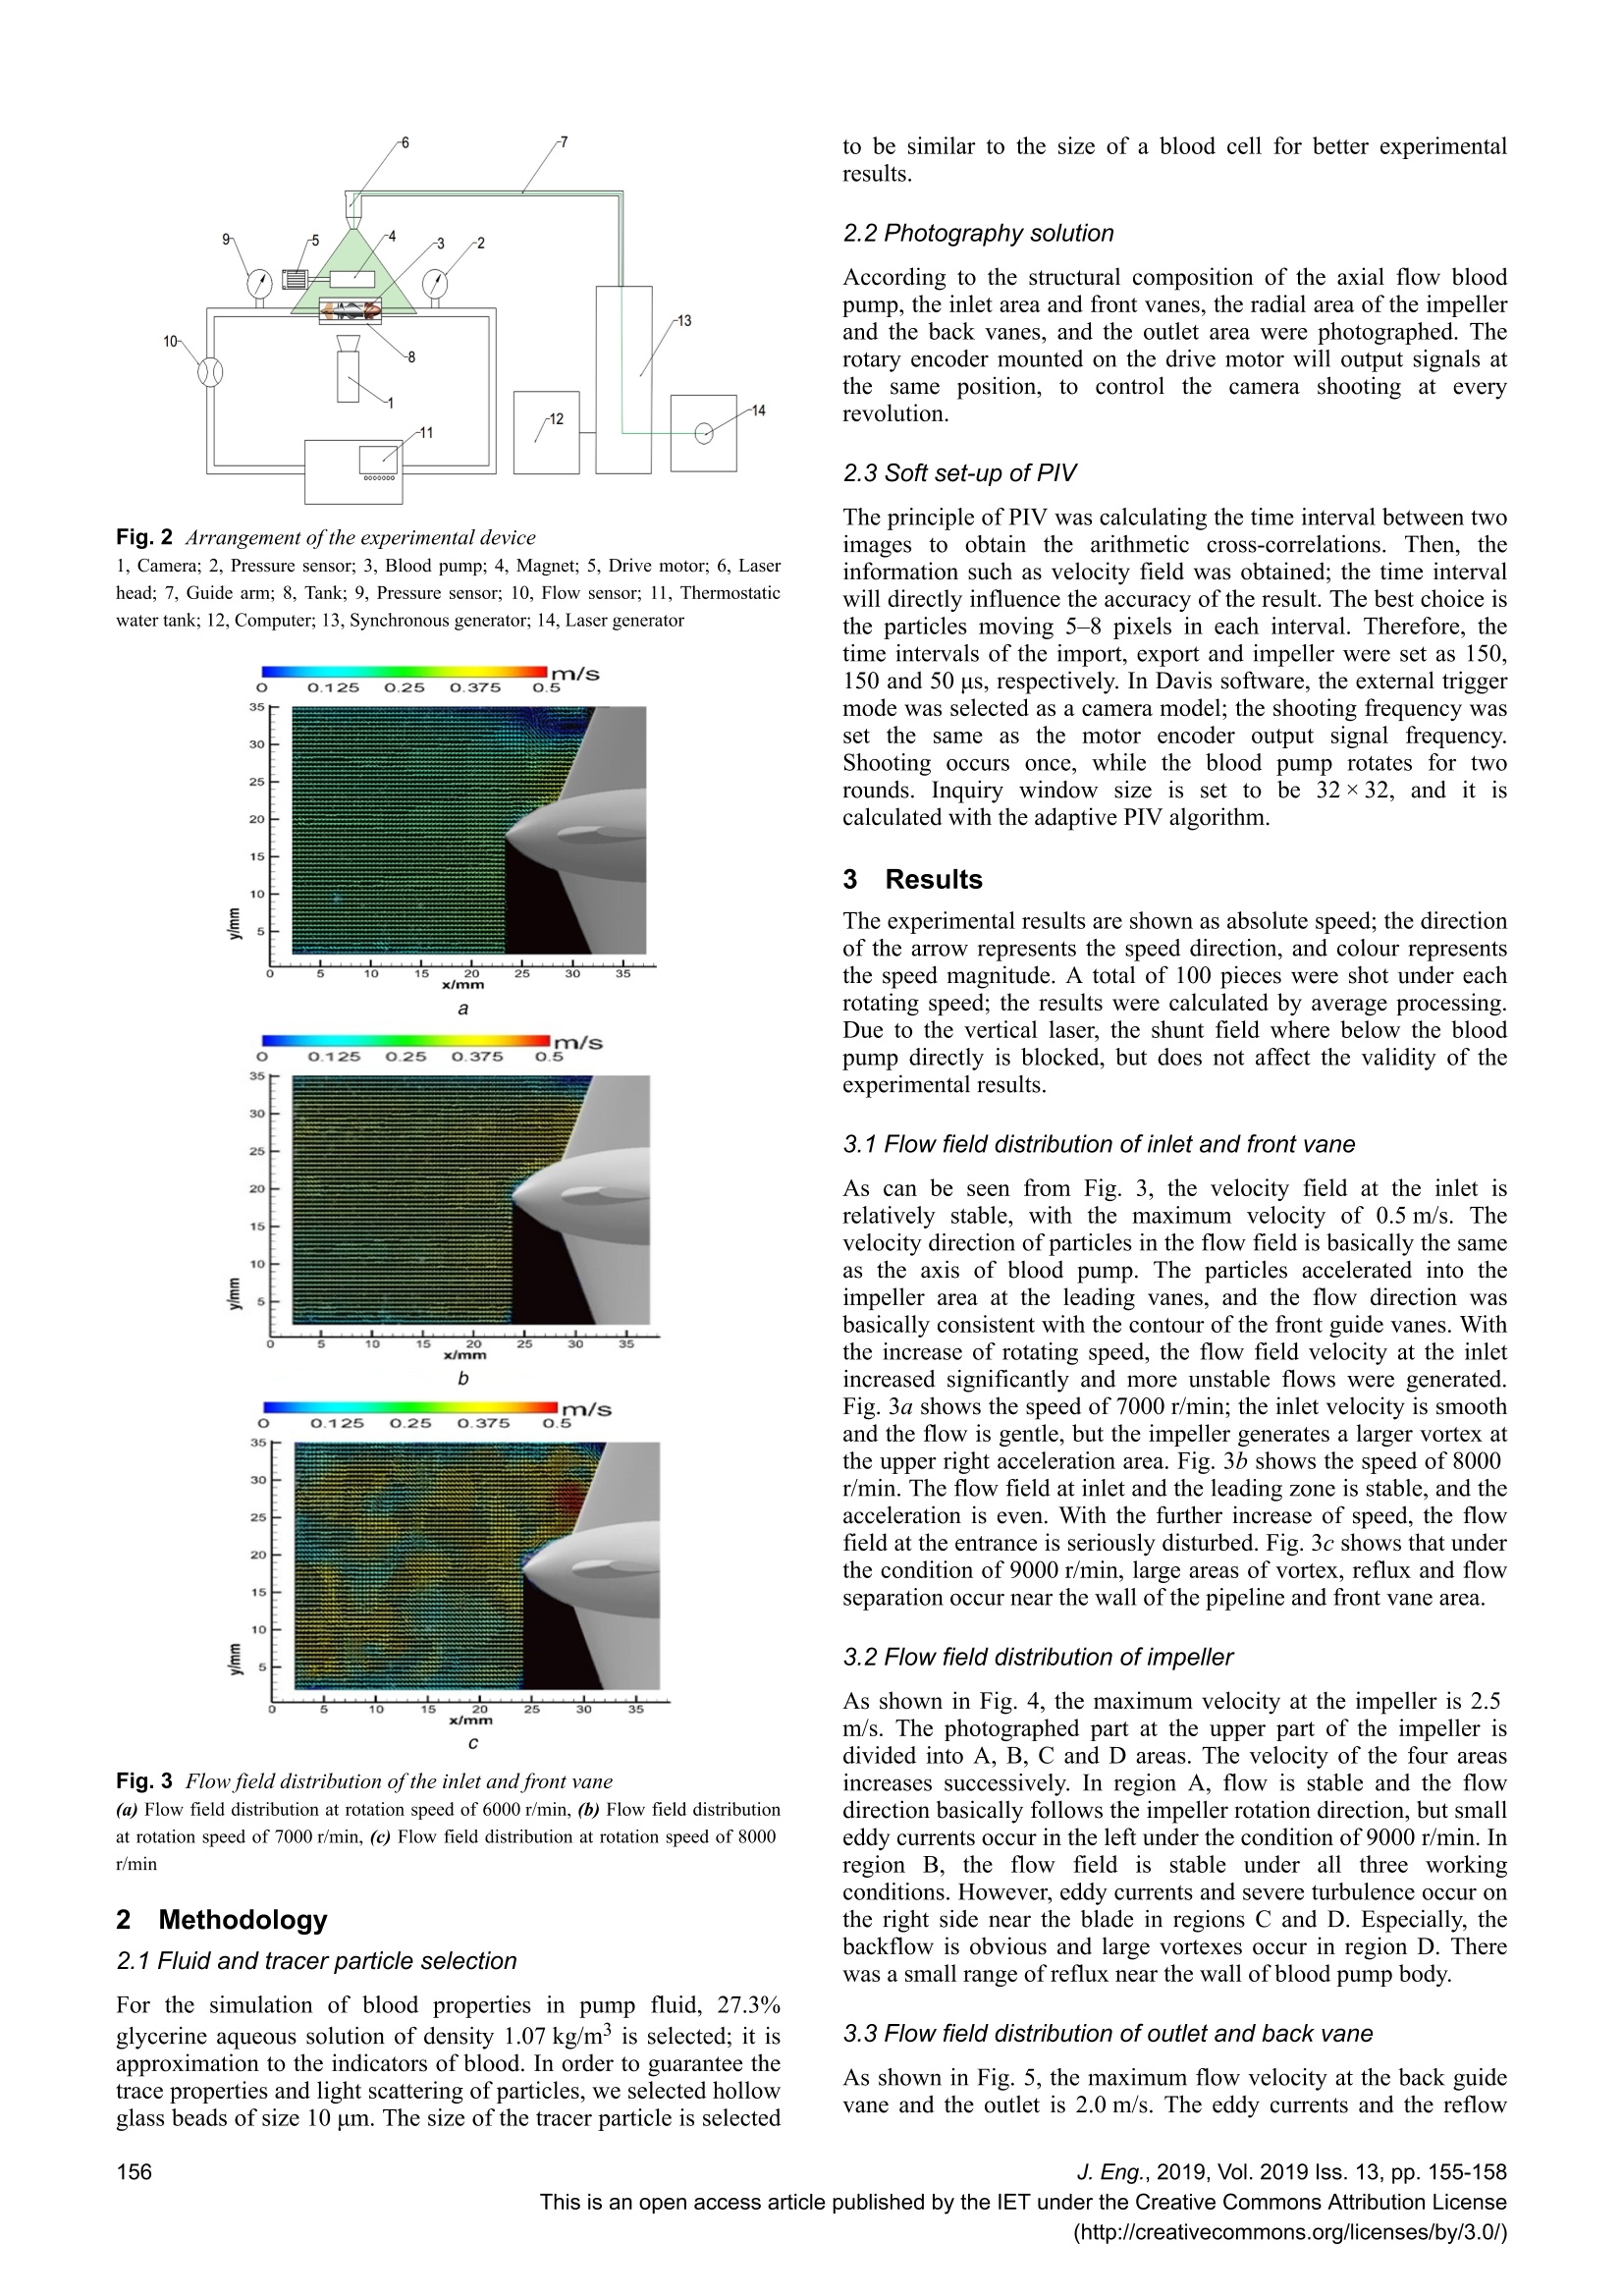
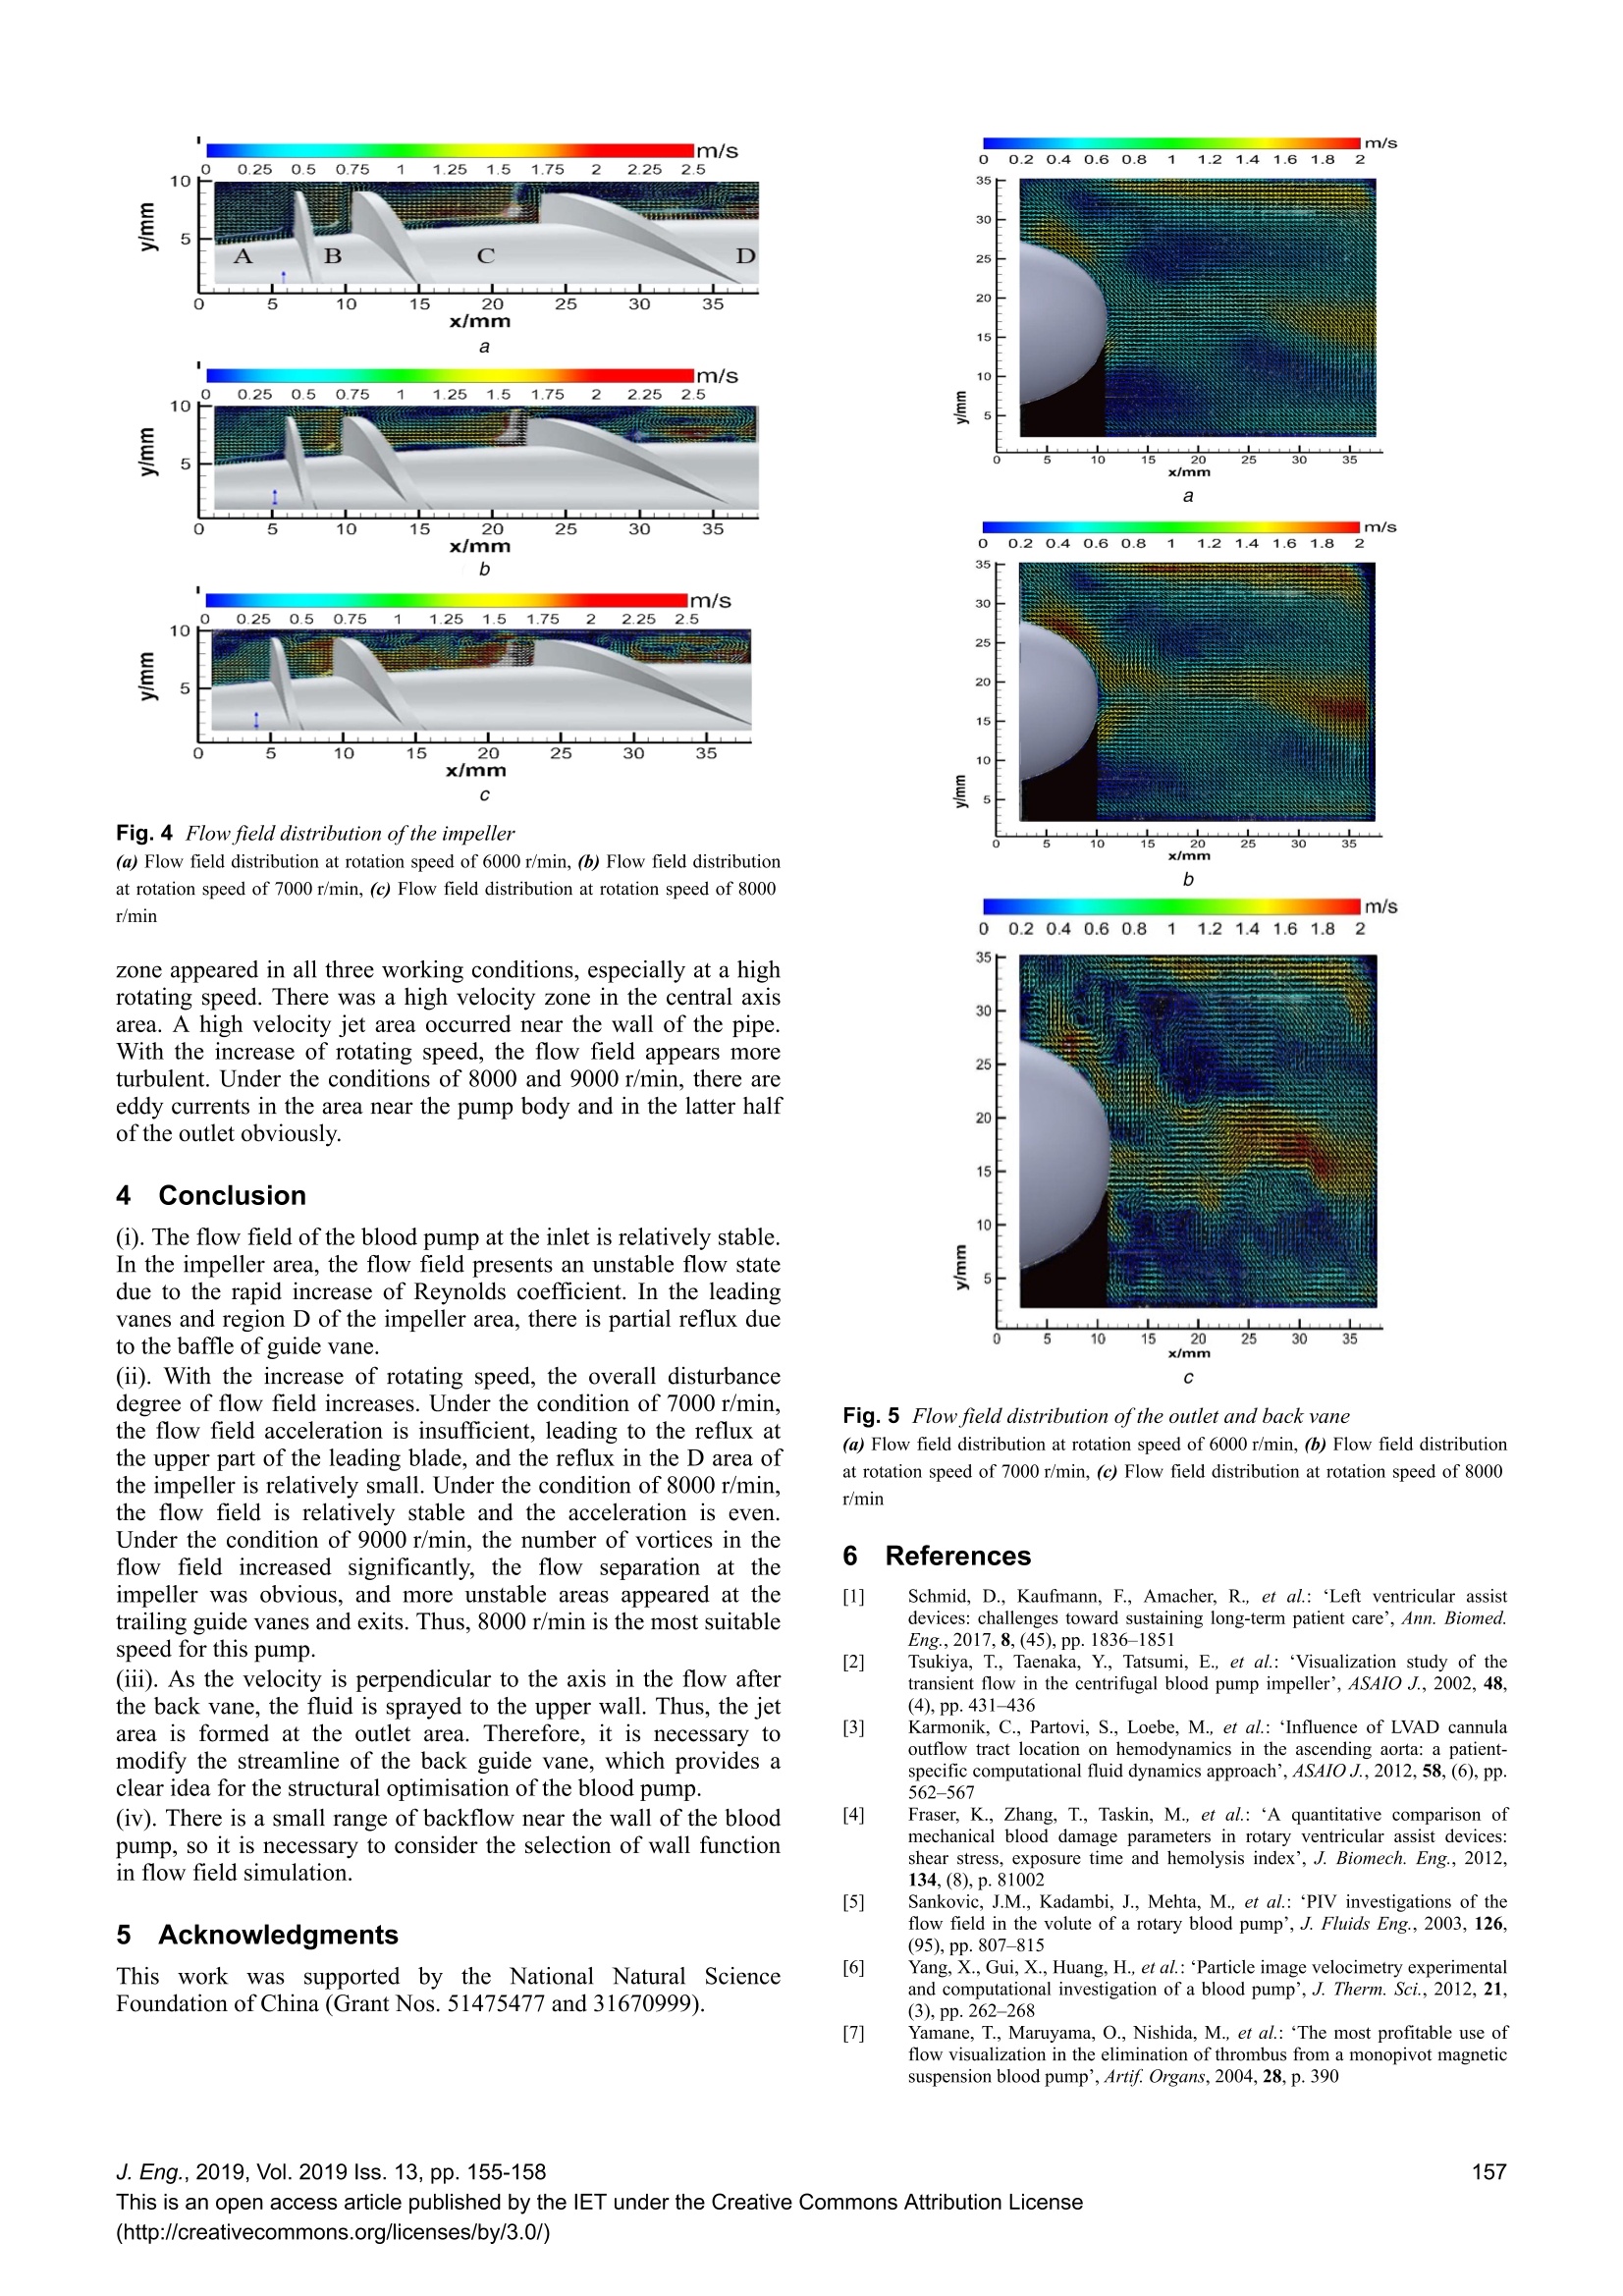
JournalsThe Institution ofThe Journal of Engineering19th International Conference of Fluid Power and Mechatronic Contro/Engineering (2018)Engineering and Technology PlV experimental study on the flow fieldcharacteristics of axial flow blood pumpunder three operating conditions elSSN 2051-3305 Received on 02nd October 2018Accepted on 12th October 2018E-First on 8th January 2019 doi: 10.1049/joe.2018.9003 www.ietdl.org Zhiyong Xiao1, Jianping Tan1区, Shuai Wang1, Zheqin Yu1, Weiqiang Wu1 School of Mechanical and Electrical Engineering, Central South University, Changsha, People’s Republic of China 区E-mail:jptan@163.com Abstract: In order to investigate the internal flow field of an axial blood pump, two-dimensional (2D) particle image velocimetry(PIV) was applied to test the blood pump under three different conditions. Acquiring the images of inlet, front guide vane,impeller, back guide vane and outlet area, the distribution of internal flow field was then analysed. The rotation speed of theblood pump was set to 6000, 7000 and 8000 r/min, respectively. The results show that the flow field of blood pump is stablerelatively at the inlet area. Some vortices and reflux existed due to the block of guide vane in the import and impeller area. Withthe increase of rotating speed, the overall disturbance degree of flow field increases. Under the condition of low rotation speed,the flow field acceleration is insufficient. Under the medium rotation speed condition, the flow field is stable and the velocitydistribution is even. Under the condition of high rotating speed, the number of vortices in the flow field increased significantly,theflow separation phenomenon at the impeller was obvious and more unstable flow appeared at the back guide vanes and outletarea. 1 Introduction Nowadays, there are more than 20 million patients with heartfailure in the worldwide [1]. It is also that the incidence rate ofheart failure is rising continuously. Left ventricular assist devicehelps patients to carry out blood circulation. It has become aneffective solution in the absence of a heart transplant donor. As asecond-generation blood p1ummpp, the axial flow blood pumpgenerates continuous flow output through high-speed rotation ofthe impeller. In the flow field of blood pump, a velocity gradient isformed due to changes in flow rate and flow direction [2], vortex,reflux and separation flow [3] and other reasons, causingmechanical damage to red blood cells, which results in haemolysis[4]. Therefore, the study on internal flow field of blood pump canprovide a key reference for improving haemolysis performance andoptimising blood pump structure. Particle image velocimetry (PIV), as a kind of effective flowfield test method, can reflect the action of missing particle motion[5, 6]. It has been applied to study the blood pump flow fieldgradually in recent years [7-9]. Liu et al. [10, 11] used PIV tophotograph the inlet and outlet areas of the axial flow blood pump,and obtained that the inlet flow field was stable and the outlet flowfield had spiral flow. Day and Mcdaniel [12] et al. used PIV tomeasure the steady and unsteady flow fields of centrifugal bloodpump. Wang [13] et al. used PIV to verify the performance of theblood pump impeller design. Shi et al. [14] compared the flow fieldsimulation results of the axial bleeding pump with the PIV resultsand concluded that the three turbulence models and PIV results hadthe same trend, proving the effectiveness of numerical simulation. This paper puts forward a kind of analysis methods to study theaxial flow blood pump impeller and its import and outlet areas withPIV experiment. Using PIV technique to obtain the image ofinternal flow field provided evidence for the design of blood pump. Fig. 1 Axial flow blood pump design by CSU 1.1 Experimental model The experiment model was independently designed by the CentralSouth University (CSU). As shown in Fig. 1, it consists of a frontvane, an impeller and a back vane. A permanent magnet is set inthe inside of the impeller so that external magnet could drive itsrotation. The design flow rate is 5 L/min, the rated pressuredifferential is 13.3 kPa and the rotation speed of pump depends onexternal drivers, which are made of a titanium alloy. In order toreduce the light reflection during the PIV experiment, thecomponents of the blood pump were painted to matte black. 1.2 Experimental device The experimental device adopts the LaVision PIV system. Themain components are described as follows. The laser adopts theBritish Litron LDY300, and the maximum working frequency is90 Hz. A LaVision ImagerProSX 5M dual shutter camera is used,with a resolution of 2448×2050 and each single pixel size of 3.45×3.45 um. The synchronous shooting system includes a LaVision1108090 synchroniser, a rotary encoder, a signal transmission cableand Davis processing software. The arrangement of the experimental device is shown in Fig. 2.The blood pump is installed in a transparent acrylic round pipe.A tank full of water is set in the outer edge of the pipe to adjust therefractive index caused by pipe deformation. The laser is irradiateddirectly from the upper position of the axis of the blood pump. Amotor device with a strong magnet is set behind the blood pump.The motor drives the strong magnet to rotate to generate alternatingmagnetic field, which rotates the blood pump. The motor rotatesonce a week, and the blood pump rotates synchronously for twoweeks. The rotary encoder is installed on the motor to output theshooting trigger signal. Pressure gauges are installed at the inletand outlet of the blood pump. An ultrasonic flow sensor is installedoutside the pipeline. The model of flow sensor is SNOWFLOWCO.55/100 V2.0. In order to maintain the viscosity stability duringfluid circulation, a temperature water bath is added in the loop, andthe temperature is sent in the range of 40-80 °C. Fig. 2 Arrangement of the experimental device 1, Camera; 2, Pressure sensor;3, Blood pump; 4, Magnet; 5, Drive motor; 6, Laserhead; 7, Guide arm; 8, Tank; 9, Pressure sensor; 10, Flow sensor; 11, Thermostaticwater tank; 12, Computer; 13, Synchronous generator; 14, Laser generator m/s 0.125 0.25 0.375 0.5 C Fig. 3 Flow field distribution of the inlet and front vane (a) Flow field distribution at rotation speed of 6000 r/min, (b) Flow field distributionat rotation speed of 7000 r/min, (c) Flow field distribution at rotation speed of 8000r/min 2 Methodology 2.1 Fluid and tracer particle selection For the simulation of blood properties in pump fluid, 27.3%glycerine aqueous solution of density 1.07 kg/m’ is selected; it isapproximation to the indicators of blood. In order to guarantee thetrace properties and light scattering of particles, we selected hollowglass beads of size 10 um. The size of the tracer particle is selected to be similar to the size of a blood cell for better experimentalresults. 2.2 Photography solution According to the structural composition of the axial flow bloodpump, the inlet area and front vanes, the radial area of the impellerand the back vanes, and the outlet area were photographed. Therotary encoder mounted on the drive motor will output signals atthe same position, to control the camera shooting at everyrevolution. 2.3 Soft set-up of PlV The principle of PIV was calculating the time interval between twoimages to obtain the arithmetic cross-correlations. Then, theinformation such as velocity field was obtained; the time intervalwill directly influence the accuracy of the result. The best choice isthe particles moving 5-8 pixels in each interval. Therefore, thetime intervals of the import, export and impeller were set as 150,150 and 50 ps, respectively. In Davis software, the external triggermode was selected as a camera model; the shooting frequency wasset the same as the motor encoder output signal frequency.Shooting occurs once, while the blood pump rotates for tworounds. Inquiry window size is set to be 32×32, and it iscalculated with the adaptive PIV algorithm. 3 Results The experimental results are shown as absolute speed; the directionof the arrow represents the speed direction, and colour representsthe speed magnitude. A total of 100 pieces were shot under eachrotating speed; the results were calculated by average processing.Due to the vertical laser, the shunt field where below the bloodpump directly is blocked, but does not affect the validity of theexperimental results. 3.1 Flow field distribution of inlet and front vane As can be seen from Fig. 3, the velocity field at the inlet isrelatively stable, with the maximum velocity of 0.5 m/s. Thevelocity direction of particles in the flow field is basically the sameas the axis of blood pump. The particles accelerated into theimpeller area at the leading vanes, and the flow direction wasbasically consistent with the contour of the front guide vanes. Withthe increase of rotating speed, the flow field velocity at the inletincreased significantly and more unstable flows were generated.Fig. 3a shows the speed of 7000 r/min; the inlet velocity is smoothand the flow is gentle, but the impeller generates a larger vortex atthe upper right acceleration area. Fig. 3b shows the speed of 8000r/min. The flow field at inlet and the leading zone is stable, and theacceleration is even. With the further increase of speed, the flowfield at the entrance is seriously disturbed. Fig. 3c shows that underthe condition of 9000 r/min, large areas of vortex, reflux and flowseparation occur near the wall of the pipeline and front vane area. 3.2 Flow field distribution of impeller As shown in Fig. 4, the maximum velocity at the impeller is 2.5m/s. The photographed part at the upper part of the impeller isdivided into A, B, C and D areas. The velocity of the four areasincreases successively. In region A, flow is stable and the flowdirection basically follows the impeller rotation direction, but smalleddy currents occur in the left under the condition of 9000 r/min. Inregion B, the flow field is stable under all three workingconditions. However, eddy currents and severe turbulence occur onthe right side near the blade in regions C and D. Especially, thebackflow is obvious and large vortexes occur in region D. Therewas a small range of reflux near the wall of blood pump body. 3.3 Flow field distribution of outlet and back vane As shown in Fig. 5, the maximum flow velocity at the back guidevane and the outlet is 2.0 m/s. The eddy currents and the reflow Fig. 4 Flow field distribution of the impeller (a) Flow field distribution at rotation speed of 6000 r/min, (b) Flow field distributionat rotation speed of 7000 r/min, (c) Flow field distribution at rotation speed of 8000r/min zone appeared in all three working conditions, especially at a highrotating speed. There was a high velocity zone in the central axisarea. A high velocity jet area occurred near the wall of the pipe.With the increase of rotating speed, the flow field appears moreturbulent. Under the conditions of 8000 and 9000 r/min, there areeddy currents in the area near the pump body and in the latter halfof the outlet obviously. 4 Conclusion (i). The flow field of the blood pump at the inlet is relatively stable.In the impeller area, the flow field presents an unstable flow statedue to the rapid increase of Reynolds coefficient. In the leadingvanes and region D of the impeller area, there is partial reflux dueto the baffle of guide vane. (ii). With the increase of rotating speed, the overall disturbancedegree of flow field increases. Under the condition of 7000 r/min,the flow field acceleration is insufficient, leading to the reflux atthe upper part of the leading blade, and the reflux in the D area ofthe impeller is relatively small. Under the condition of 8000 r/min,the flow field is relatively stable and the acceleration is even.Under the condition of 9000 r/min, the number of vortices in theflow field increased significantly, the flow separation at theimpeller was obvious, and more unstable areas appeared at thetrailing guide vanes and exits. Thus,8000 r/min is the most suitablespeed for this pump. (iii). As the velocity is perpendicular to the axis in the flow afterthe back vane, the fluid is sprayed to the upper wall. Thus, the jetarea is formed at the outlet area. Therefore, it is necessary tomodify the streamline of the back guide vane, which provides aclear idea for the structural optimisation of the blood pump. (iv). There is a small range of backflow near the wall of the bloodpump, so it is necessary to consider the selection of wall functionin flow field simulation. 5 Acknowledgments This work was supported by the National Natural ScienceFoundation of China (Grant Nos. 51475477 and31670999). m/s x/mm Fig. 5 Flow field distribution ofthe outlet and back vane (a) Flow field distribution at rotation speed of 6000 r/min, (b) Flow field distributionat rotation speed of 7000 r/min, (c) Flow field distribution at rotation speed of 8000r/min 6 References [1] Schmid, D., Kaufmann, F., Amacher, R., et al.: ‘Left ventricular assistdevices: challenges toward sustaining long-term patient care’, Ann. Biomed.Eng., 2017,8,(45), pp. 1836-1851 [2] Tsukiya, T., Taenaka, Y., Tatsumi, E., et al.: ‘Visualization study of thetransient flow in the centrifugal blood pump impeller’, ASAIO J., 2002, 48,(4),pp. 431-436 [3] Karmonik, C., Partovi, S., Loebe, M., et al.: ‘Influence of LVAD cannulaoutflow tract location on hemodynamics in the ascending aorta: a patient-specific computational fluid dynamics approach', ASAIO J., 2012, 58, (6), pp.562-567 r1[4]Fraser, K., Zhang, T., Taskin, M., et al.: ‘A quantitative comparison ofmechanical blood damage parameters in rotary ventricular assist devices:shear stress, exposure time and hemolysis index’, J. Biomech. Eng., 2012,134,(8),p.81002 [51 Sankovic, J.M., Kadambi, J., Mehta, M., et al.: ‘PIV investigations of theflow field in the volute of a rotary blood pump’ J. Fluids Eng., 2003, 126,(95),pp. 807-815 [6] Yang, X., Gui, X., Huang, H., et al.: Particle image velocimetry experimentalI 7and computational investigation of a blood pump’, J. Therm. S68ci., 2012, 21,(3),pp.262-268 [7] Yamane, T., Maruyama, O., Nishida, M., et al.:“The most profitable use offlow visualization in the elimination of thrombus from a monopivot magneticsuspension blood pump’, Artif.Organs, 2004,28,p.390 ( [8] Wu, Y . , L iu, S ., Yuan, H . , et al: PIV measurement on internal instantaneous f lows of a centrifugal pump’, Sci. C hina T e chnol. Sci., 2011,54,(2), pp . 270- 276 ) [9] Hui, M., Hong, X., Fang, W., et al.: ‘Application of CFD technique in thed1owesign and flow analysis of implantable axial flow blood pump’, J.Hydrodyn.,2010,22,(4),pp. 518-525 [10] Liu, G., Zhou, J., Hu, S., et al.: ‘Experimental study on PIV flow field inoutlet pipe of axial flow left ventricle auxiliary pump’, Chin. J. Biomed. Eng.,2013,6,pp. 678-684 [11] Liu, G., Zhou, J., Sun, H., et al.: “Numerical simulation and experimentalstudy on the flow field in1 1the inlet pipe of axial bleeding pump’, Beijin?gBiomed. Eng.,2018,03,pp. 228-234 ( Day, S ., Mcdaniel, J.: ‘ PIV measurements of flow in a c e n t rifugal bl o odpump: s t eady f l ow’, J. B iomech. E n g., 2005,127 , (2), pp . 244-25 3 ) ( Wang, F., Li, L., Wang, H . , e t al.: ‘Study on flow f i eld in blood p u mp basedon p article image velocimetry’ , Chin.J . Biomed. Eng., 2009,04, pp.597-601 ) ( [14] Shi, W ., S hao, P., Zhang, D., e t a l.: ‘Numerical s imulation a nd PIV test o fa xial f low p ump in t ernal f l ow’, J. D r ainage Irrigation En g ., 2015, 04, pp. 277 - 282 ) . Eng., Vol. Iss. pp. his is an open access article published by the IET under the Creative Commons Attribution License(http://creativecommons.org/licenses/by/./) In order to investigate the internal flow field of an axial blood pump, two-dimensional (2D) particle image velocimetry (PIV) was applied to test the blood pump under three different conditions. Acquiring the images of inlet, front guide vane, impeller, back guide vane and outlet area, the distribution of internal flow field was then analysed. The rotation speed of theblood pump was set to 6000, 7000 and 8000 r/min, respectively. The results show that the flow field of blood pump is stable relatively at the inlet area. Some vortices and reflux existed due to the block of guide vane in the import and impeller area. With the increase of rotating speed, the overall disturbance degree of flow field increases. Under the condition of low rotation speed, the flow field acceleration is insufficient. Under the medium rotation speed condition, the flow field is stable and the velocity distribution is even. Under the condition of high rotating speed, the number of vortices in the flow field increased significantly, the flow separation phenomenon at the impeller was obvious and more unstable flow appeared at the back guide vanes and outlet area.
确定
还剩2页未读,是否继续阅读?

产品配置单


北京欧兰科技发展有限公司为您提供《轴流式血泵中速度场检测方案(CCD相机)》,该方案主要用于其他中速度场检测,参考标准--,《轴流式血泵中速度场检测方案(CCD相机)》用到的仪器有Imager SX PIV相机、德国LaVision PIV/PLIF粒子成像测速场仪、LaVision DaVis 智能成像软件平台
相关方案
更多
该厂商其他方案
更多