


The analysis of organometallics samples using an ICP-OES is not a simple proposition as digestion of the sample or dissolution in an adequate solvent is required. Digestion is a lengthy process and loss of analytes and contamination are severe problems. The dissolution method however requires an aromatic solvent, resulting in specific analysis conditions and special pump tubing, which are not easy problems for a typical laboratory to overcome.
This Application Note presents the preparation,characterization and optimization of bitumen after emulsion in water.
方案详情

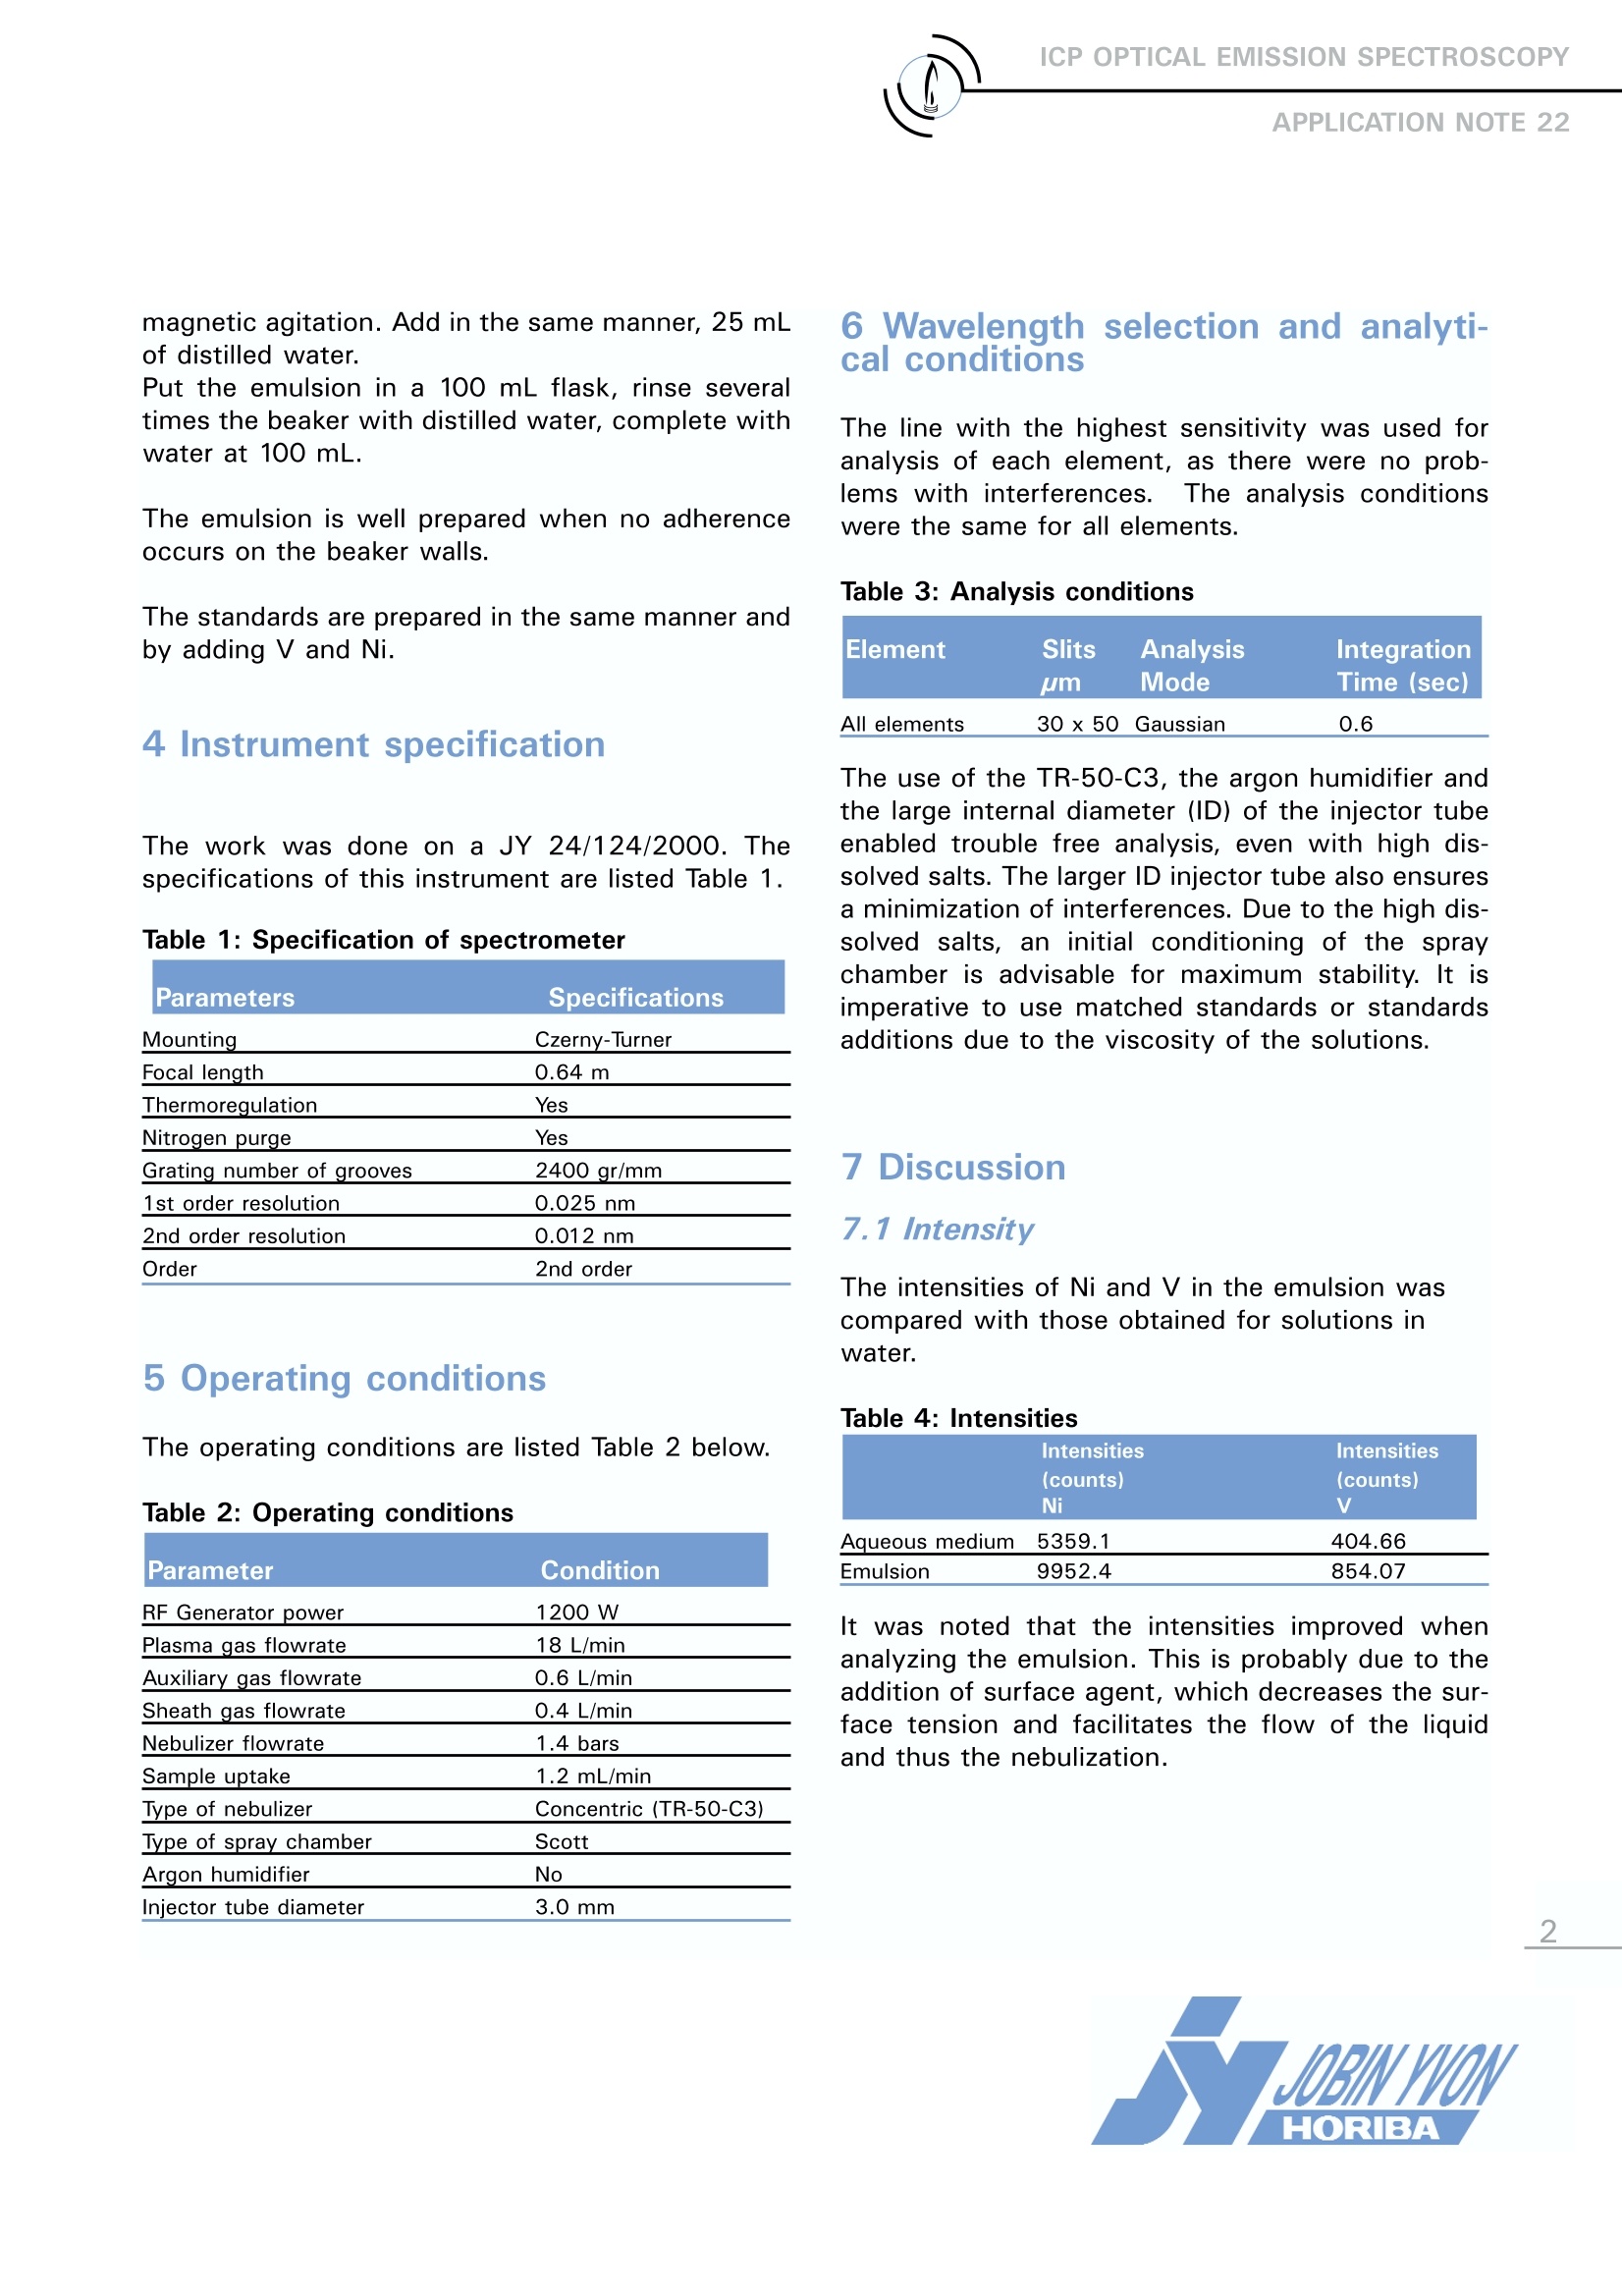
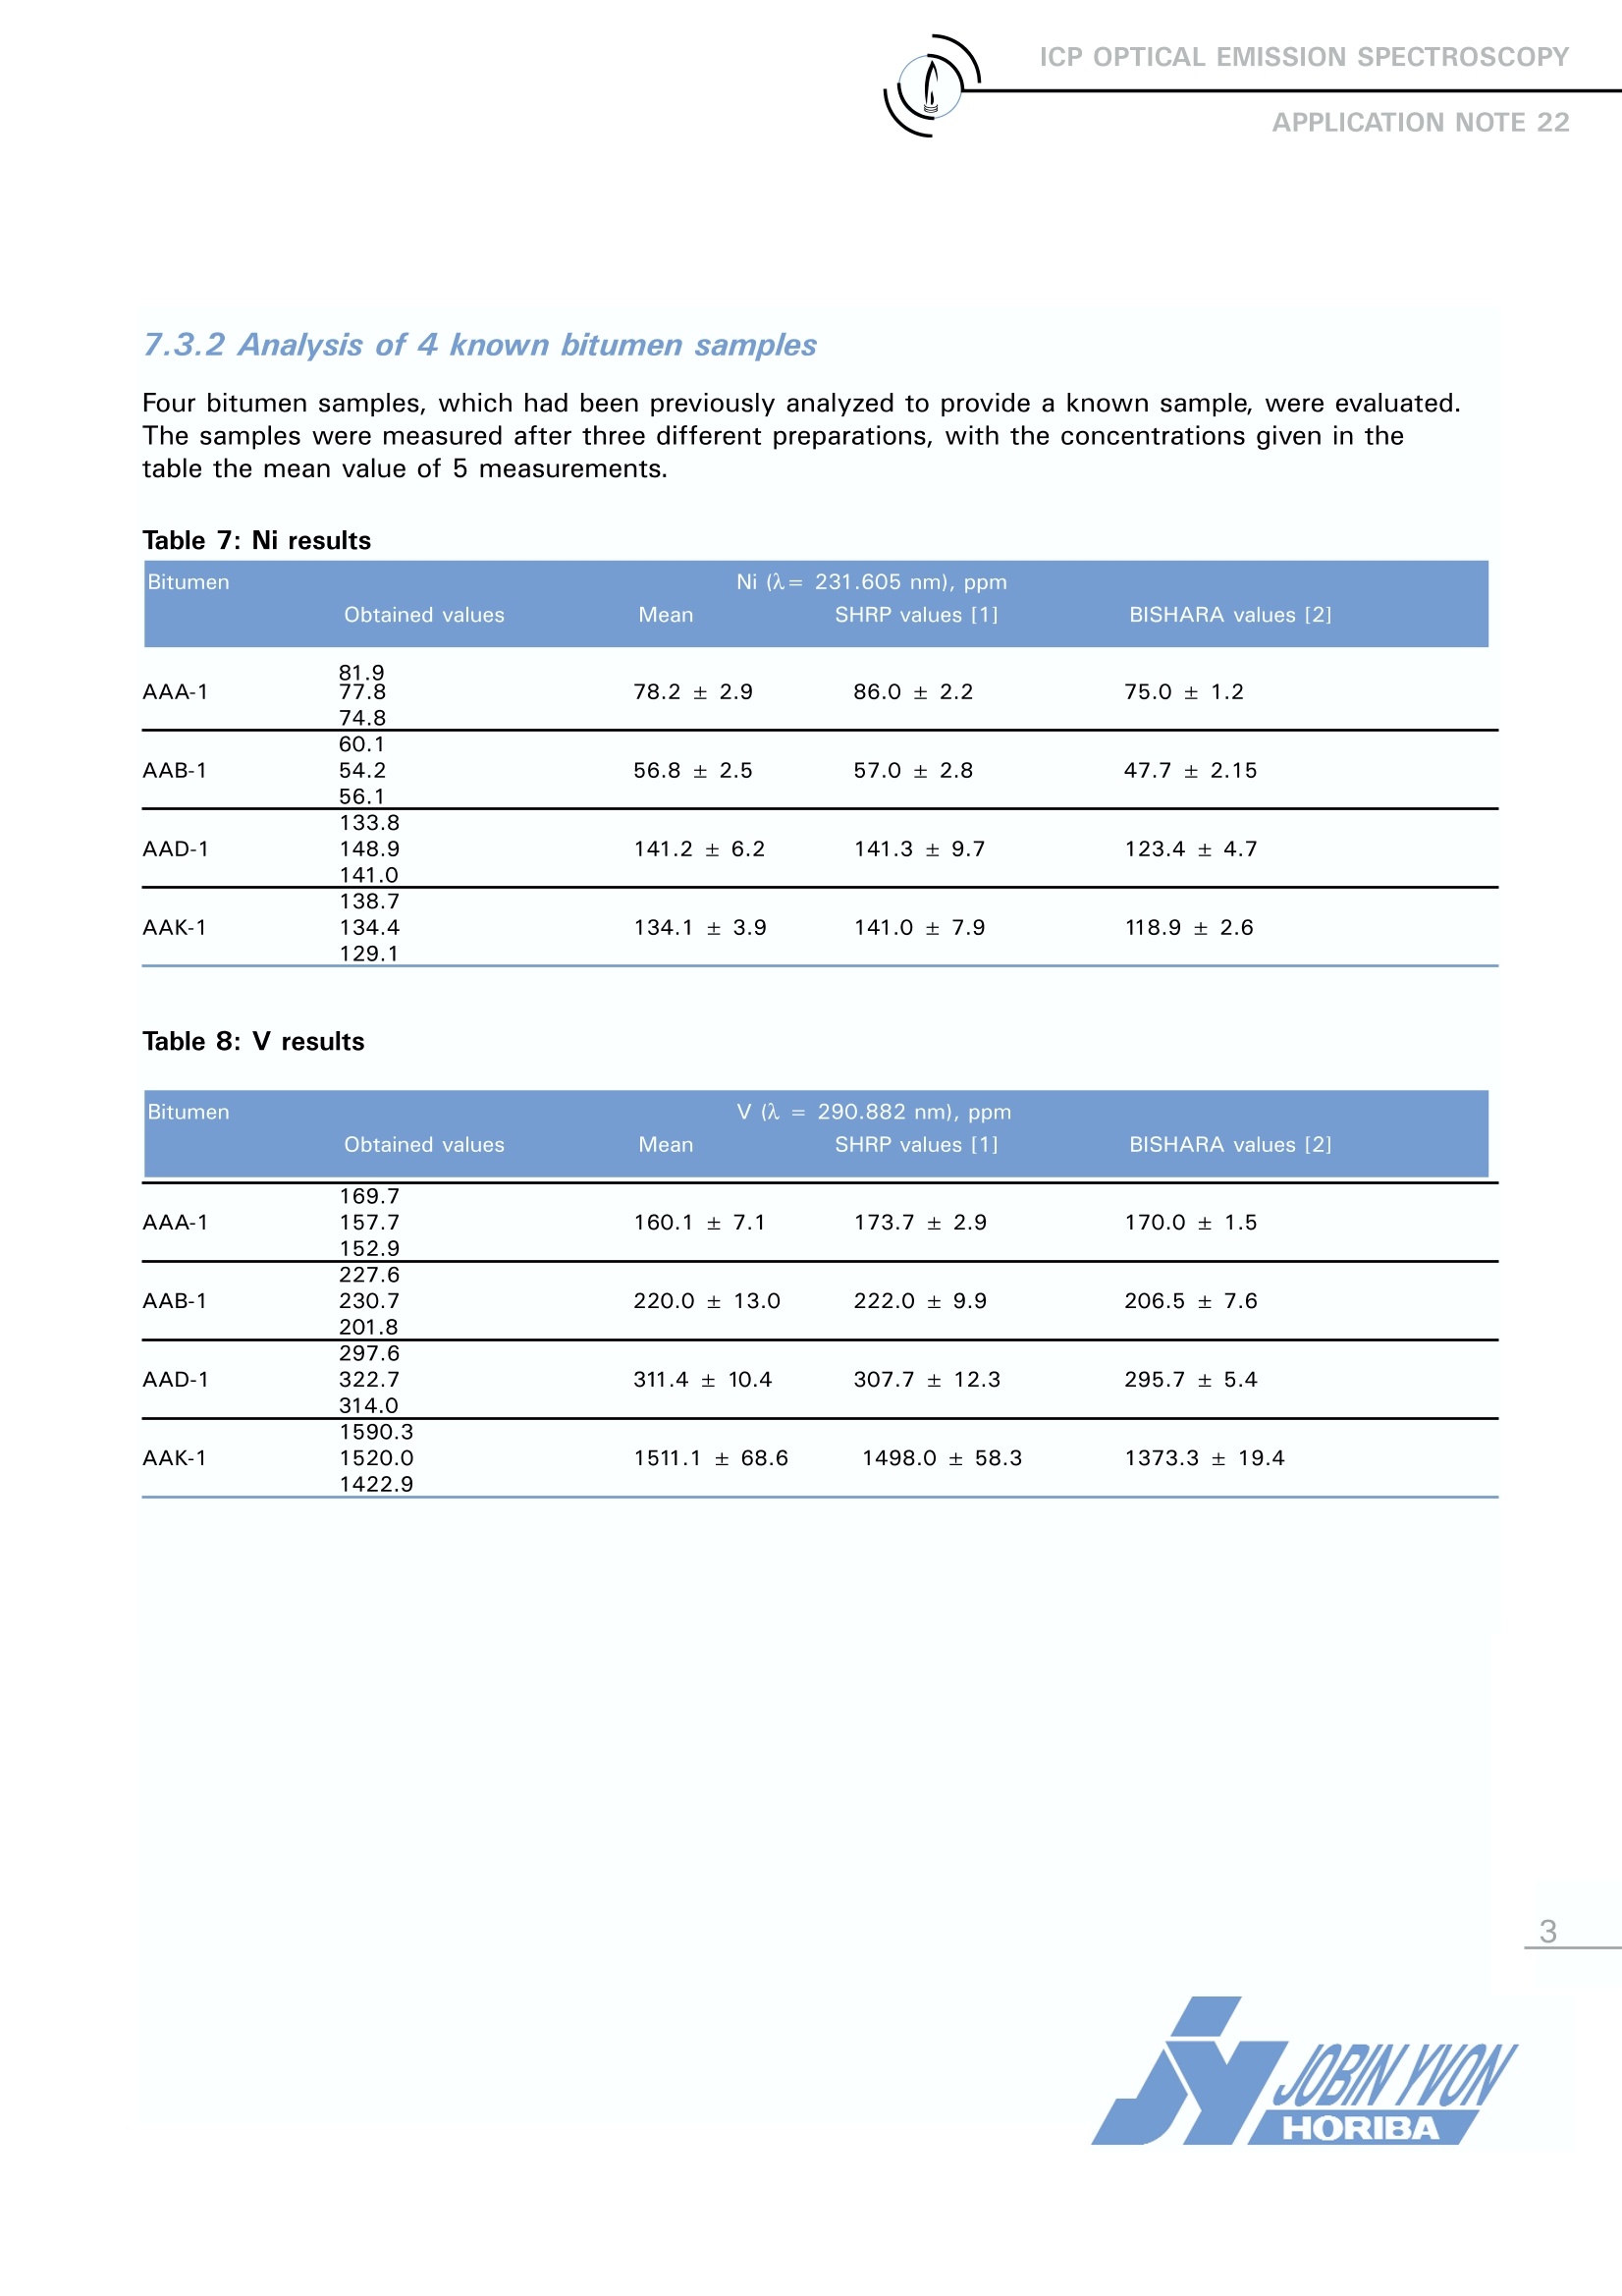
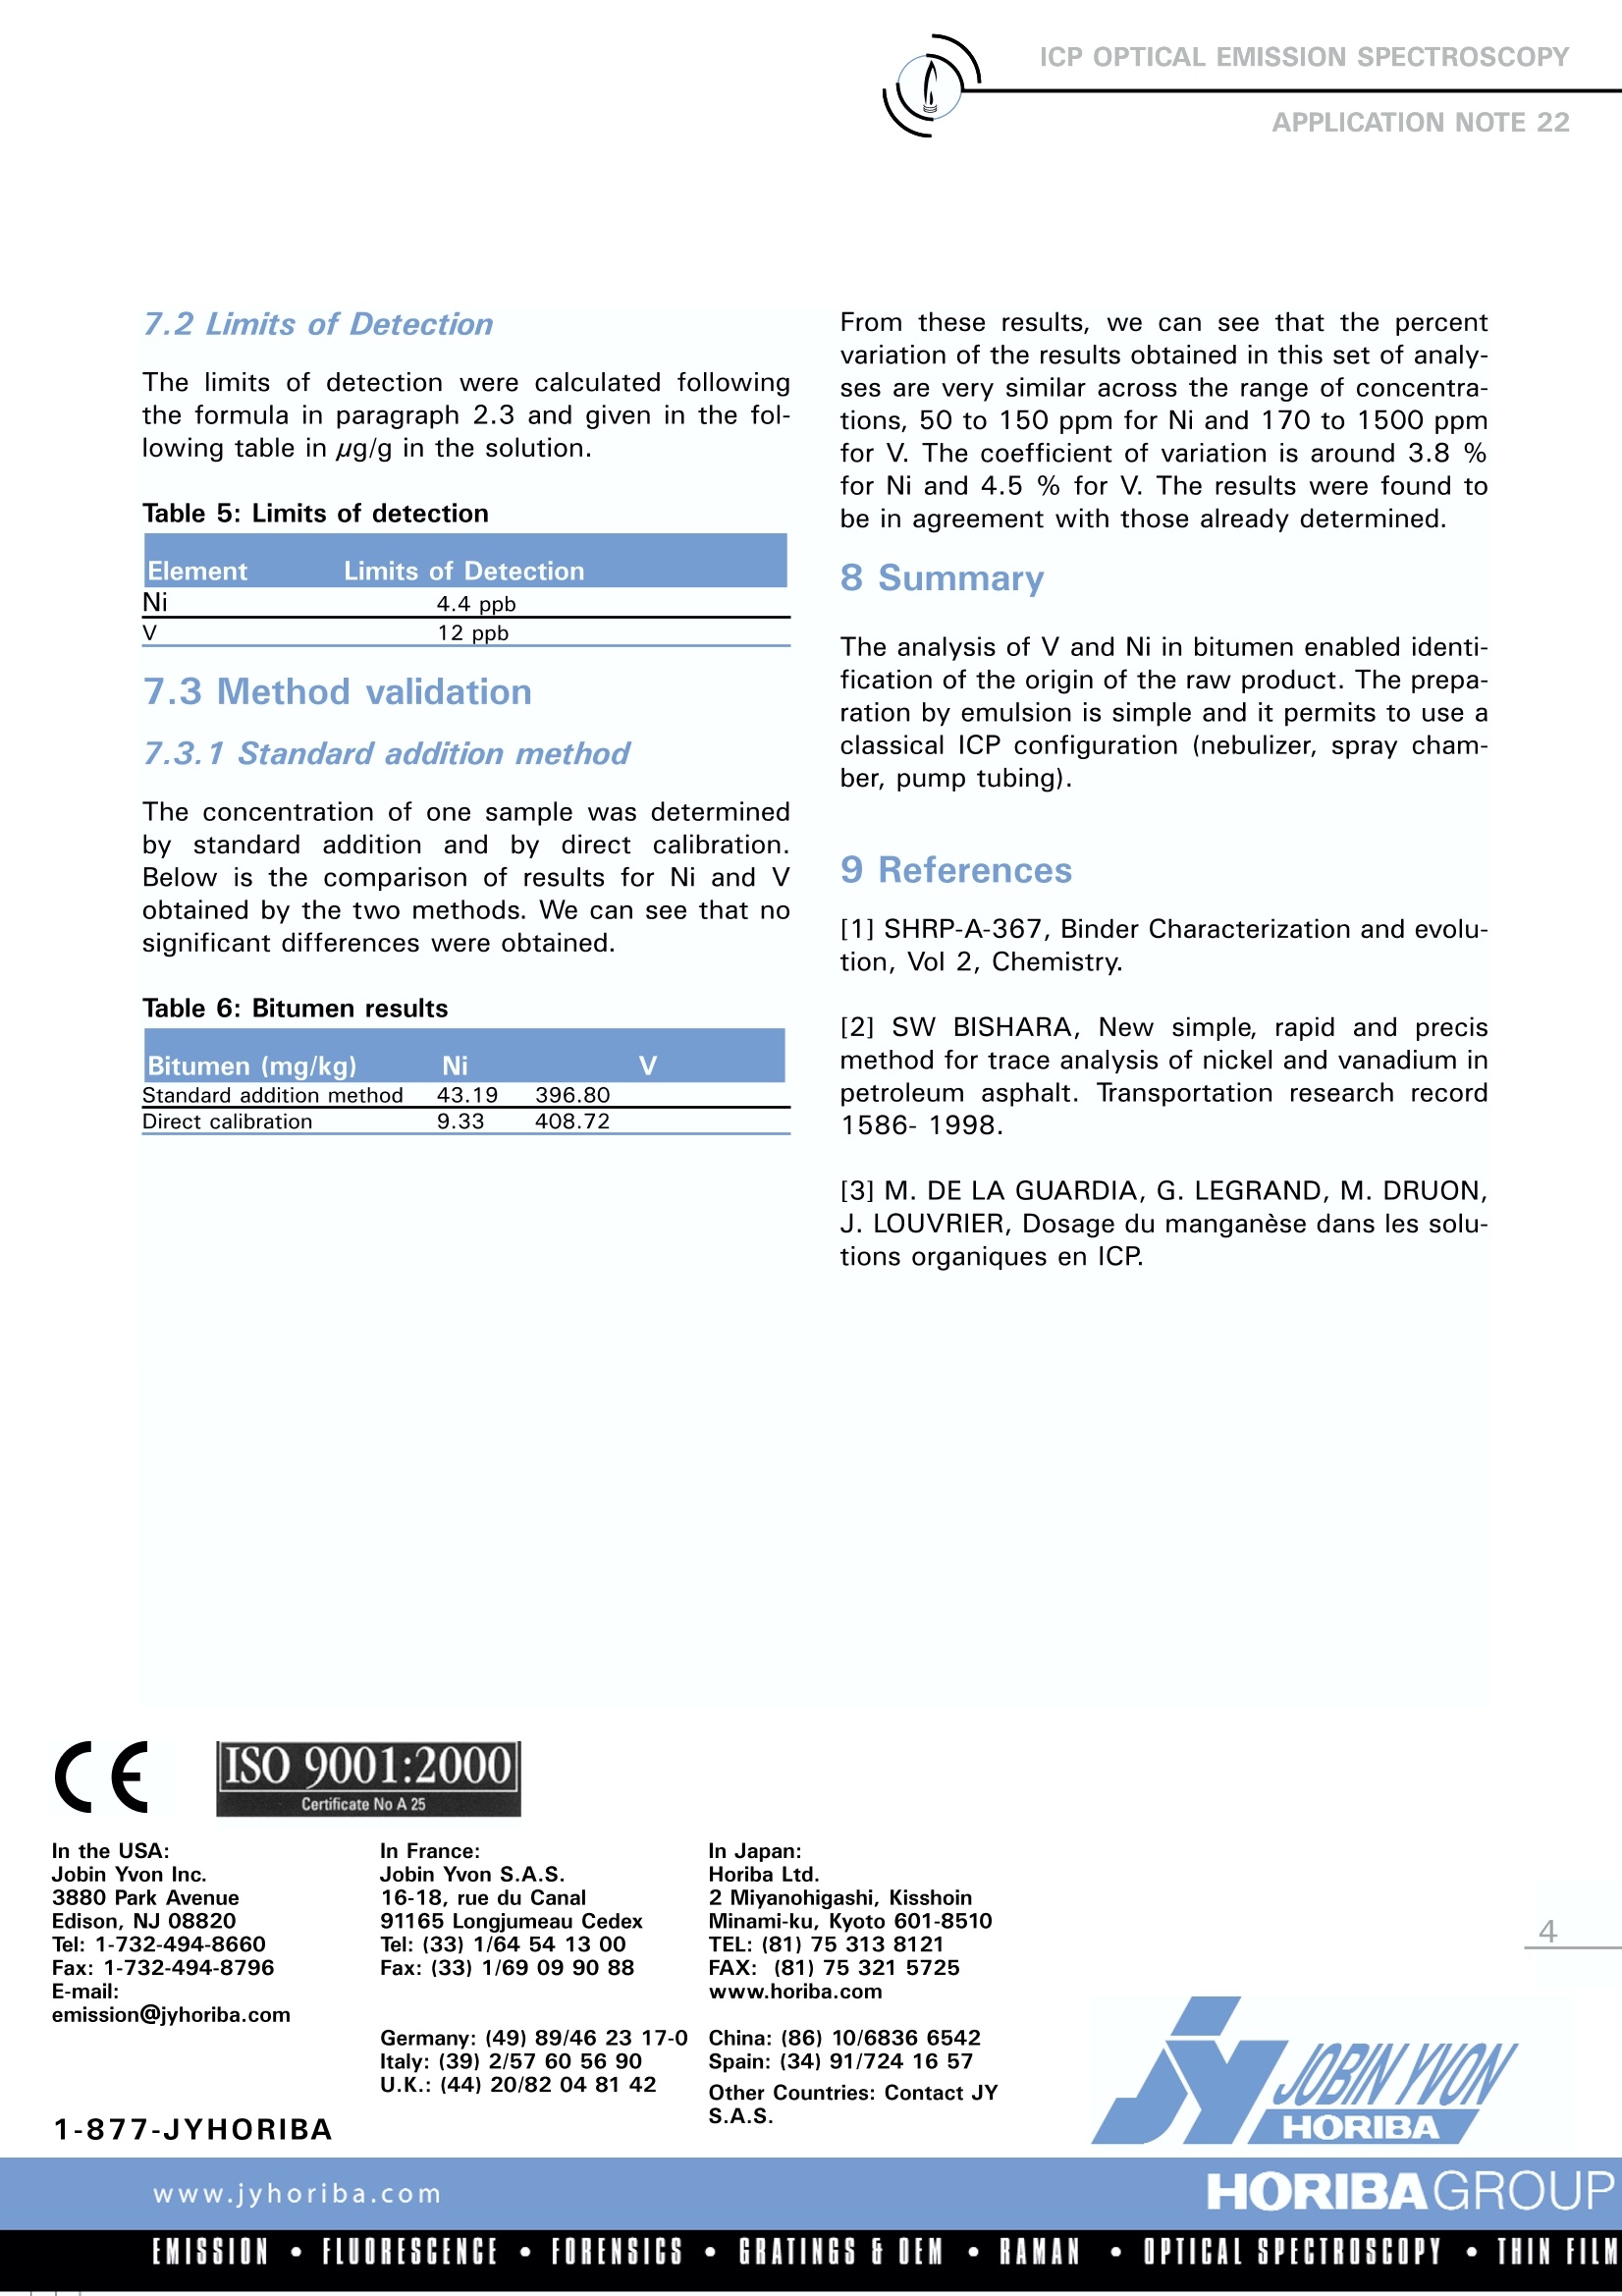
ICP OPTICAL EMISSION SPECTROSCOPYAPPLICATION NOTE 22 Determination of Ni and V in Bitumen by Simple SamplePreparation by Emulsion M. Druon, V. Mondon, Ph. TouzéLaboratoire Central des Ponts et ChausseesParis, France The analysis of organometallics samples using anICP-OES is not a simple proposition as digestionof the sample or dissolution in an adequate sol-vent is required. Digestion is a lengthy processand loss of analytes and contamination1 aresevere problems. The dissolution method howev-er requires an aromatic solvent, resulting in spe-cific analysis conditions and special pump tubing,which are not easy problems for a typical labora-tory to overcome. This Application Note presents the preparation,characterization and optimization ofbitumenafter emulsion in water. 2 Principle 2.1 Technique used The elemental analysis of solutions was under-taken by Inductively Coupled Plasma OpticalEmission Spectrometry (ICP-OES). The sample isnebulized then transferred to an argon plasma. Itis decomposed, atomized and ionized wherebythe atoms and ions are excited. We measure theintensity of the light emitted when the atoms orions return to lower levels of energy.y.Each ele-ment emits light at characteristic wavelengthsand these lines can be used for quantitativeanalysis after a calibration. The choice of the wavelength in a given matrixcan be made using the “profile" function, or byusing Win-IMAGE, which is rapid semi-quantita-tive analysis mode using multiple wavelengths.The principle is the same in either case: recordthe scans of analytes at low concentration, andof the matrix. By superimposing the spectra, wesee possible interferences. 2.3 Limits of detection estimation The limits of detection are calculated using thefollowing formula: With: LOD = limits of detection,k= 3 for the normal 3-sigma values,BEC =Background equivalent concentration,RSDo = relative standard deviation of the blank. To calculate the LOD, a calibration curve is con-structed using two points, 0 ppm and 5 ppm, orsome concentration where the calibration is lin-ear; this gives the BEC. The RSDo is evaluated byrunning the blank ten times. 3 Sample preparation The emulsion used is an oil/water emulsion. It ismade of two phases, xylene and distilled water,and of a surfactant (Triton X@ 100). The emulsionwas maintained by a magnetic stirrer. 1.5 g of bitumen was weighed into a 100 mLbeaker and dissolved in 5 mL of xylene. The dis-solution was accelerated by using an ultrasonicbath. After complete dissolution, 2 mL of Tritonwas added drop by drop with continuous magnetic agitation. Add in the same manner, 25 mLof distilled water. Put the emulsion in a 100 mL flask, rinse severaltimes the beaker with distilled water, complete withwater at 100 mL. The emulsion is well prepared when no adherenceoccurs on the beaker walls. The standards are prepared in the same manner andby adding V and Ni. 4 Instrument specification The work was done on a JY 24/124/2000. Thespecifications of this instrument are listed Table 1. Table 1: Specification of spectrometer Parameters Specifications Mounting Czerny-Turner Focal length 0.64 m Thermoregulation Yes Nitrogen purge Yes Grating number of grooves 2400 gr/mm 1st order resolution 0.025 nm 2nd order resolution 0.012 nm Order 2nd order 5 Operating conditions The operating conditions are listed Table 2 below. Table 2: Operating conditions Parameter Condition RF Generator power 1200 W Plasma gas flowrate 18 L/min Auxiliary gas flowrate 0.6 L/min Sheath gas flowrate 0.4 L/min Nebulizer flowrate 1.4 bars Sample uptake 1.2 mL/min Type of nebulizer Concentric (TR-50-C3) Type of spray chamber Scott Argon humidifier No Injector tube diameter 3.0 mm 6 Wavelength selection and analyti-cal conditions The line with the highest sensitivity was used foranalysis of each element, as there were no prob-lems with interferences.1The analysis conditionswere the same for all elements. Table 3: Analysis conditions Element Slits Analysis Integration um Mode Time (sec) All elements 30 x 50 Gaussian 0.6 The use of the TR-50-C3, the argon humidifier andthe large internal diameter (ID) of the injector tubeenabled trouble free analysis, even with high dis-solved salts. The larger ID injector tube also ensuresa minimization of interferences. Due to the high dis-solved salts, an initial conditioning of the spraychamber is advisable for maximum stability. It isimperative to use matched standards or standardsadditions due to the viscosity of the solutions. 7 Discussion 7.1 Intensity The intensities of Ni and V in the emulsion wascompared with those obtained for solutions inwater. Table 4: Intensities Intensities Intensities (counts) (counts) Ni V Aqueous medium 5359.1 404.66 Emulsion 9952.4 854.07 It was noted that the intensities improved whenanalyzing the emulsion. This is probably due to theaddition of surface agent, which decreases the sur-face tension and facilitates the flow of the liquidand thus the nebulization. 7.3.2 Analysis of 4 known bitumen samples Four bitumen samples, which had been previously analyzed to provide a known sample, were evaluated.The samples were measured after three different preparations, with the concentrations given in thetable the mean value of 5 measurements. Table 7: Ni results Bitumen Obtained values Ni ()= 231.605 nm), ppm Mean SHRP values [1] BISHARA values [2] AAA-1 81.9 77.8 78.2±2.9 86.0±2.2 75.0±1.2 74.8 AAB-1 60.1 54.2 56.1 56.8±2.5 57.0±2.8 47.7±2.15 AAD-1 133.8 148.9 141.2±6.2 141.3±9.7 123.4±4.7 141.0 AAK-1 138.7 134.4 129.1 134.1±3.9 141.0±7.9 118.9±2.6 Table 8: V results Bitumen Obtained values V(=290.882 nm), ppm Mean SHRP values [1] BISHARA values [2] AAA-1 169.7 157.7 160.1±7.1 173.7±2.9 170.0±1.5 152.9 AAB-1 227.6 230.7 220.0±13.0 222.0±9.9 206.5±7.6 201.8 AAD-1 297.6 322.7 314.0 311.4±10.4 307.7±12.3 295.7±5.4 AAK-1 1590.3 1520.0 1422.9 1511.1±68.6 1498.0±58.3 1373.3±19.4 7.2 Limits of Detection The limits of detection were calculated followingthe formula in paragraph 2.3 and given in the fol-lowing table in ug/g in the solution. Table 5: Limits of detection Element Limits of Detection Ni 4.4 ppb V 12 ppb 7.3 Method validation 7.3.1 Standard addition method The concentration of one sample was determinedby standard addition and by direct calibration.Below is the comparison of results for Ni and Vobtained by the two methods. We can see that nosignificant differences were obtained. Table 6: Bitumen results Bitumen (mg/kg) Ni V Standard addition method 43.19 396.80 Direct calibration 9.33 408.72 From these results, we can see that the percentvariation of the results obtained in this set of analy-ses are very similar across the range of concentra-tions, 50 to 150 ppm for Ni and 170 to 1500 ppmfor V. The coefficient of variation is around 3.8 %for Ni and 4.5 % for V. The results were found tobe in agreement with those already determined. 8 Summary The analysis of V and Ni in bitumen enabled identi-fication of the origin of the raw product. The prepa-ration by emulsion is simple and it permits to use aclassical ICP configuration (nebulizer, spray cham-ber, pump tubing). 9 References [1] SHRP-A-367, Binder Characterization and evolu-tion, Vol 2, Chemistry. [2] SW BISHARA, New simple, rapid anpdrecismethod for trace analysis of nickel and vanadium inpetroleum asphalt. Transportation research record1586-1998. [3] M. DE LA GUARDIA, G. LEGRAND, M. DRUON,J. LOUVRIER, Dosage du manganese dans les solu-tions organiques en ICP. In the USA: Jobin Yvon Inc. 3880 Park Avenue Edison, NJ 08820 Tel: 1-732-494-8660 Fax: 1-732-494-8796 E-mail: emission@jyhoriba.com
确定
还剩2页未读,是否继续阅读?

产品配置单

HORIBA(中国)为您提供《铋中镍含量检测方案(ICP-AES)》,该方案主要用于铋中镍含量检测,参考标准--,《铋中镍含量检测方案(ICP-AES)》用到的仪器有HORIBA Ultima Expert高性能ICP光谱仪
推荐专场
相关方案
更多
该厂商其他方案
更多