


方案详情
文
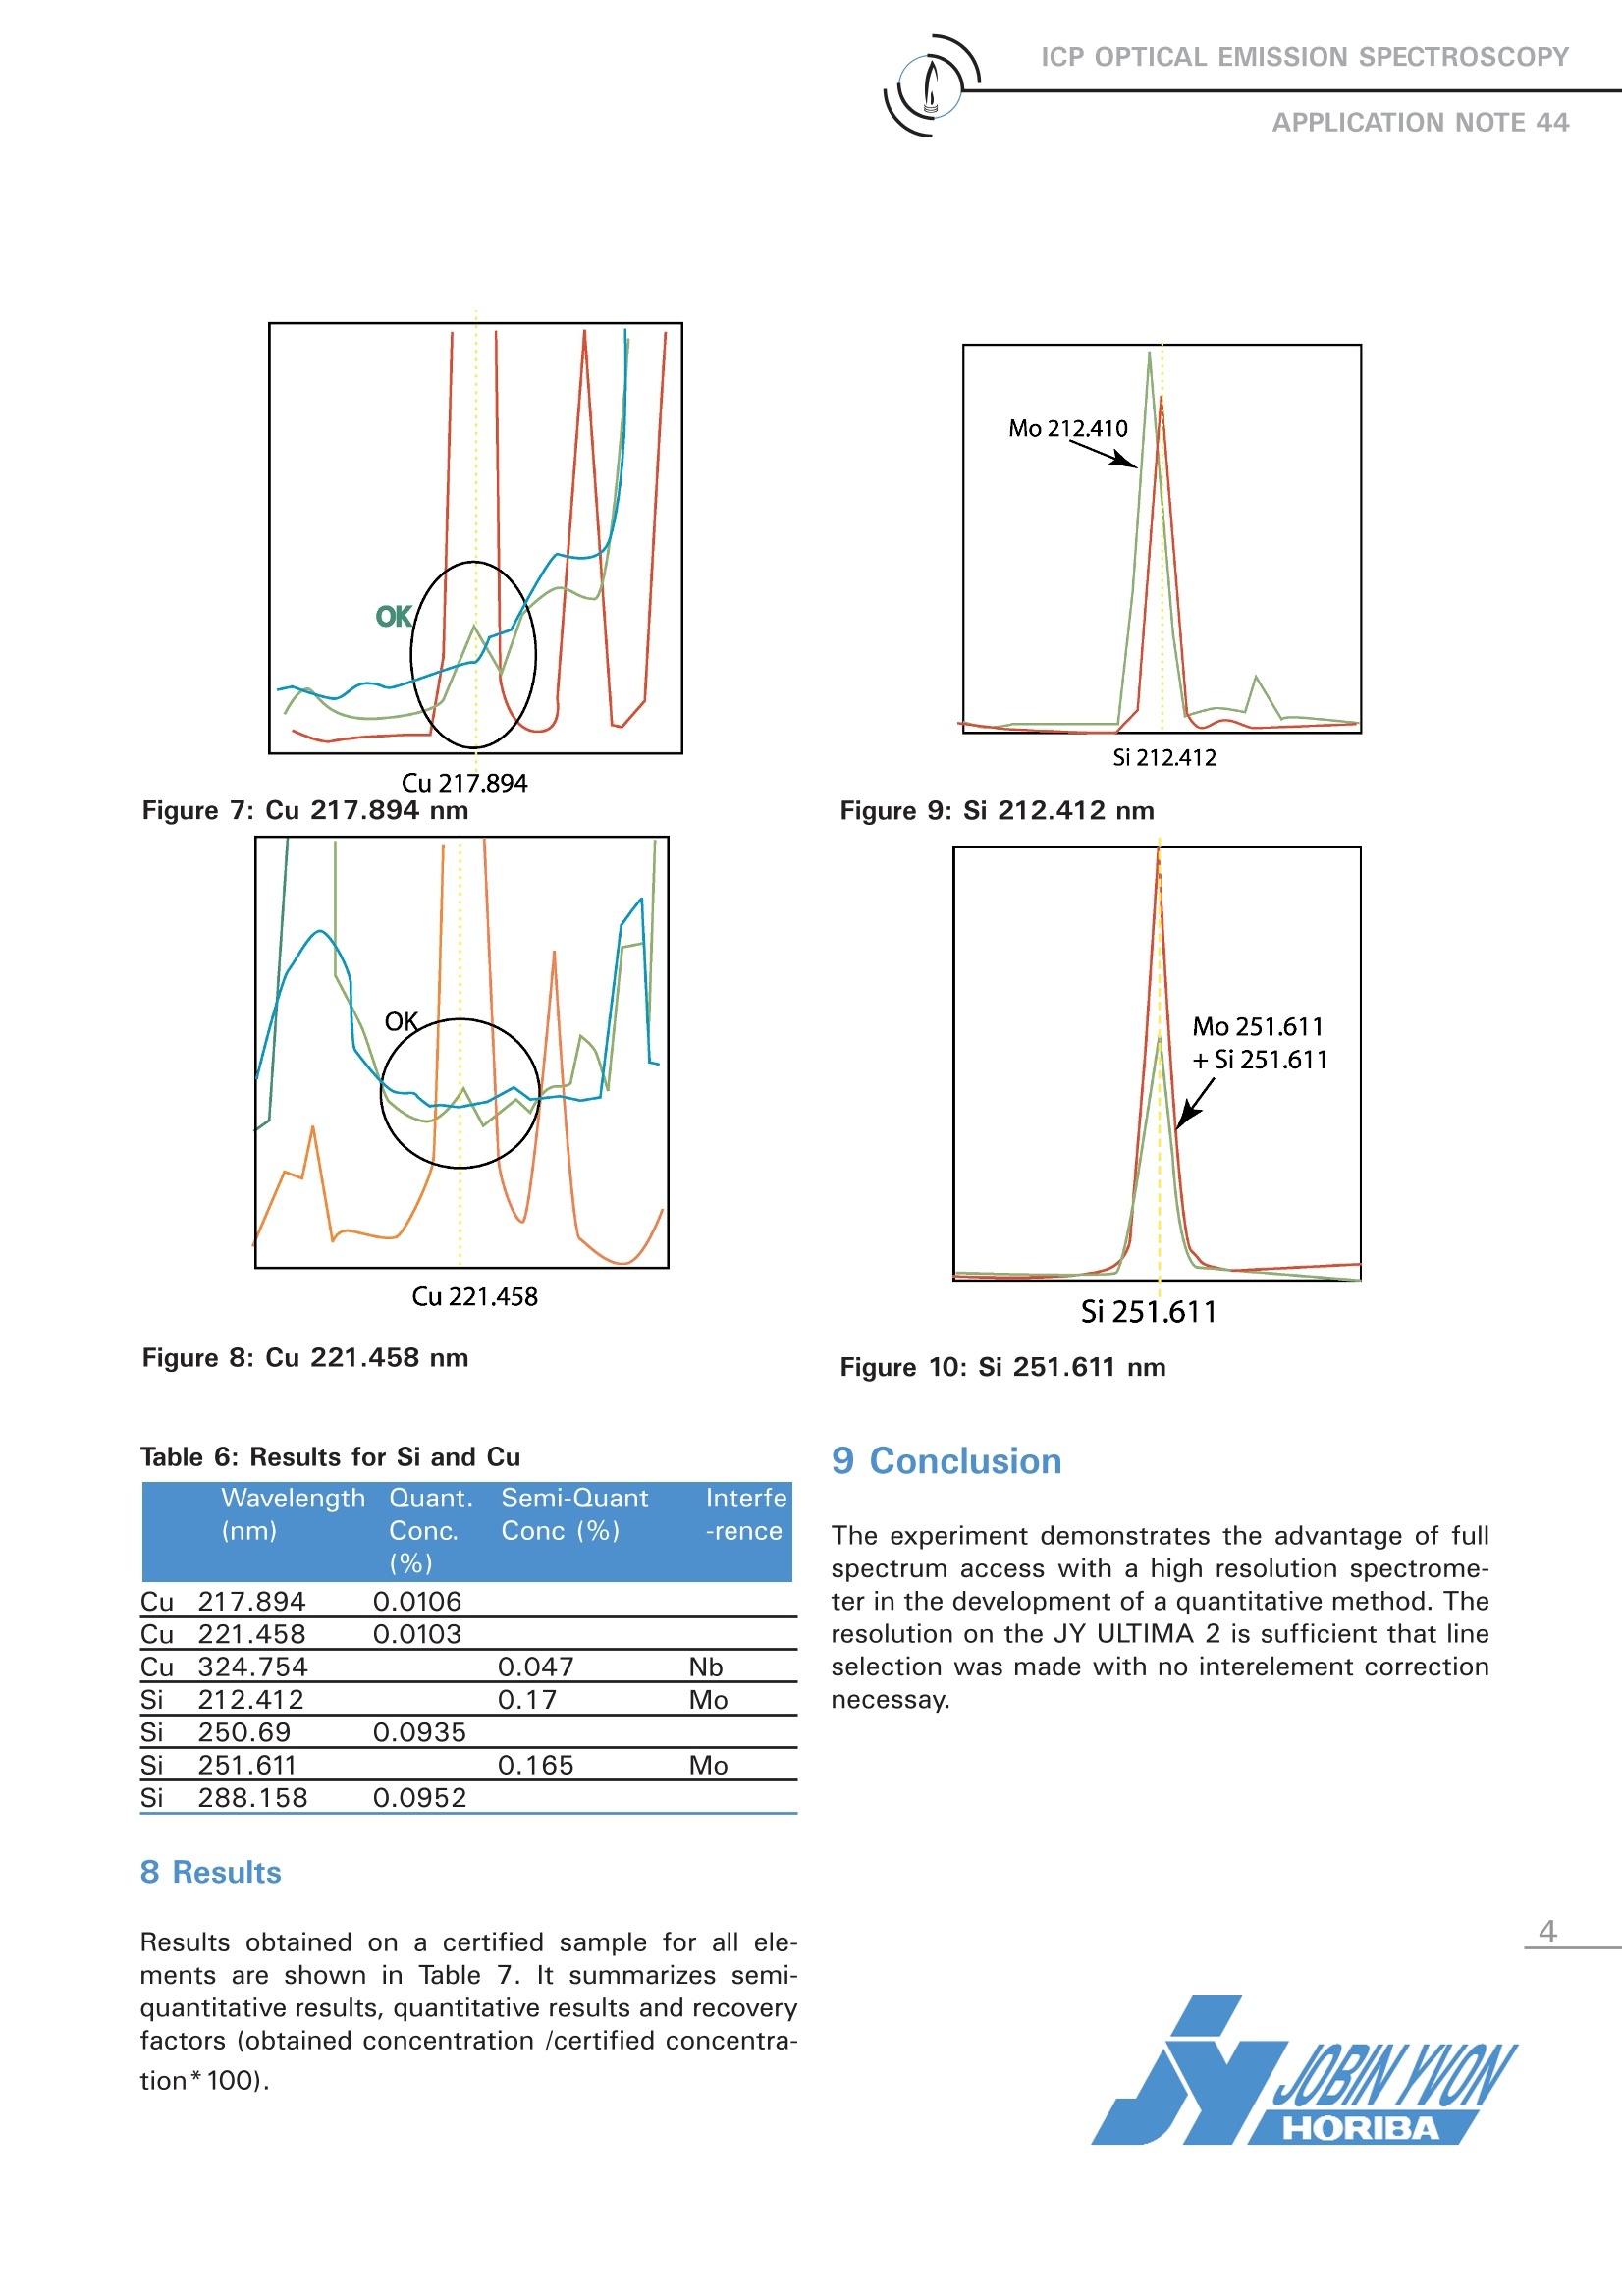
The experiment demonstrates the advantage of full spectrum access with a high resolution spectrometer in the development of a quantitative method. The resolution on the JY ULTIMA 2 is sufficient that line selection was made with no interelement correction necessay.
方案详情

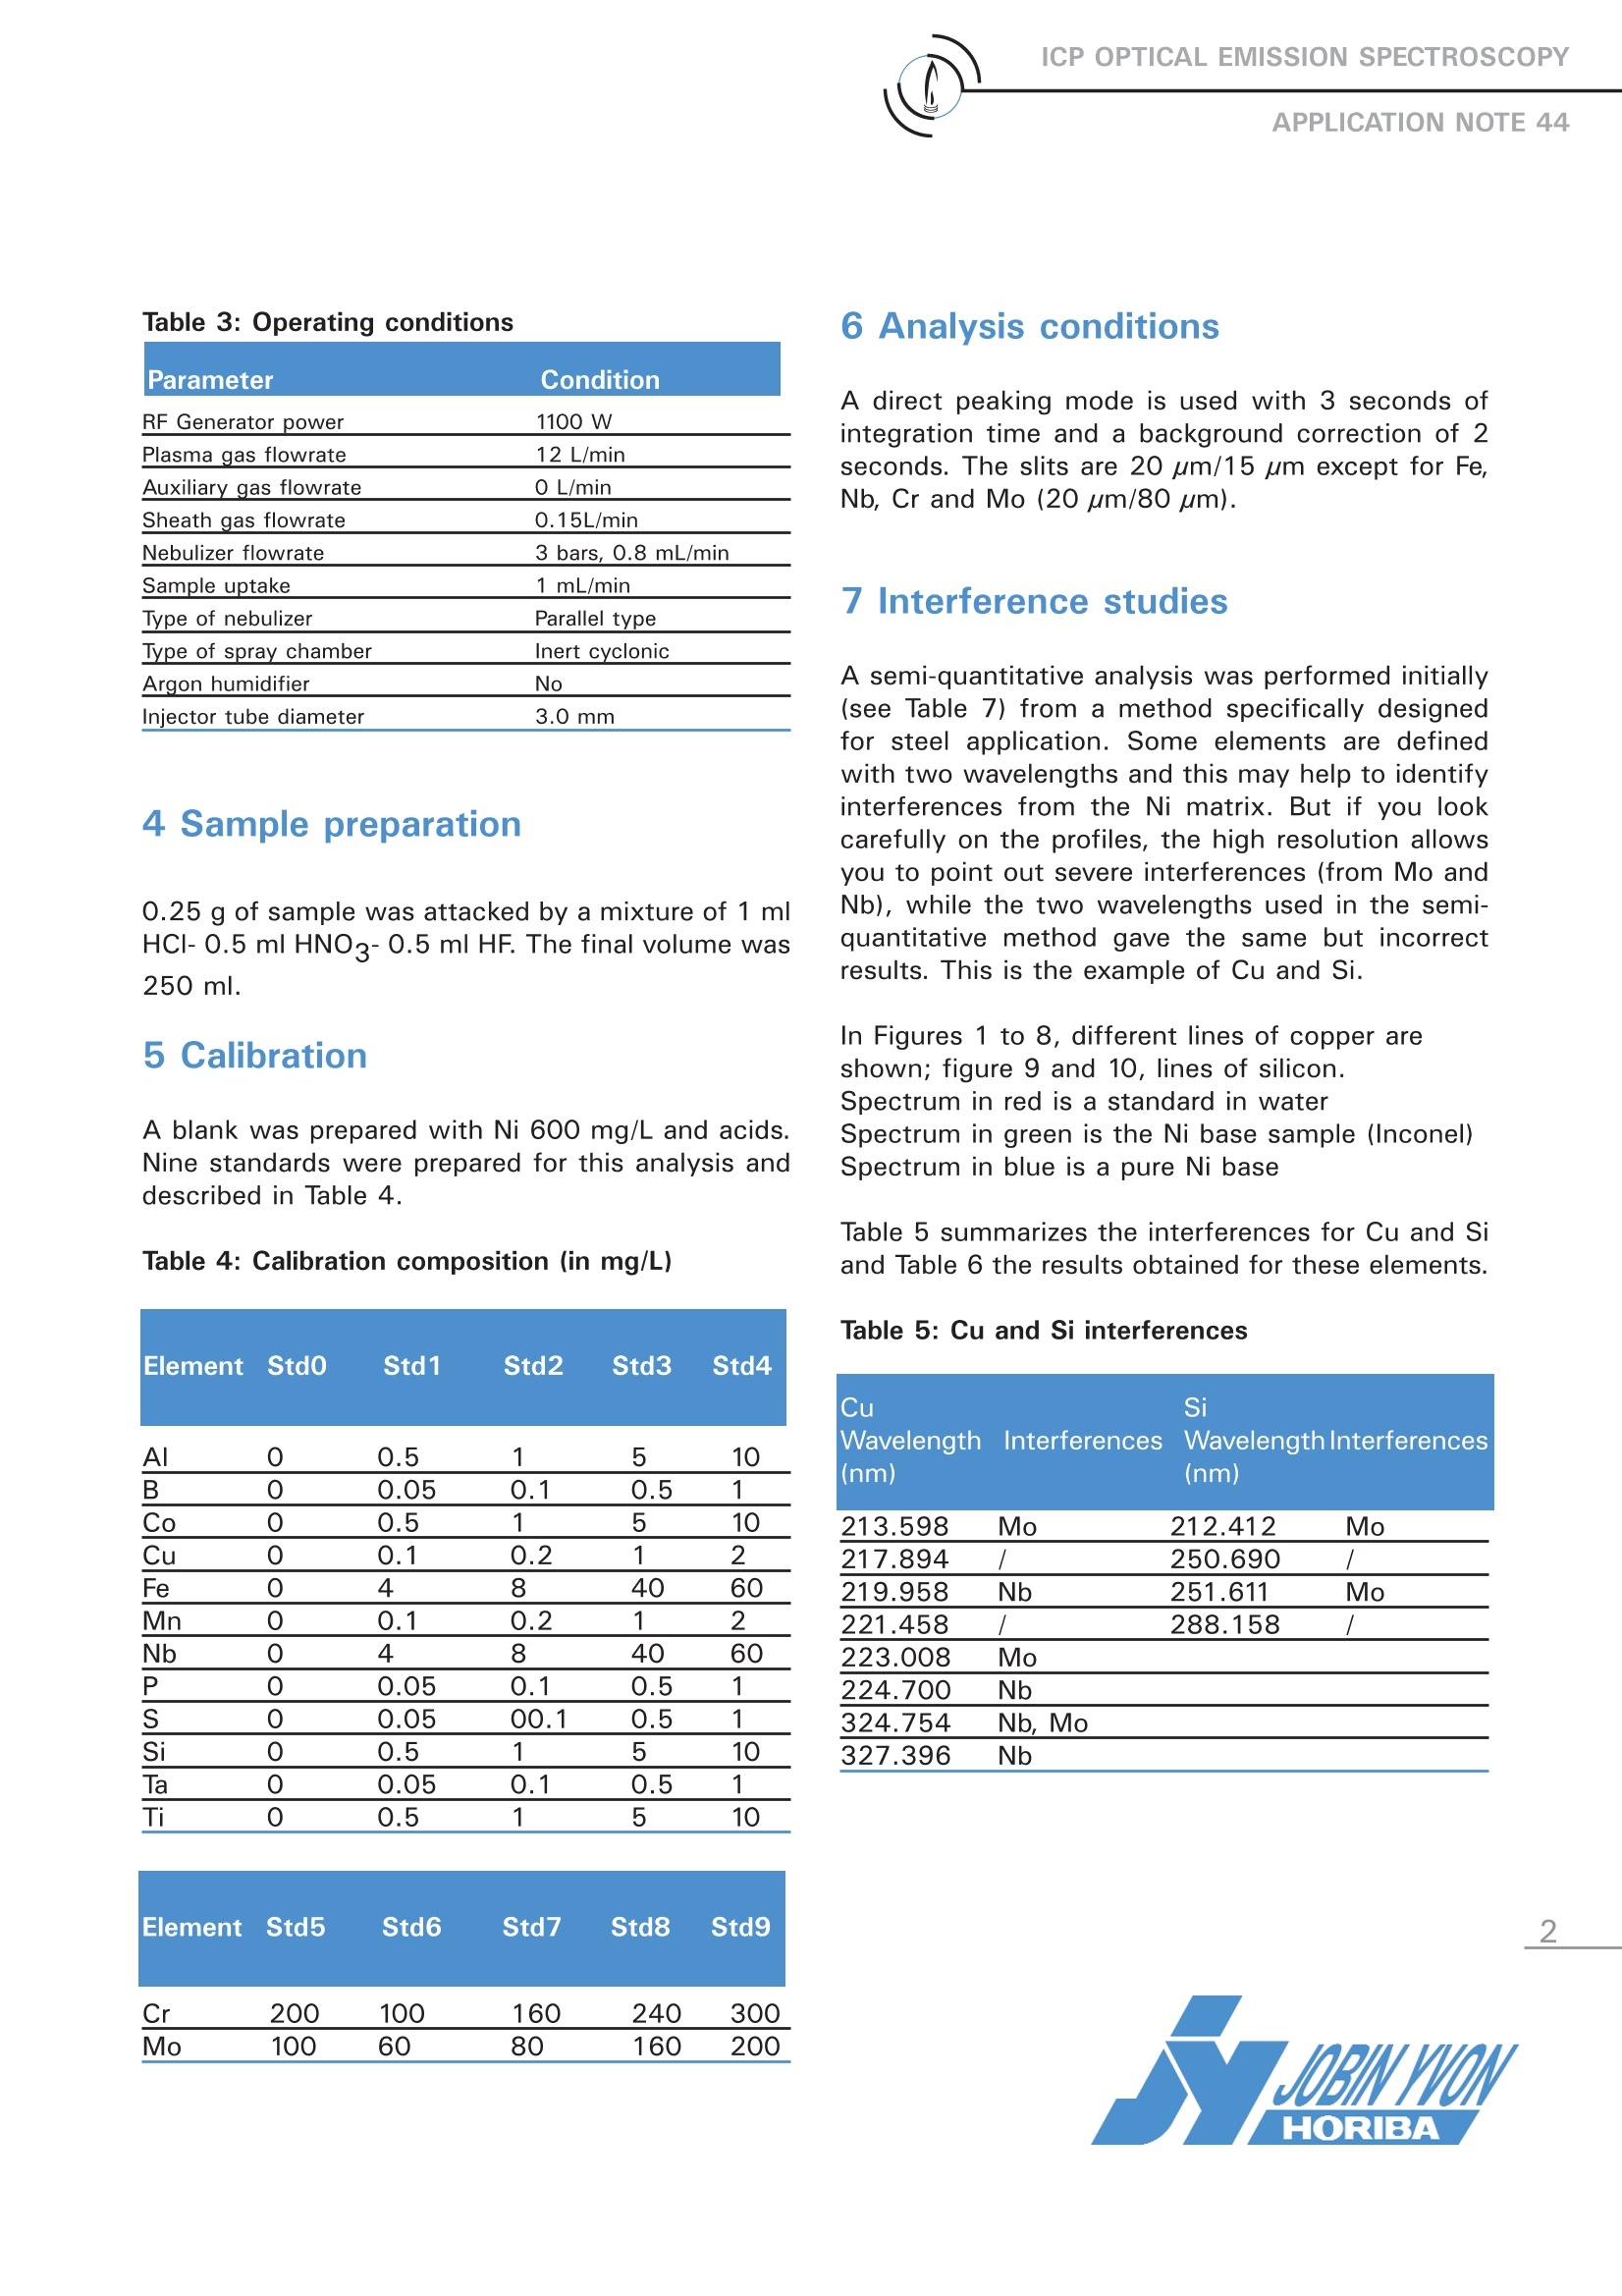
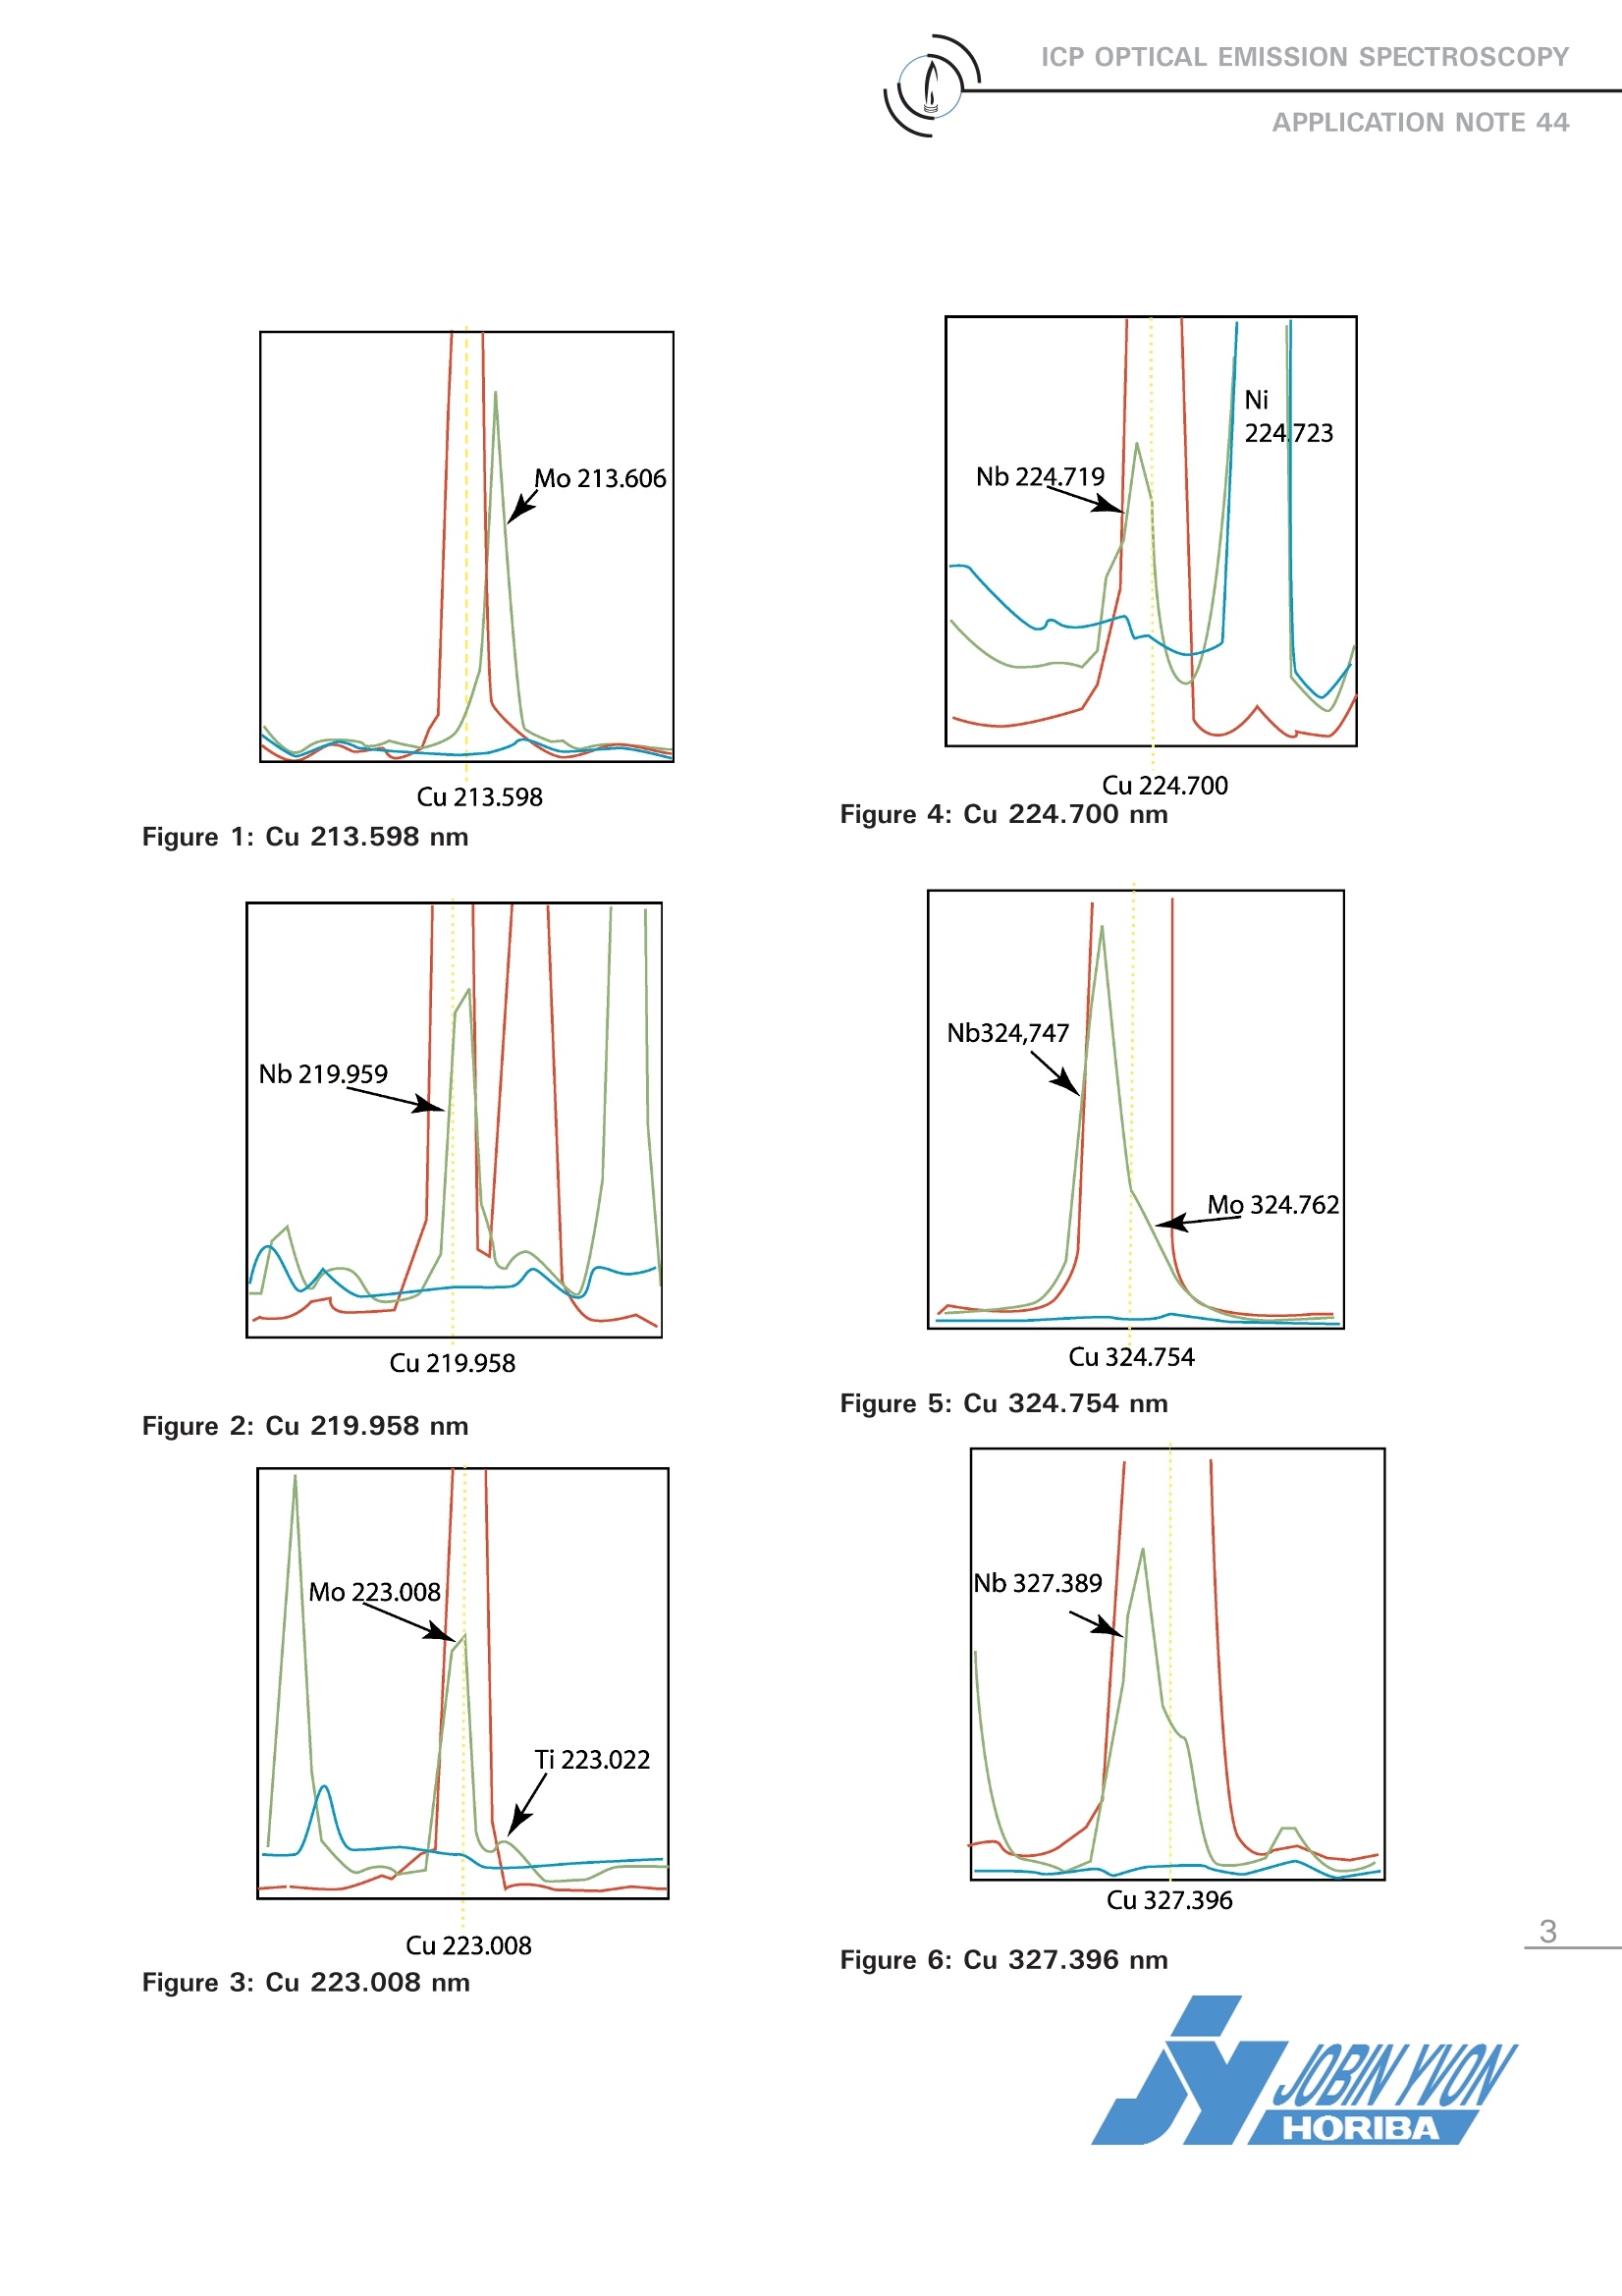
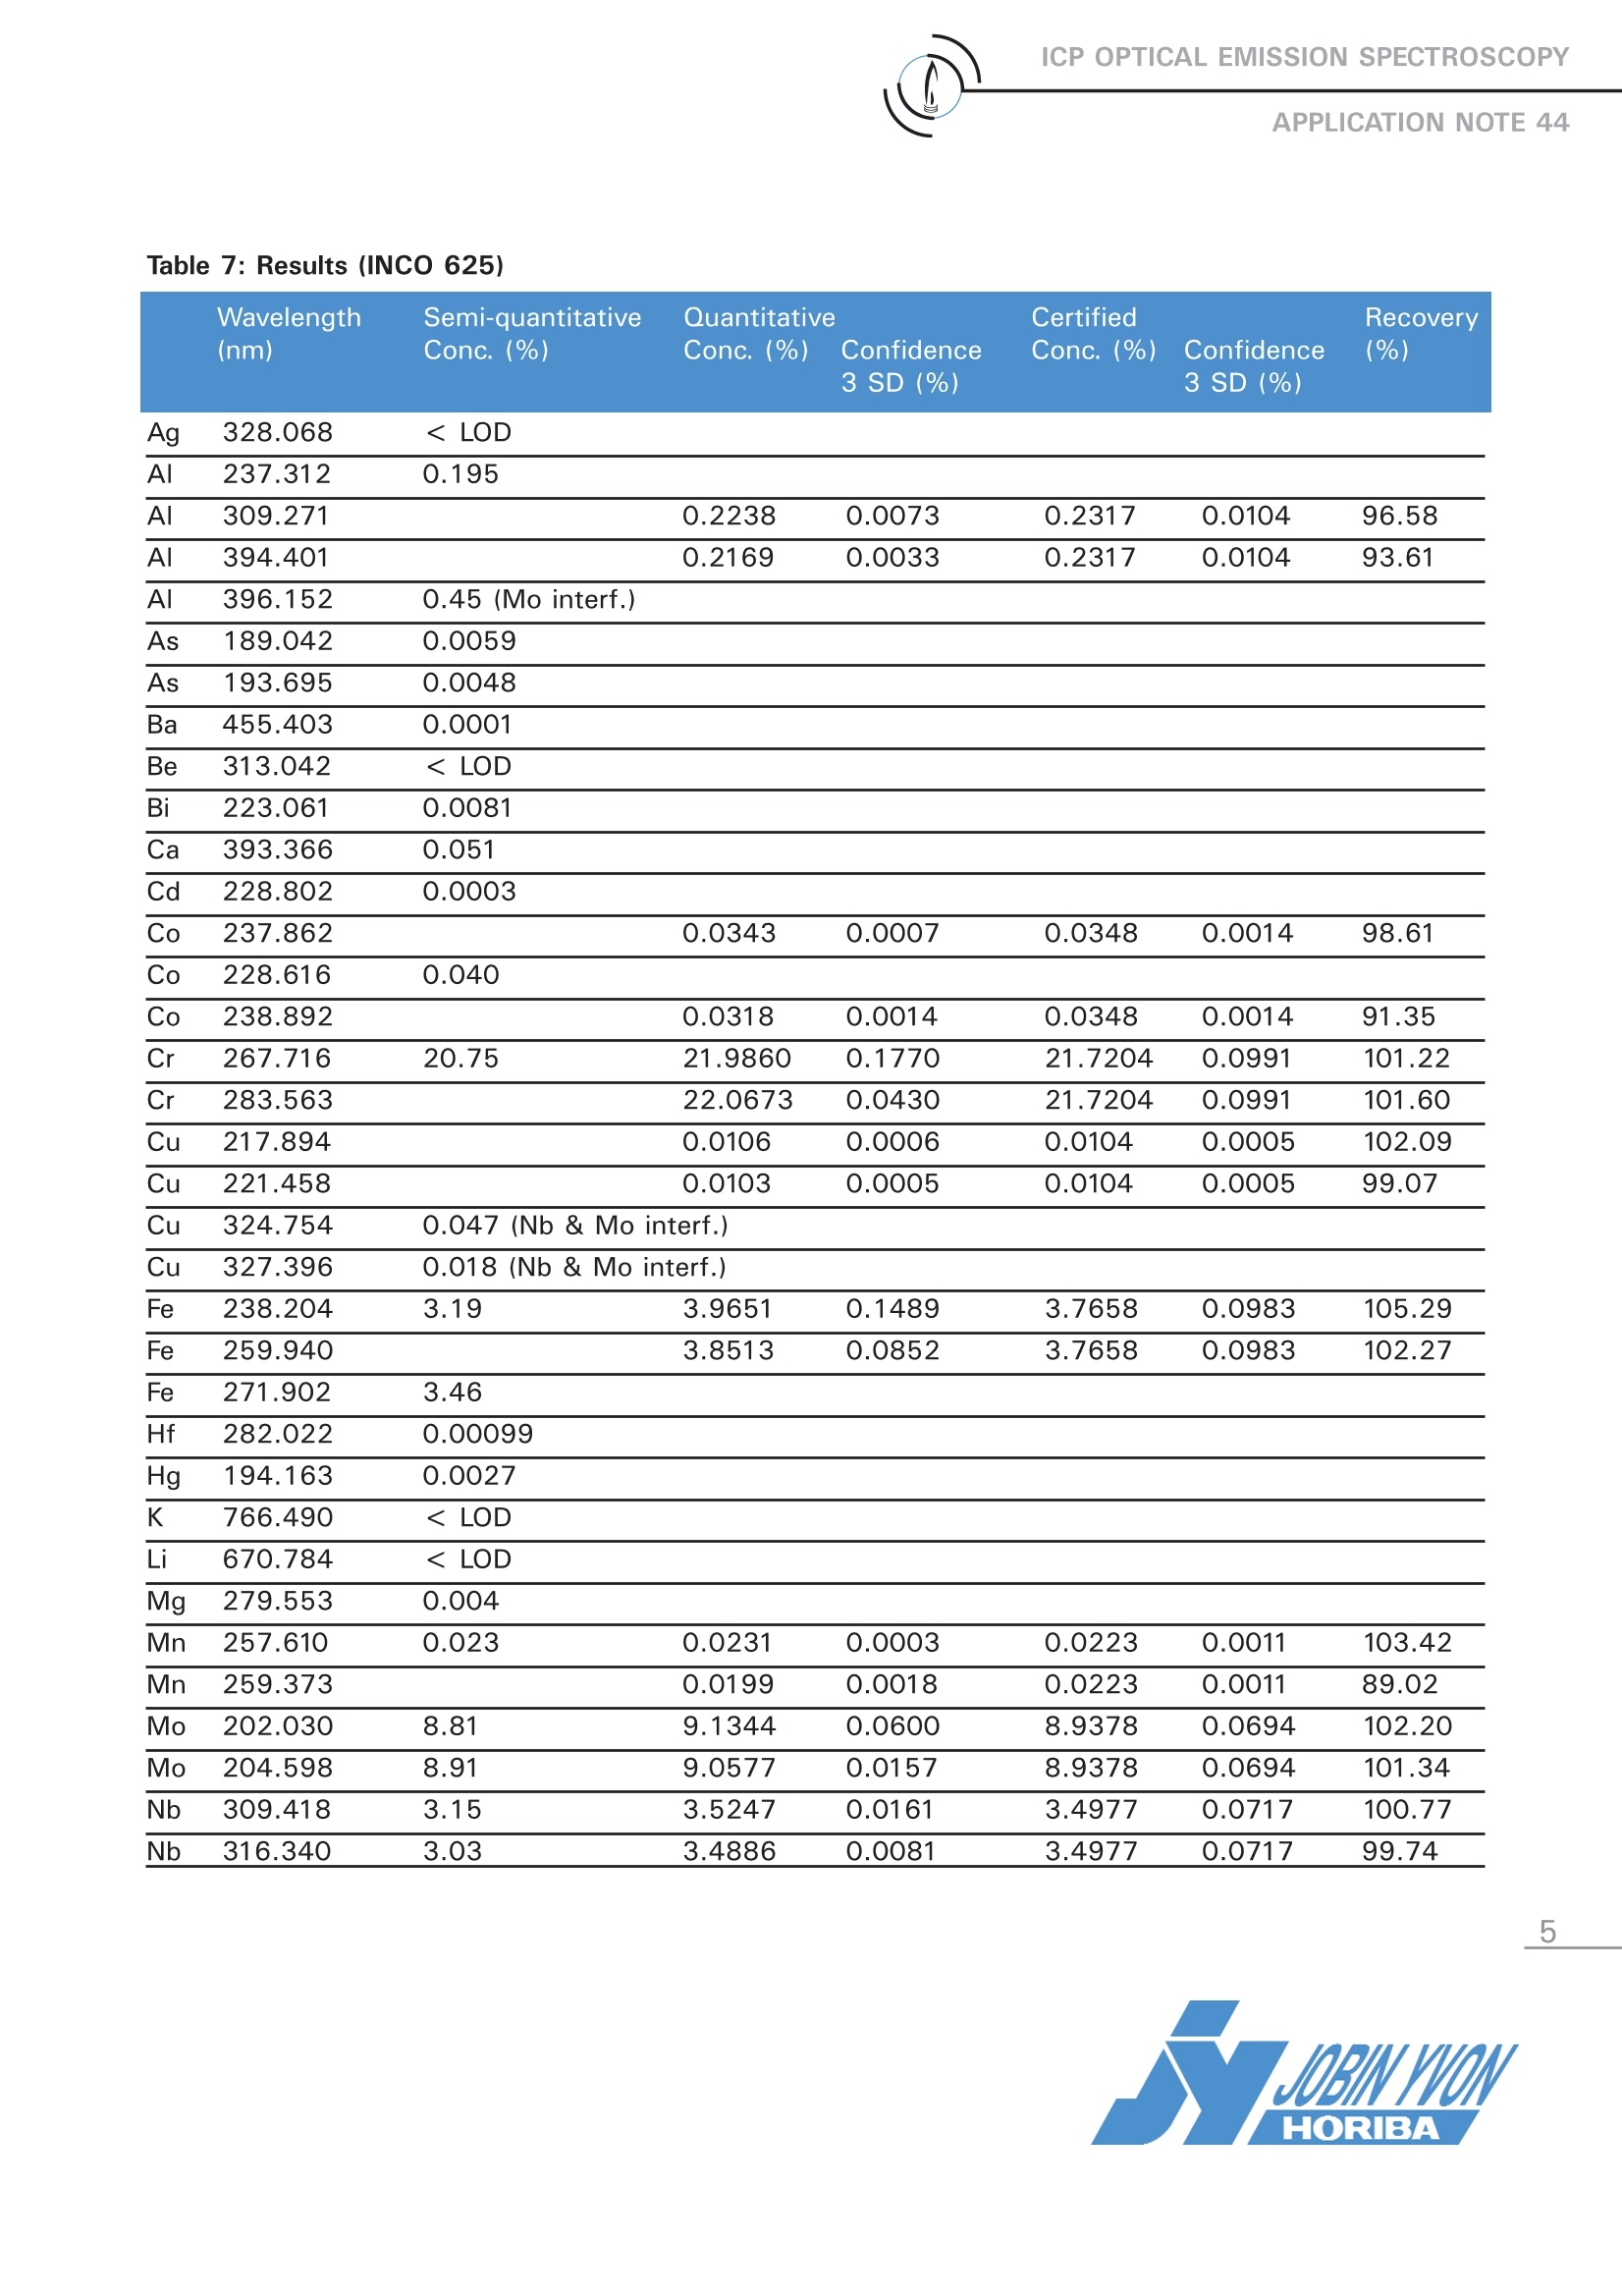
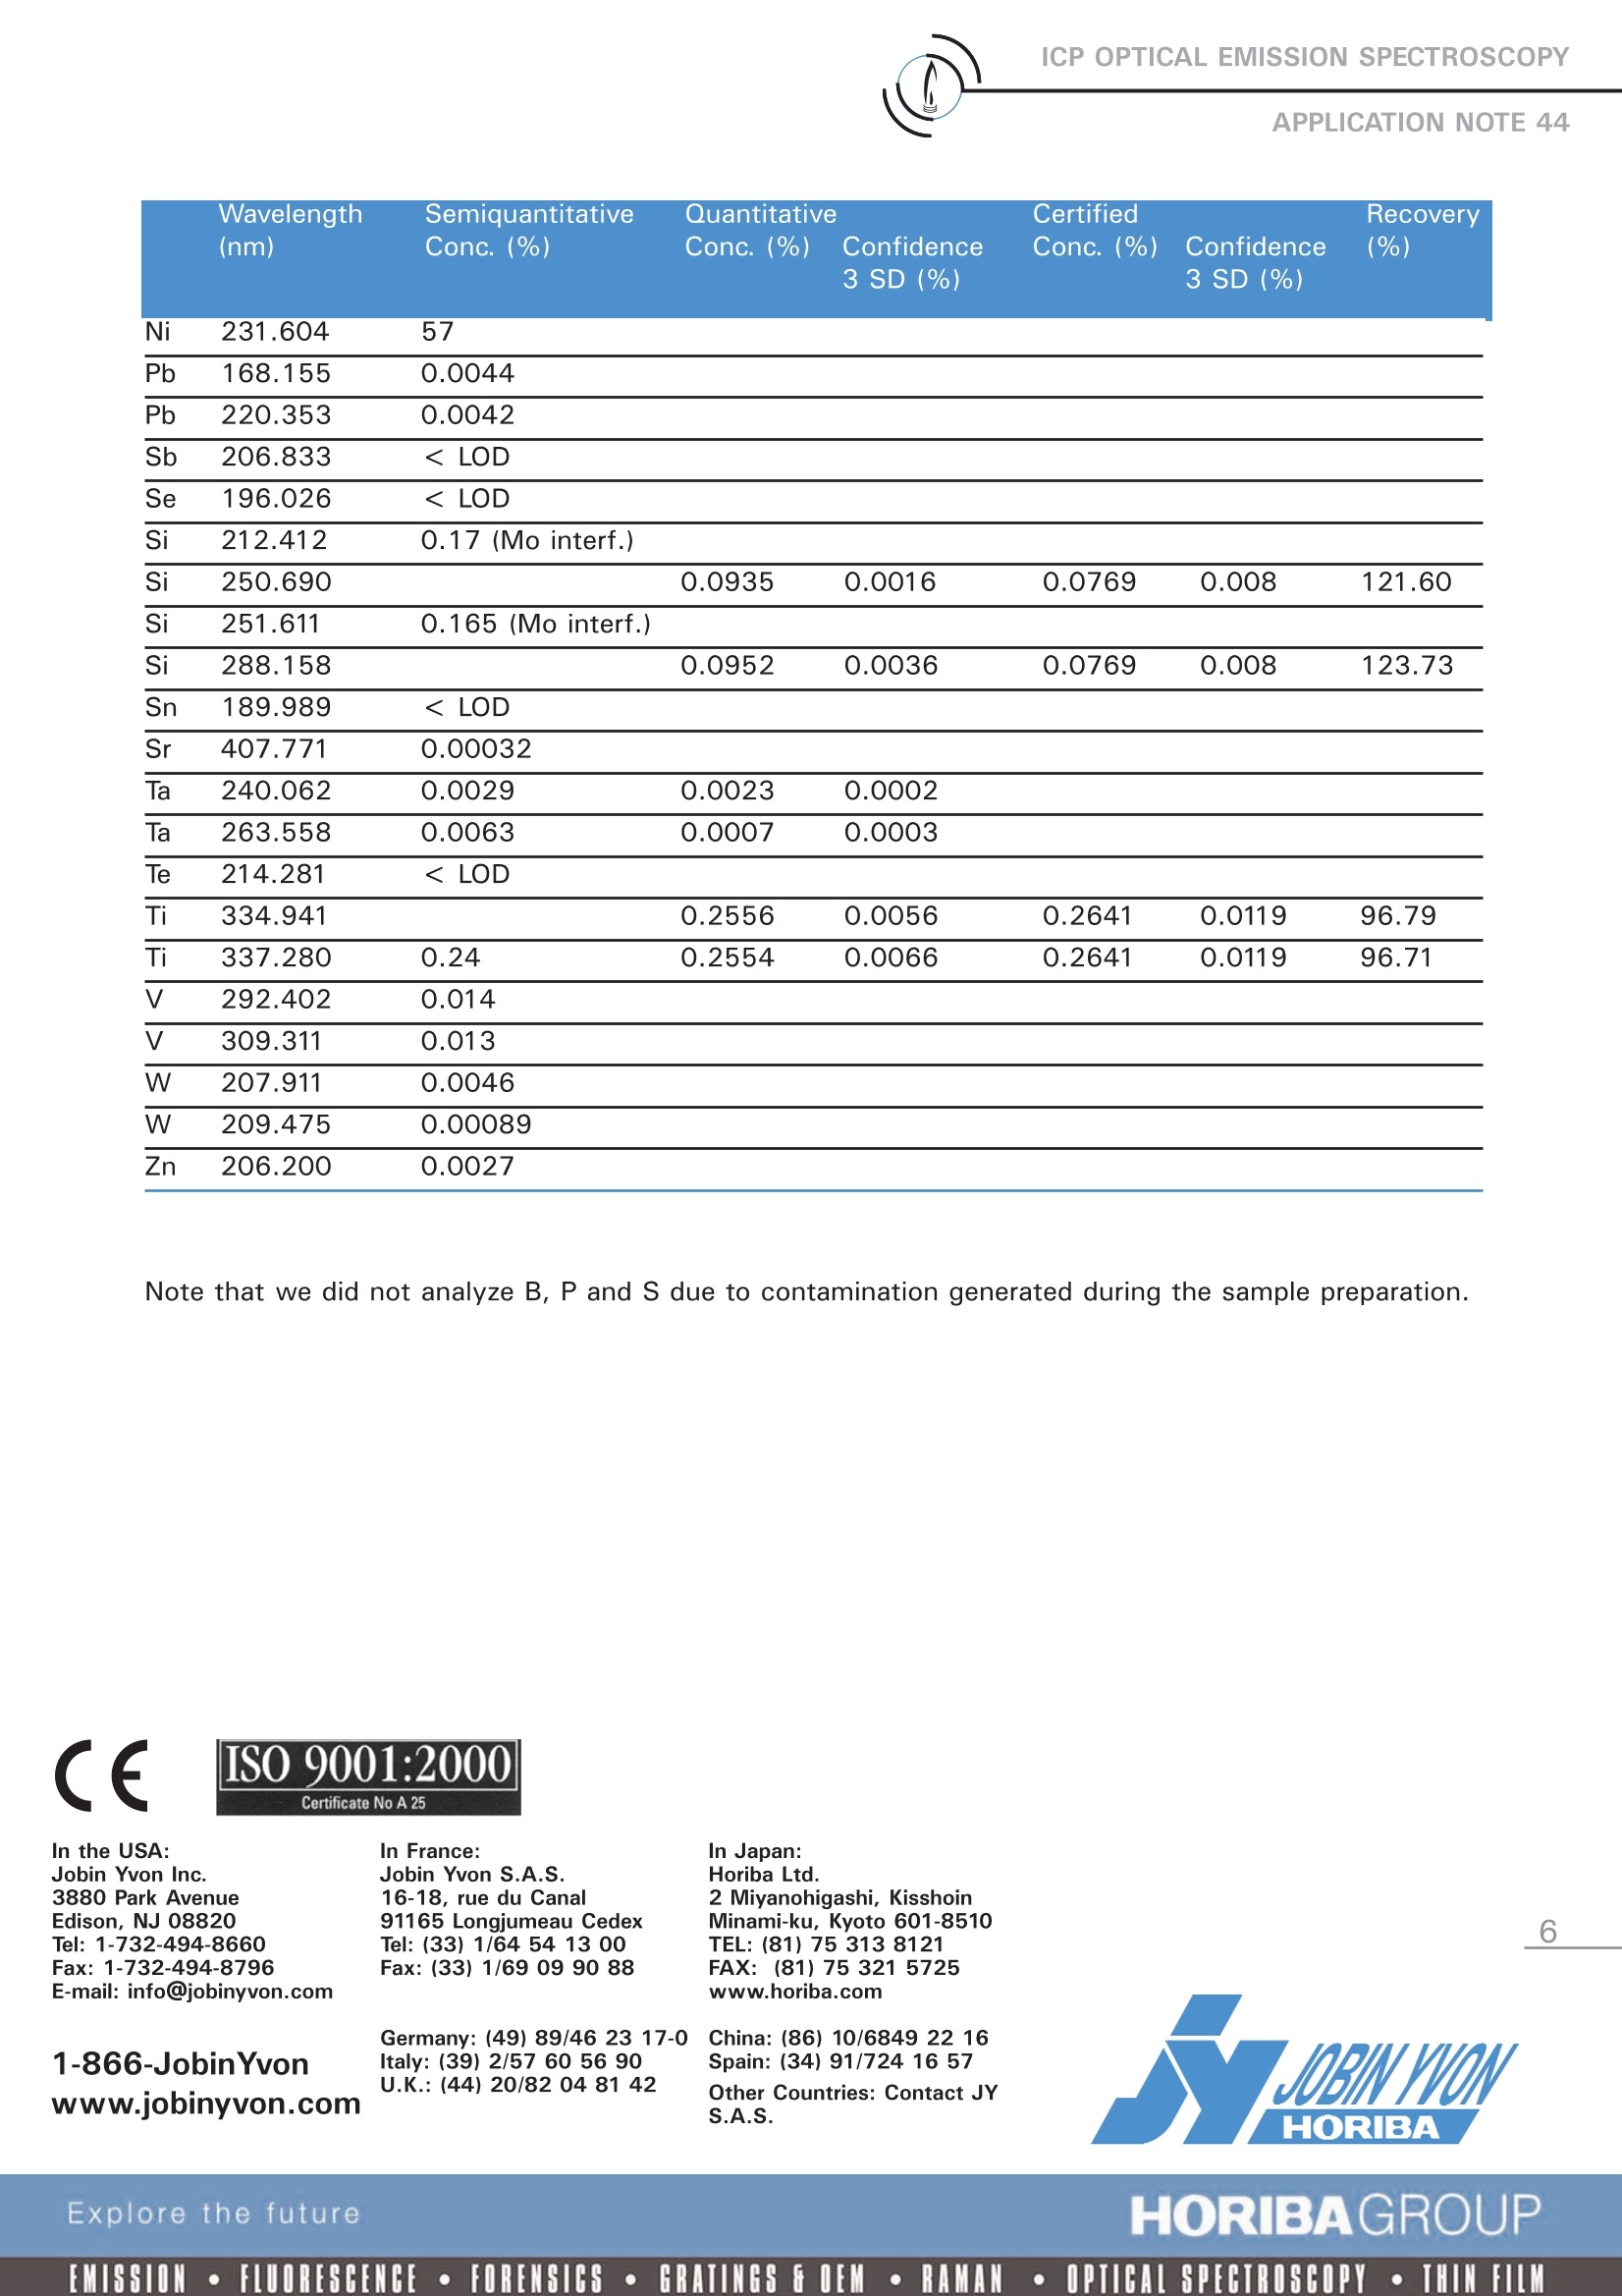
ICP OPTICAL EMISSION SPECTROSCOPYAPPLICATION NOTE 44 Analysis of Nickel Base Samples Agnes Cosnier, Jobin Yvon S.A.S., Horiba Group, Longjumeau, FranceKeywords: nickel base, interference study Nickel base samples were analyzed using ICP-OES and results were compared to certified con-centrations. Even if this type of matrix seemseasy for analysis, a careful study of line selectionis necessary to avoid incorrect concentrations.This study was possible due to the ability of thespectrometer to determine all wavelengths of oneelement and not only the most sensitive lines. 2 Principle 2.1 Technique used The elemental analysis of solutions was under-taken by Inductively Coupled Plasma OpticalEmission Spectrometry(ICP-OES). The sample isnebulized then transferred to an argon plasma. Itis decomposed, atomized and ionized wherebythe atoms and ions are excited. We measure theintensity of the light emitted when the atoms orions return to lower levels of energy. Each ele-ment emits light at characteristic wavelengthsand these lines can be used for quantitativeanalysis after a calibration. 2.2 Wavelength choice The choice of the wavelength in a given matrixcan be made using the“profile"function, or byusing Win-IMAGE, which is rapid semi-quantita-tive analysis mode using multiple wavelengths.The principle is the same in either case: recordthe scans of analytes at low concentration, andof the matrix. By superimposing the spectra, wesee possible interferences. 3 Instrument specification The work was done on a JY ULTIMA 2.The highresolution and selectivity (access to full spec-trum) were key parameters in this case. Thespecifications of this instrument are listed belowin Tables 1 and 2. Table 1: Specification of spectrometer Parameters Specifications Mounting Czerny Turner Focal length 1m Nitrogen purge Yes Variable resolution Yes Grating number of grooves 2400 gr/mm Order 2nd order Table 2: Specification of RF Generator Parameters Specifications Type of generator Solid state Observation Radial Frequency 40.68 MHz Control of gas flowrate by computer Control of pump flow by computer Cooling air The Jobin Yvon AS 421 autosampler was usedfor better reproducibility and fast analysis. The operating conditions are listed in Table 3below. Table 3: Operating conditions Parameter Condition RF Generator power 1100 W Plasma gas flowrate 12 L/min Auxiliary gas flowrate 0 L/min Sheath gas flowrate 0.15L/min Nebulizer flowrate 3 bars, 0.8 mL/min Sample uptake 1 mL/min Type of nebulizer Parallel type Type of spray chamber Inert cyclonic Argon humidifier No Injector tube diameter 3.0 mm 4 Sample preparation 0.25 g of sample was attacked by a mixture of 1 mlHCI-0.5 ml HNO3-0.5 ml HF. The final volume was250 ml. 5 Calibration A blank was prepared with Ni 600 mg/L and acids.Nine standards were prepared for this analysis anddescribed in Table 4. Table 4: Calibration composition (in mg/L) Element Std0 Std1 Std2 Std3 Std4 Al 0.5 1 5 10 B 0.05 0.1 0.5 1 Co 0.5 1 5 10 Cu 0.1 0.2 1 2 Fe 4 8 40 60 Mn 0.1 0.2 1 2 Nb 4 8 40 60 P 0.05 0.1 0.5 1 S 0.05 00.1 0.5 1 Si 0.5 1 5 10 Ta 0.05 0.1 0.5 1 Ti 0.5 1 5 10 Element Std5 Std6 Std7 Std8 Std9 Cr 200 100 160 240 300 Mo 100 60 80 160 200 6 Analysis conditions A direct peaking mode is used with 3 seconds ofintegration time and a background correction of 2seconds. The slits are 20 um/15 um except for Fe,Nb, Cr and Mo (20 um/80 um). 7 Interference studies A semi-quantitative analysis was performed initially(see Table 7) from a method specifically designedfor steel application. Some elements are definedwith two wavelengths and this may help to identifyinterferences from the Ni matrix. But if you lookcarefully on the profiles, the high resolution allowsyou to point out severe interferences (from Mo andNb), while the two wavelengths used in the semi-quantitative method gave the same but incorrectresults. This is the example of Cu and Si. In Figures 1 to 8, different lines of copper areshown; figure 9 and 10, lines of silicon.Spectrum in red is a standard in waterSpectrum in green is the Ni base sample (Inconel)Spectrum in blue is a pure Ni base Table 5 summarizes the interferences for Cu and Siand Table 6 the results obtained for these elements. Table 5: Cu and Si interferences Cu Si Wavelength Interferences WavelengthInterferences (nm) (nm) 213.598 Mo 212.412 Mo 217.894 / 250.690 / 219.958 Nb 251.611 Mo 221.458 / 288.158 / 223.008 Mo 224.700 Nb 324.754 Nb, Mo 327.396 Nb Cu 213.598 Figure 1: Cu 213.598 nm Cu 219.958 Figure 2: Cu 219.958 nm Cu 224.700 Figure 4: Cu 224.700 nm Cu 324.754 Figure 5: Cu 324.754 nm Si 212.412 Cu 217.894 Figure 7: Cu 217.894 nm Figure 9: Si 212.412 nm Cu 221.458 Si 251.611 Figure 8: Cu 221.458 nm Figure 10: Si 251.611 nm Table 6: Results for Si and Cu 9 Conclusion Wavelength Quant. Semi-Quant Interfe (nm) Conc. Conc (%) -rence (%) Cu 217.894 0.0106 Cu 221.458 0.0103 Cu 324.754 0.047 Nb Sil 212.412 0.17 Mo Si 250.69 0.0935 Si 251.611 0.165 Mo Si 288.158 0.0952 The experiment demonstrates the advantage of fullspectrum access with a high resolution spectrome-ter in the development of a quantitative method. Theresolution on the JY ULTIMA 2 is sufficient that lineselection was made with no interelement correctionnecessay. 8 Results Results obtained on a certified sample for all ele-ments are shown in Table 7. It summarizes semi-quantitative results, quantitative results and recoveryfactors (obtained concentration /certified concentra-tion*100). Table 7: Results (INCO 625) Wavelength (nm) Semiquantitative Conc.(%) Quantitative Conc.(%) Confidence 3 SD (%) Certified Conc. (%) Confidence 3 SD (%) Recovery (%) Ni 231.604 57 Pb 168.155 0.0044 Pb 220.353 0.0042 Sb 206.833 < LOD Se 196.026
确定
还剩4页未读,是否继续阅读?

产品配置单

HORIBA(中国)为您提供《镍基样品中Cu元素检测方案(ICP-AES)》,该方案主要用于镍中含量分析检测,参考标准--,《镍基样品中Cu元素检测方案(ICP-AES)》用到的仪器有HORIBA Ultima Expert高性能ICP光谱仪
相关方案
更多
该厂商其他方案
更多