


方案详情
文
Geological samples contain major elements at high concentration present as oxides of Al, Ca,K, Mg, etc. and traces of rare earth elelements.
Using a fast and simple semiquantitative method on a high-resolution ICP spectrometer with a robust radial plasma view we can obtain a complete sample screening with excellent accuracy for both trace and major elements present.
This application note will describe the semiquantitative method as performed on the JY ULTIMA 2 ICP spectrometer.
方案详情

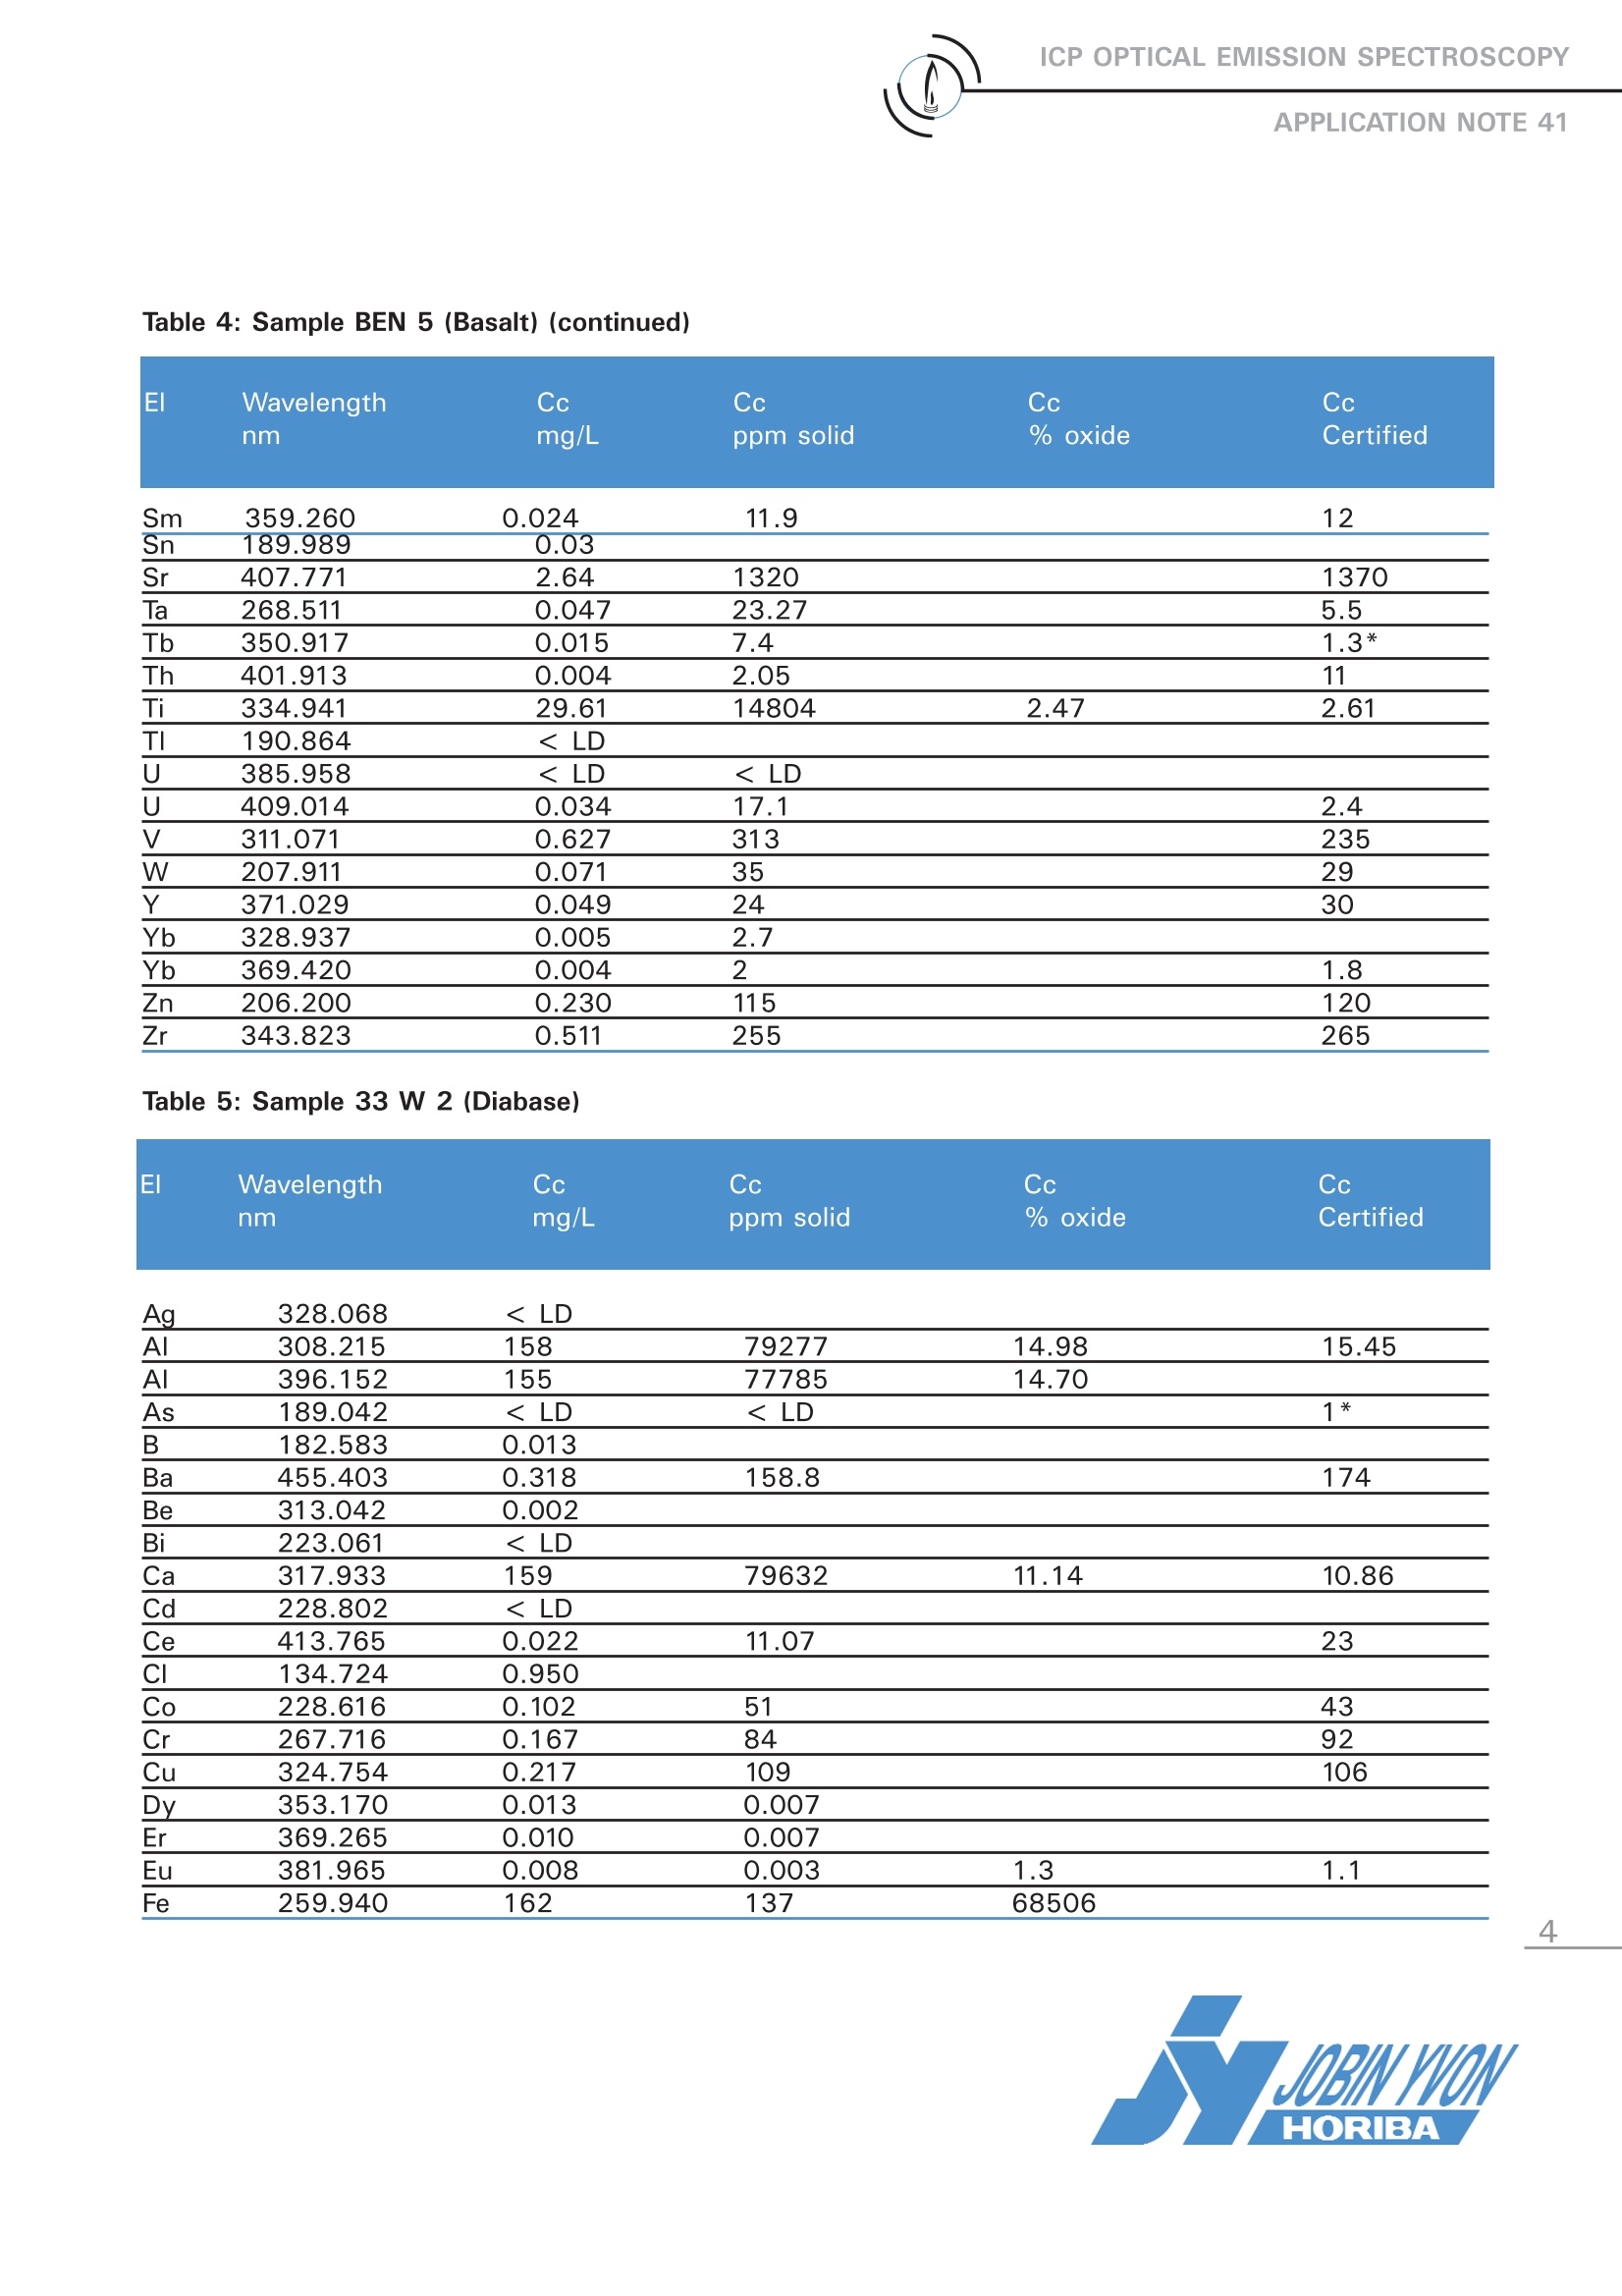
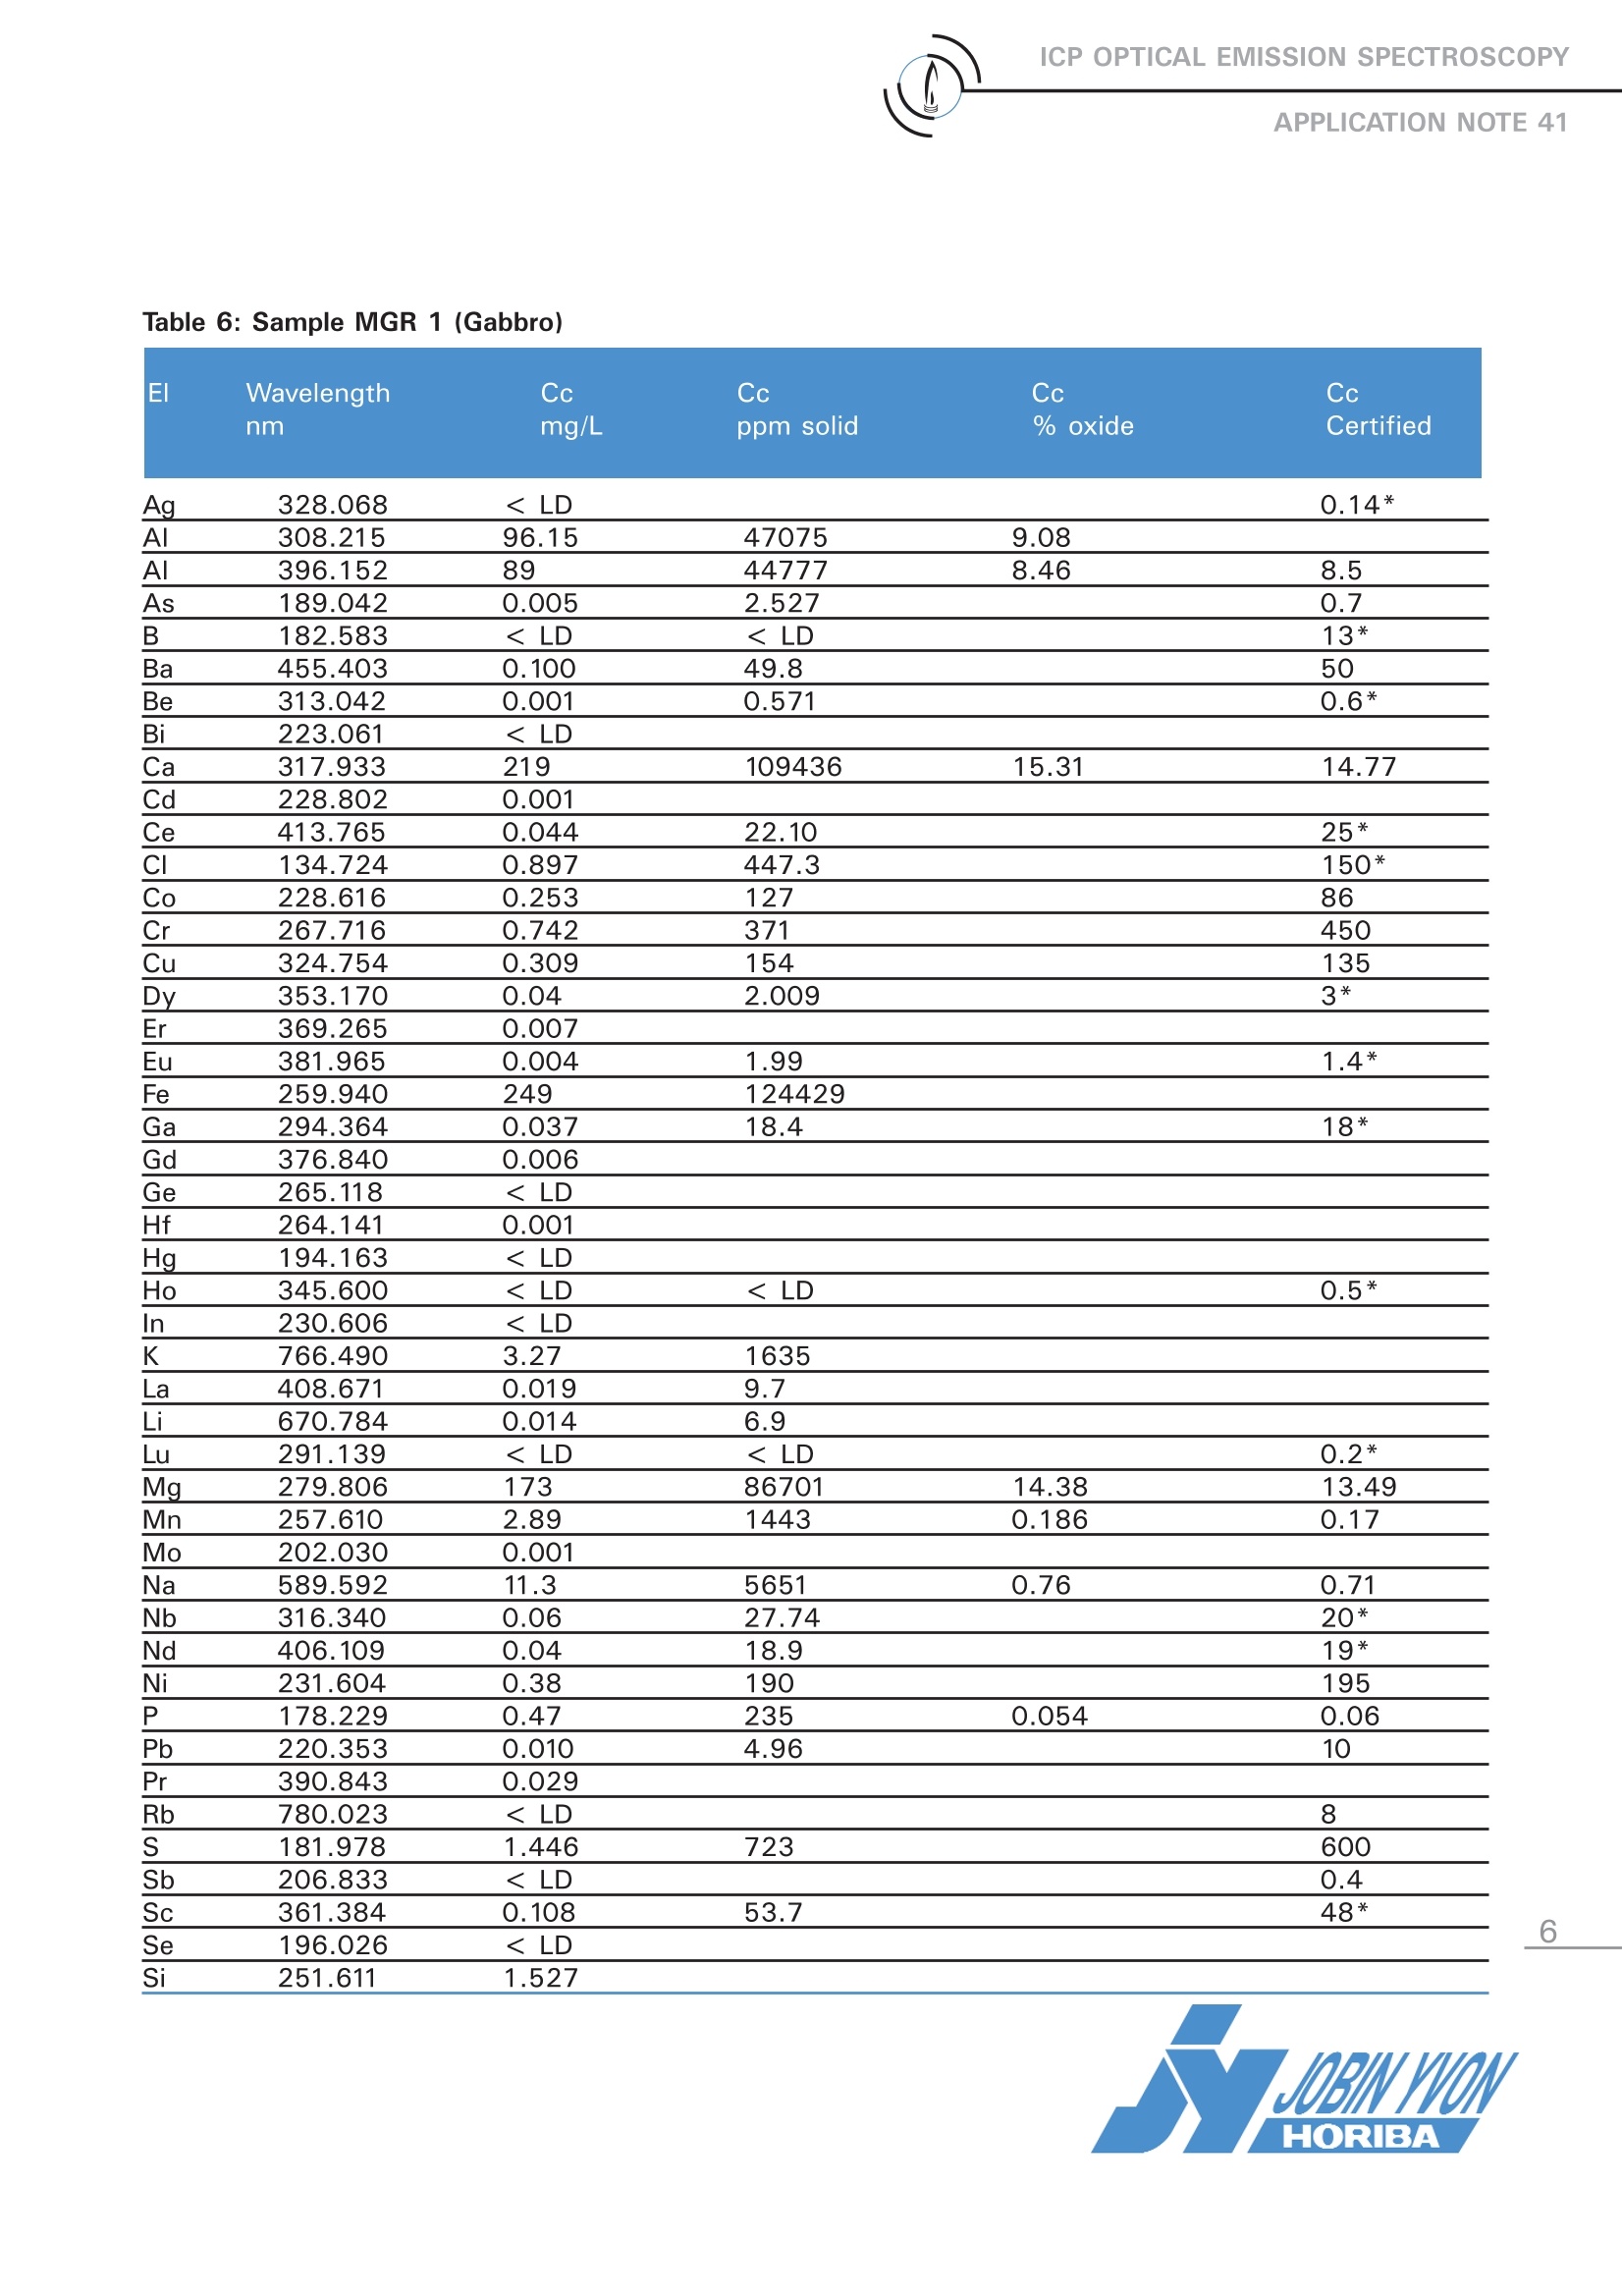
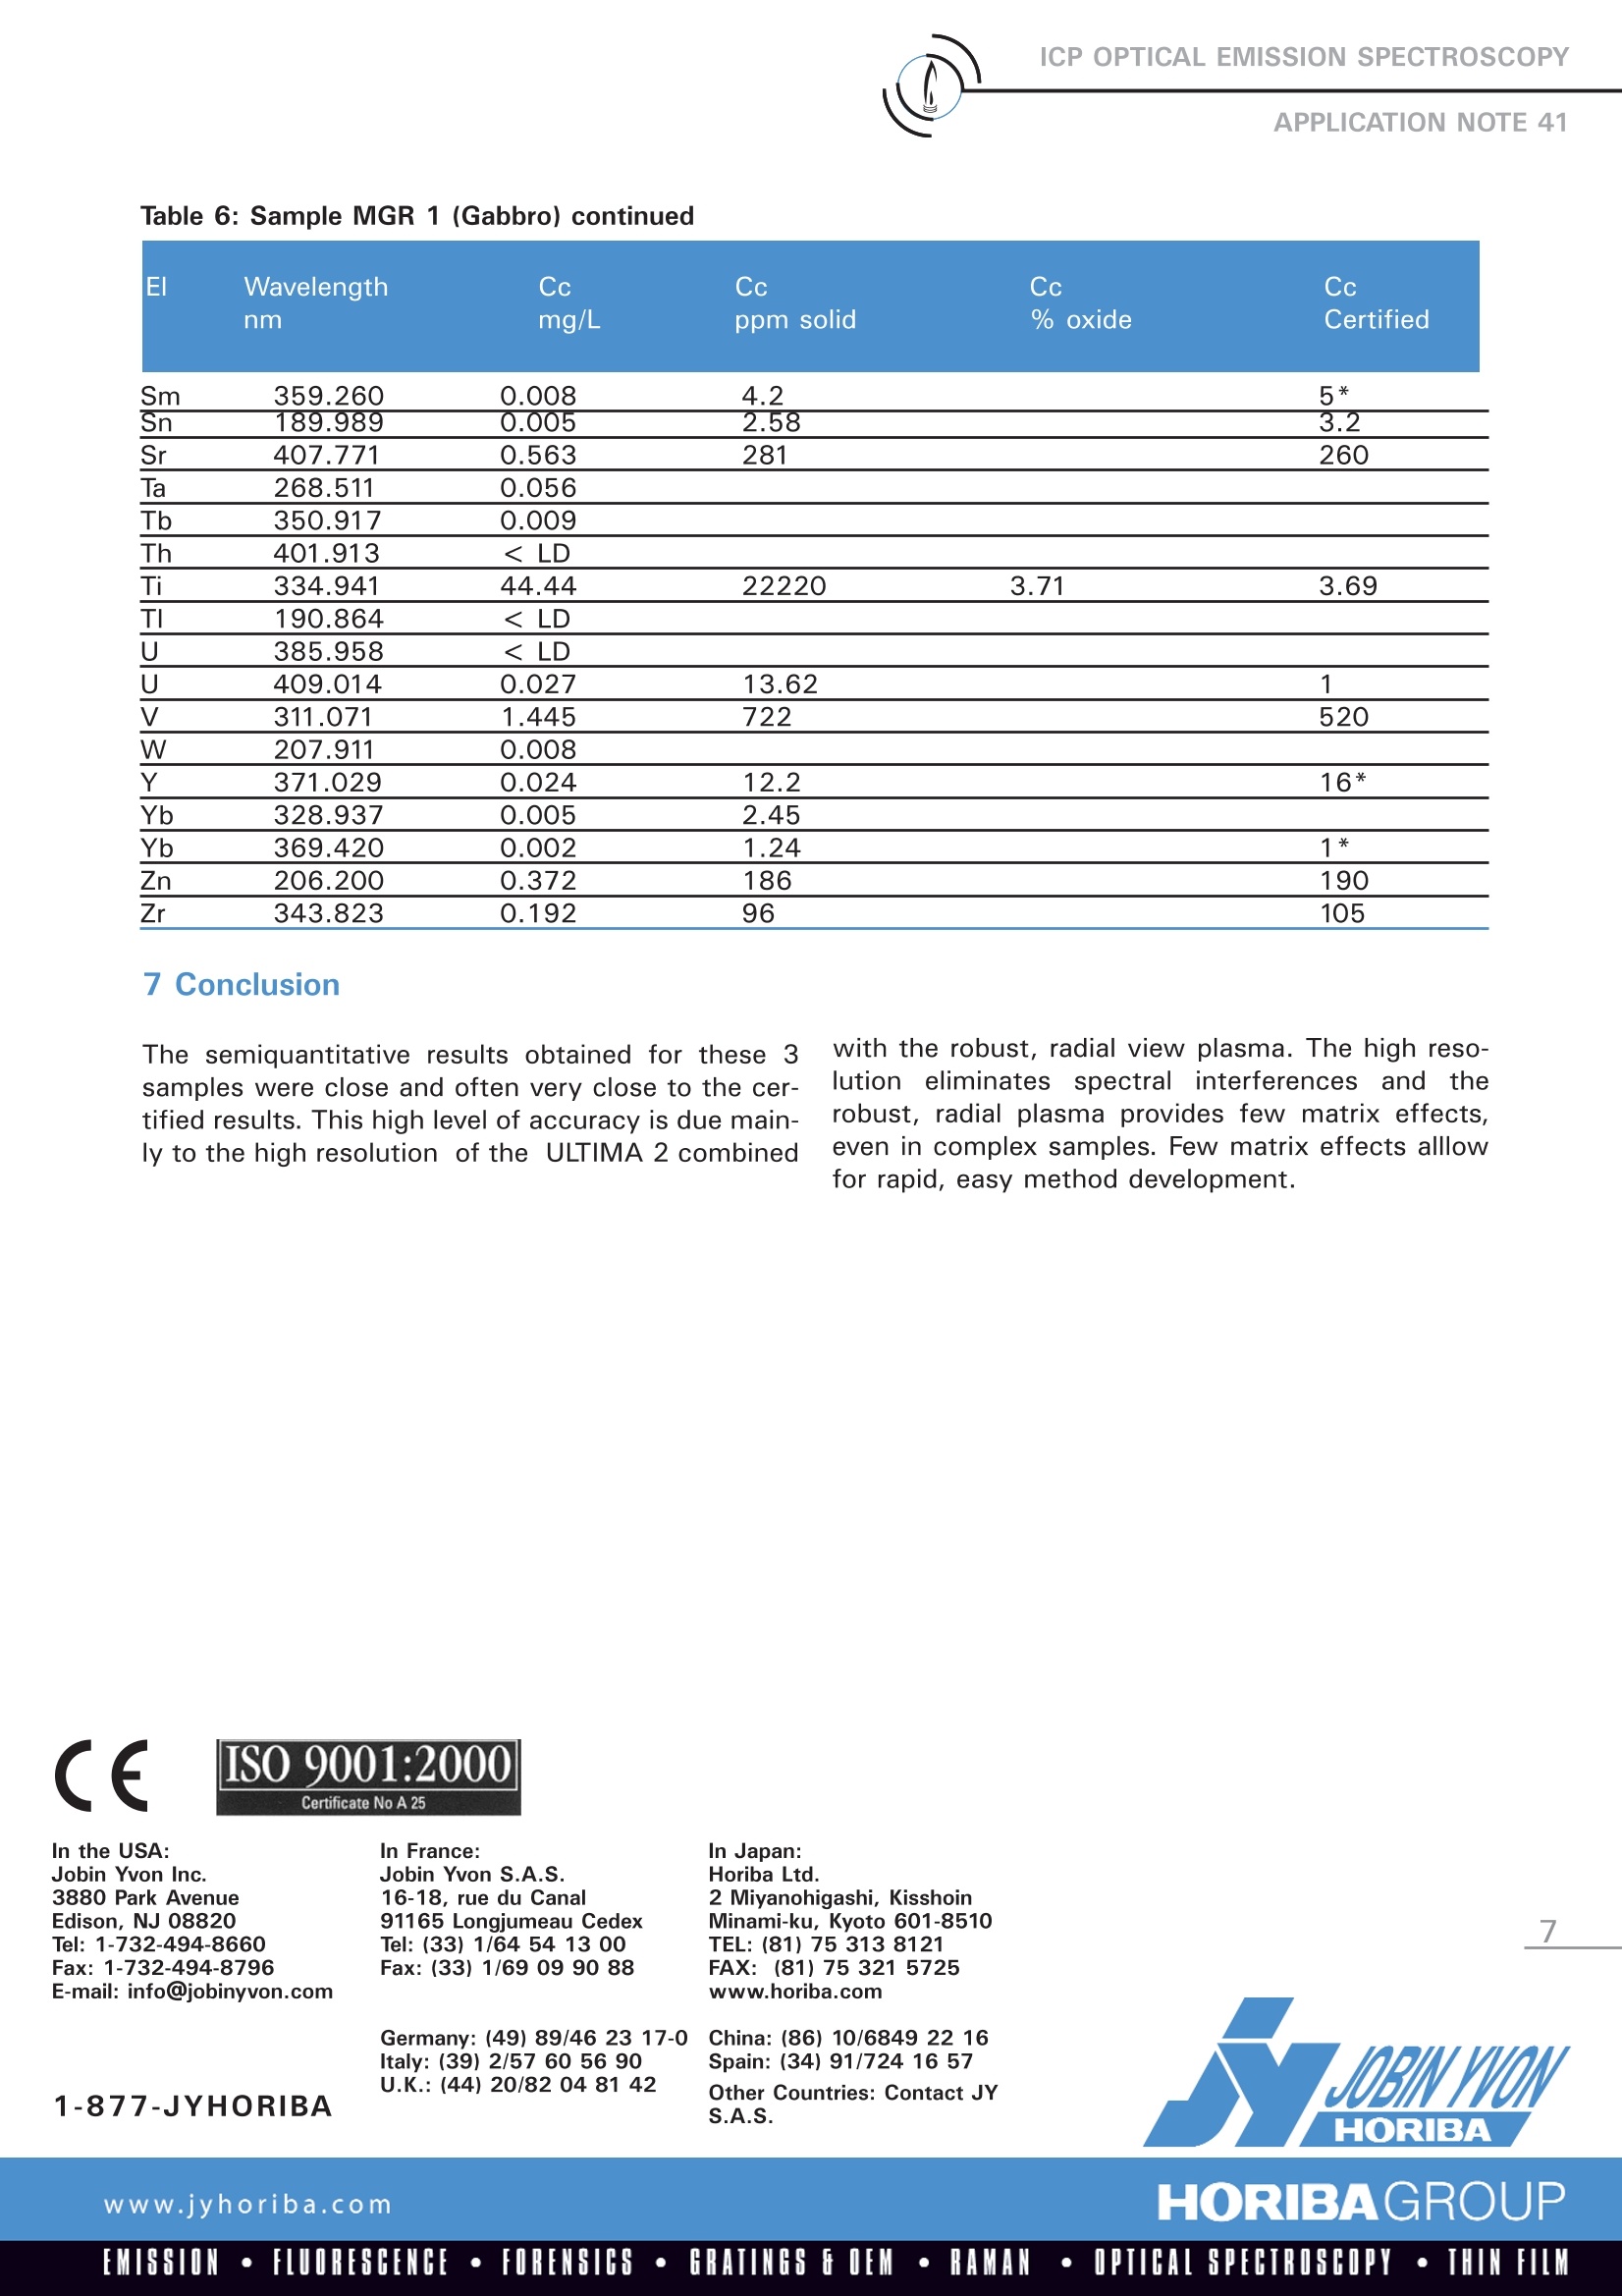
ICP OPTICAL EMISSION SPECTROSCOPYAPPLICATION NOTE 41 Interest of a Semi-Quantitative Method for Geological Samples Agnes Cosnier Jobin Yvon S.A.S., Horiba Group Longjumeau, France 1 Introduction Geological samples contain major elements athigh concentration present as oxides of Al, Ca,K, Mg, etc. and traces of rare earth elelements.Using a fast and simple semiquantitative methodon a high-resolution ICP spectrometer with arobust radial plasma view we can obtain a com-plete sample screening with excellent accuracyfor both trace and major elements present. This application note will describe the semiquan-titative method as performed on the JY ULTIMA2 ICP spectrometer. 2 Principle 2.1 Technique used The elemental analysis of solutions was under-taken by Inductively Coupled Plasma OpticalEmission Spectrometry (ICP-OES). The sample isnebulized then transferred to an argon plasma. Itis decomposed, atomized and ionized wherebythe atoms and ions are excited. We measure theintensity of the light emitted when the atoms orions return to lower levels of energy.y.EEach ele-ment emits light at characteristic wavelengthsand these lines can be used for quantitativeanalysis after a calibration. inthis paperwe(describea semiquantitativeanalysis where many elemental wavelengths arecalibrated over a general concentration range toprovide a screening of the sample. 2.2 Wavelength choice The choice of the wavelength in a given matrixcan be made using the profile function, or byusing Win-IMAGE, which is rapid semi-quantita-tive analysis mode using multiple wavelengths.The principle is the same in either case: recordthe scans of analytes at low concentration, andof the matrix. By superimposing the spectra, wesee possible interferences. 3 Instrument specification The work was done on a JY ULTIMA 2.The spec-ifications of this instrument are listed below inTables 1 and 2. To analyze rare earth elements a high-resolutionspectrometer is required in the 300 - 420 nmrange. For this reason, we configure the ULTIMA 2with a dual grating featuring a 4320 gr/mm grat-ing providing 5 pm of resolution from 160 (120*)to 420 nm and a 2400 gr/mm grating providing10 pm of resolution from 420 to 900 nm. Table 1: Specification of spectrometer Parameters Specifications Mounting Czerny Turner Focal length 1m Nitrogen purge Yes Variable resolution Yes Grating number of grooves 4320 gr/mm 160-420 2400 gr/mm 420-900 Plasma viewing radial Table 2: Specification of RF Generator Parameters Specifications Type of generator Solid state Observation Radial Frequency 40.68 MHz Control of gas flowrate by computer Control of pump flow by computer Cooling air (*) if ULTIMA 2 is equipped with far UV option. 4 Operating conditions The operating conditions are listed in Table 3 below. Table 3: Operating conditions Parameter Condition RF Generator power 1100 W Plasma gas flowrate 12 L/min Auxiliary gas flowrate 0 L/min Sheath gas flowrate 0.2 L/min Nebulizer flowrate 2.9 bars, 0.61 ml/min Sample uptake 1 mL/min Type of nebulizer Meinhard (C1 type) Type of spray chamber Cyclonic Argon humidifier No Injector tube diameter 3.0 mm The semi-quantitative method is simply calibratedwith 2 points in deionized water. The differentstandards used are fromSPEXCertiprep:v QC21: 5 mg/l and Zr spiked at 5 mg/lv QC7: 5 mg/l excepted 50 for K and 2.5 for andRb spiked at 50vNb, P, S, W, Ge, Ta: 5 mg/lvFHg, Sn: 1 mg/l以Multi-element solution: 1, 1 mg/l (rare earth ele- ments, Claritas) v Bi, Ga, In, U: 5 mg/I Little or no matrix effects are seen through thecombination of radial plasma viewing and a robustplasma. The high optical resolution allows for analy-sis of even complex samples from a calibration inwater. 5 Sample preparation 0.1 g of sample was diluted in 50 ml. First it isdissolved in HF/HNO3, evaporated to dryness andthen completed with 45 % HNO3. This sample preparation allows the analysis of allthe elements, except Si, which is lost as SiF6. 6 Results 3 samples were analyzed: -BEN 5 Basalt -33 W 2 Diabas -MRG 1 Gabbro The results are displayed in Tables 4 through 6 onthe following pages. Each table compared the con-centration anlayzed in solution, in the solid and atthe percent of oxide, as well as the certifed con-centration when available. Table 4: Sample BEN 5 (Basalt) Table 4: Sample BEN 5 (Basalt) (continued) El Wavelength Cc Cc Cc Cc nm mg/L ppm solid % oxide Certified Sm 359.260 0.024 11.9 12 Sn 189.989 0.03 Sr 407.771 2.64 1320 1370 Ta 268.511 0.047 23.27 5.5 Tb 350.917 0.015 7.4 1.3* Th 401.913 0.004 2.05 11 Ti 334.941 29.61 14804 2.47 2.61 TI 190.864 < LD U 385.958
确定


还剩5页未读,是否继续阅读?

产品配置单

HORIBA(中国)为您提供《如何对地质样品进行半定量分析》,该方案主要用于稀土/稀有金属中--检测,参考标准--,《如何对地质样品进行半定量分析》用到的仪器有HORIBA Ultima Expert高性能ICP光谱仪
相关方案
更多
该厂商其他方案
更多