


方案详情
文
Near-IR spectra—including matrix scans—from single-wall carbon nanotubes are easily recorded and analyzed using the NanoLog® spectrofluorometer with our Nanosizer™ software. The NanoLog® is useful in a wide array of research related to nanostructures, quantum dots, biomedical research, and materials science for the future.
方案详情

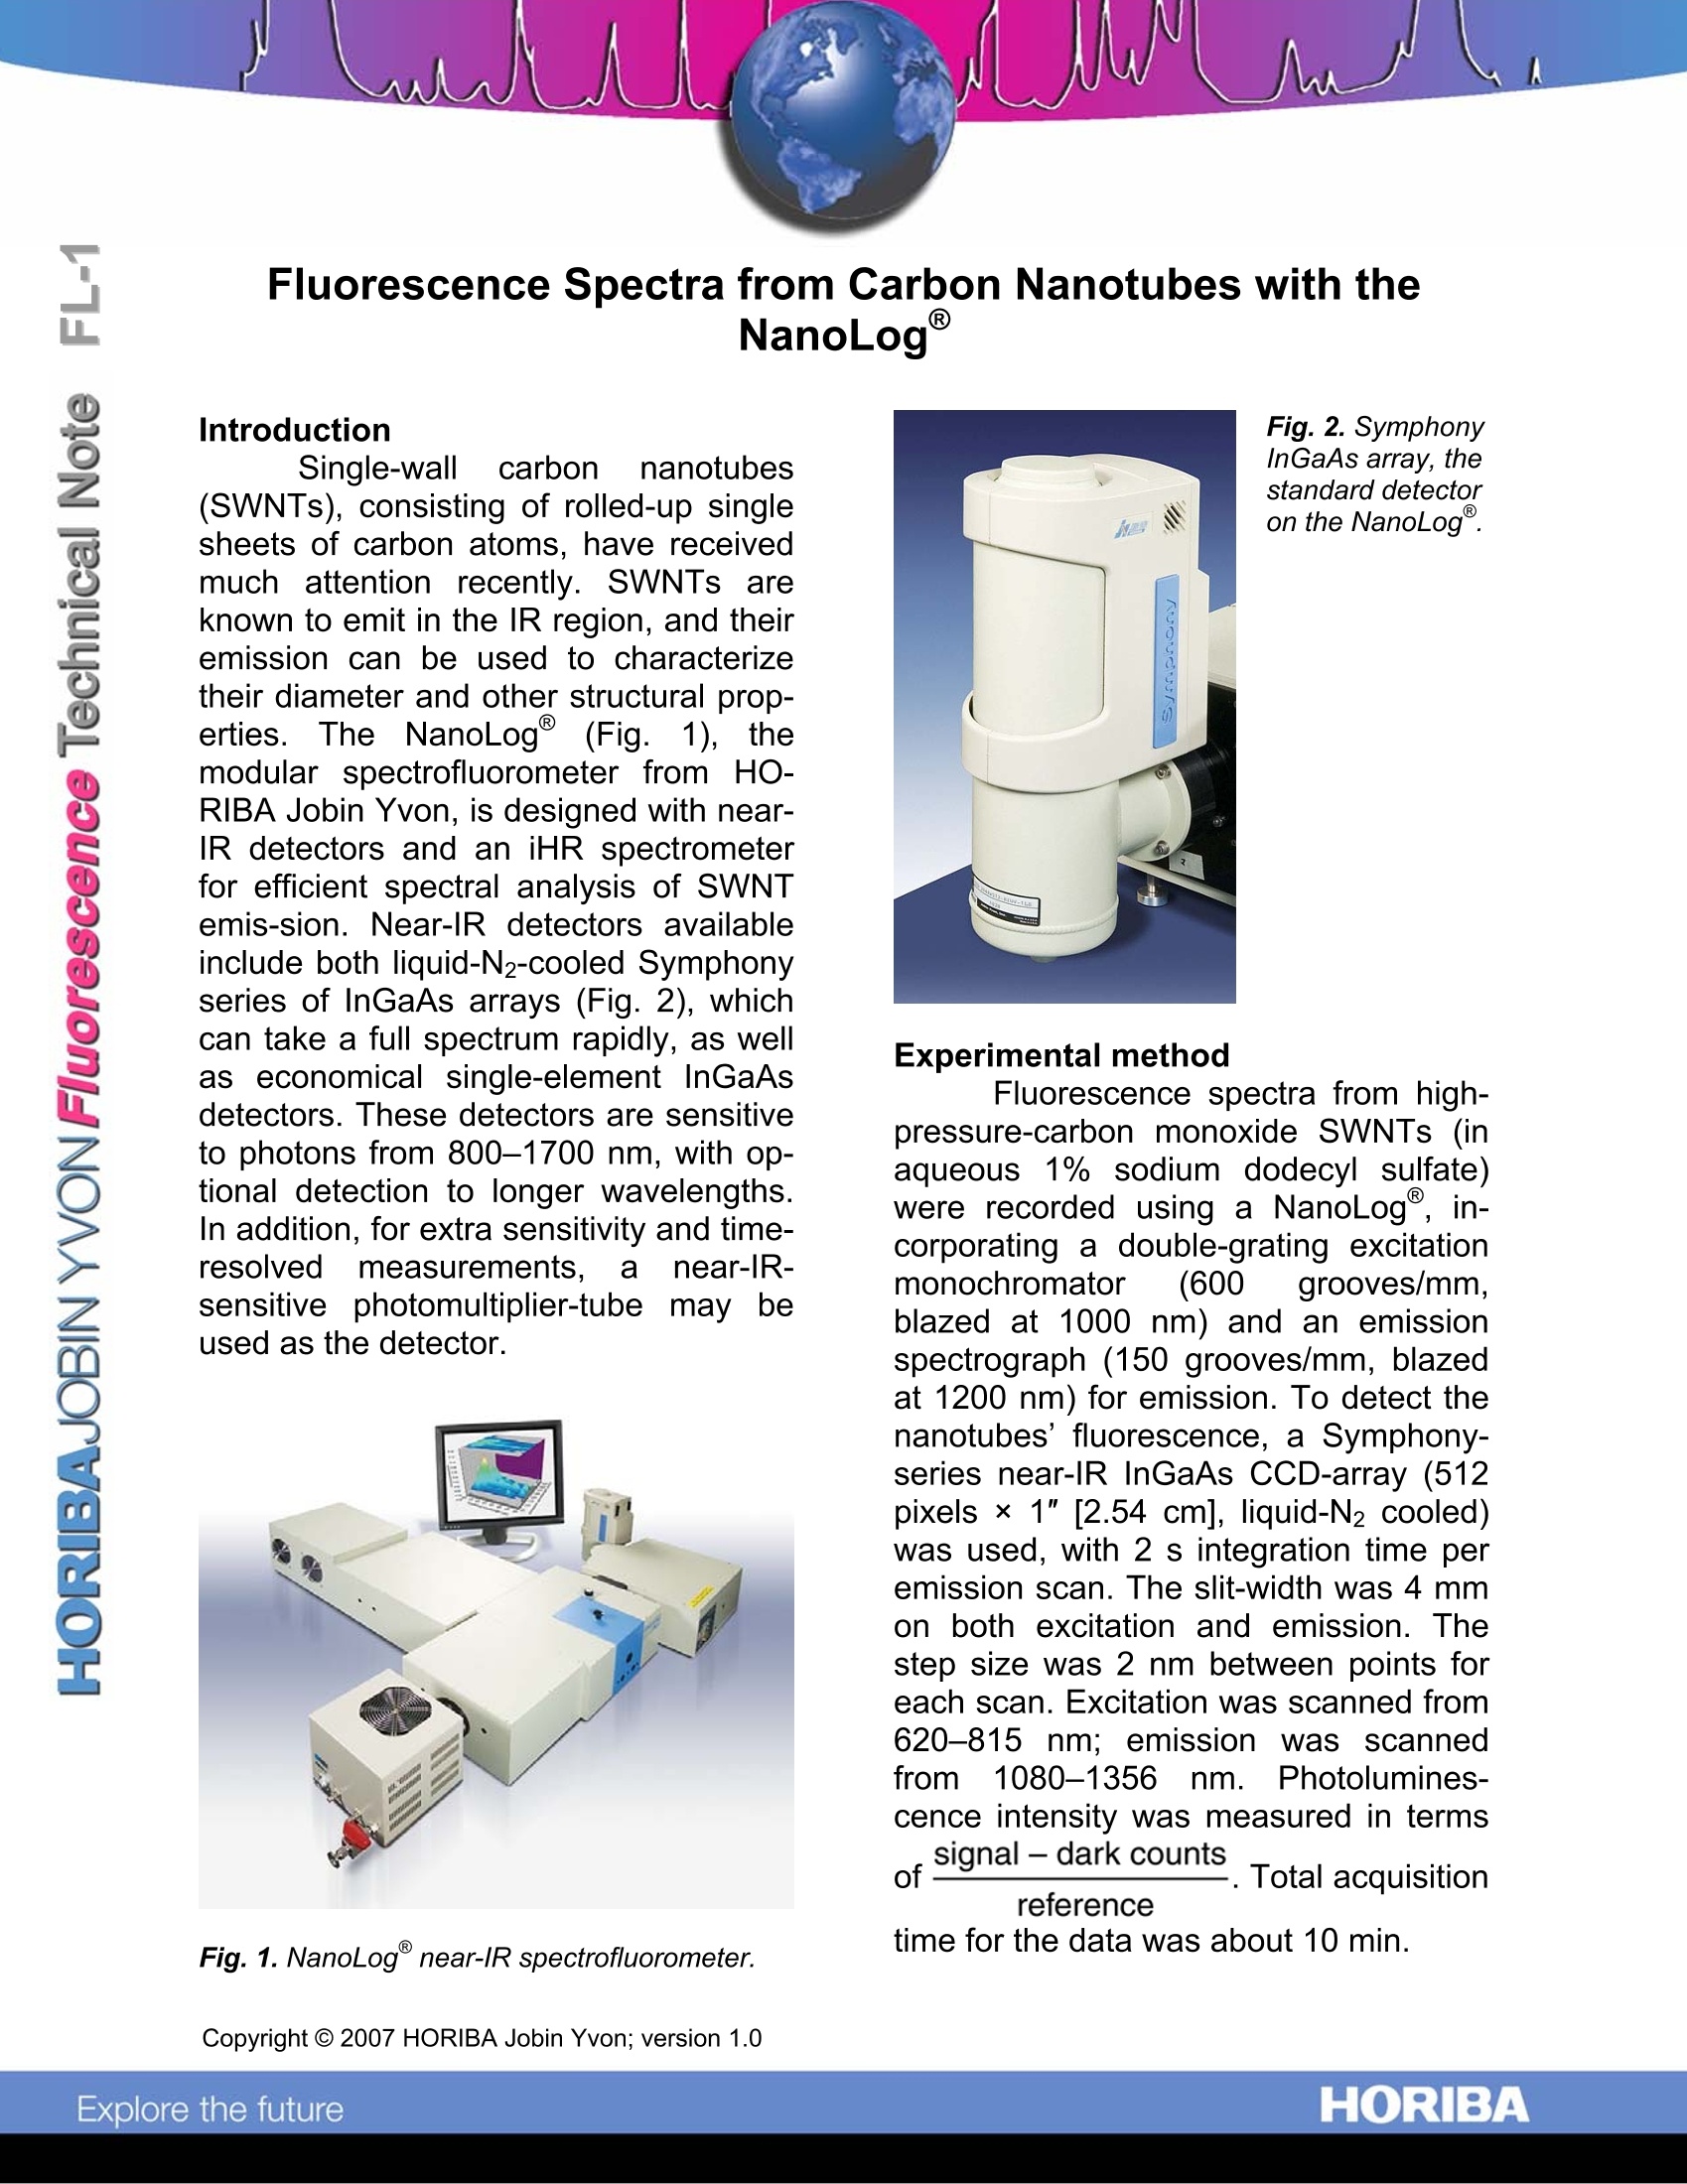
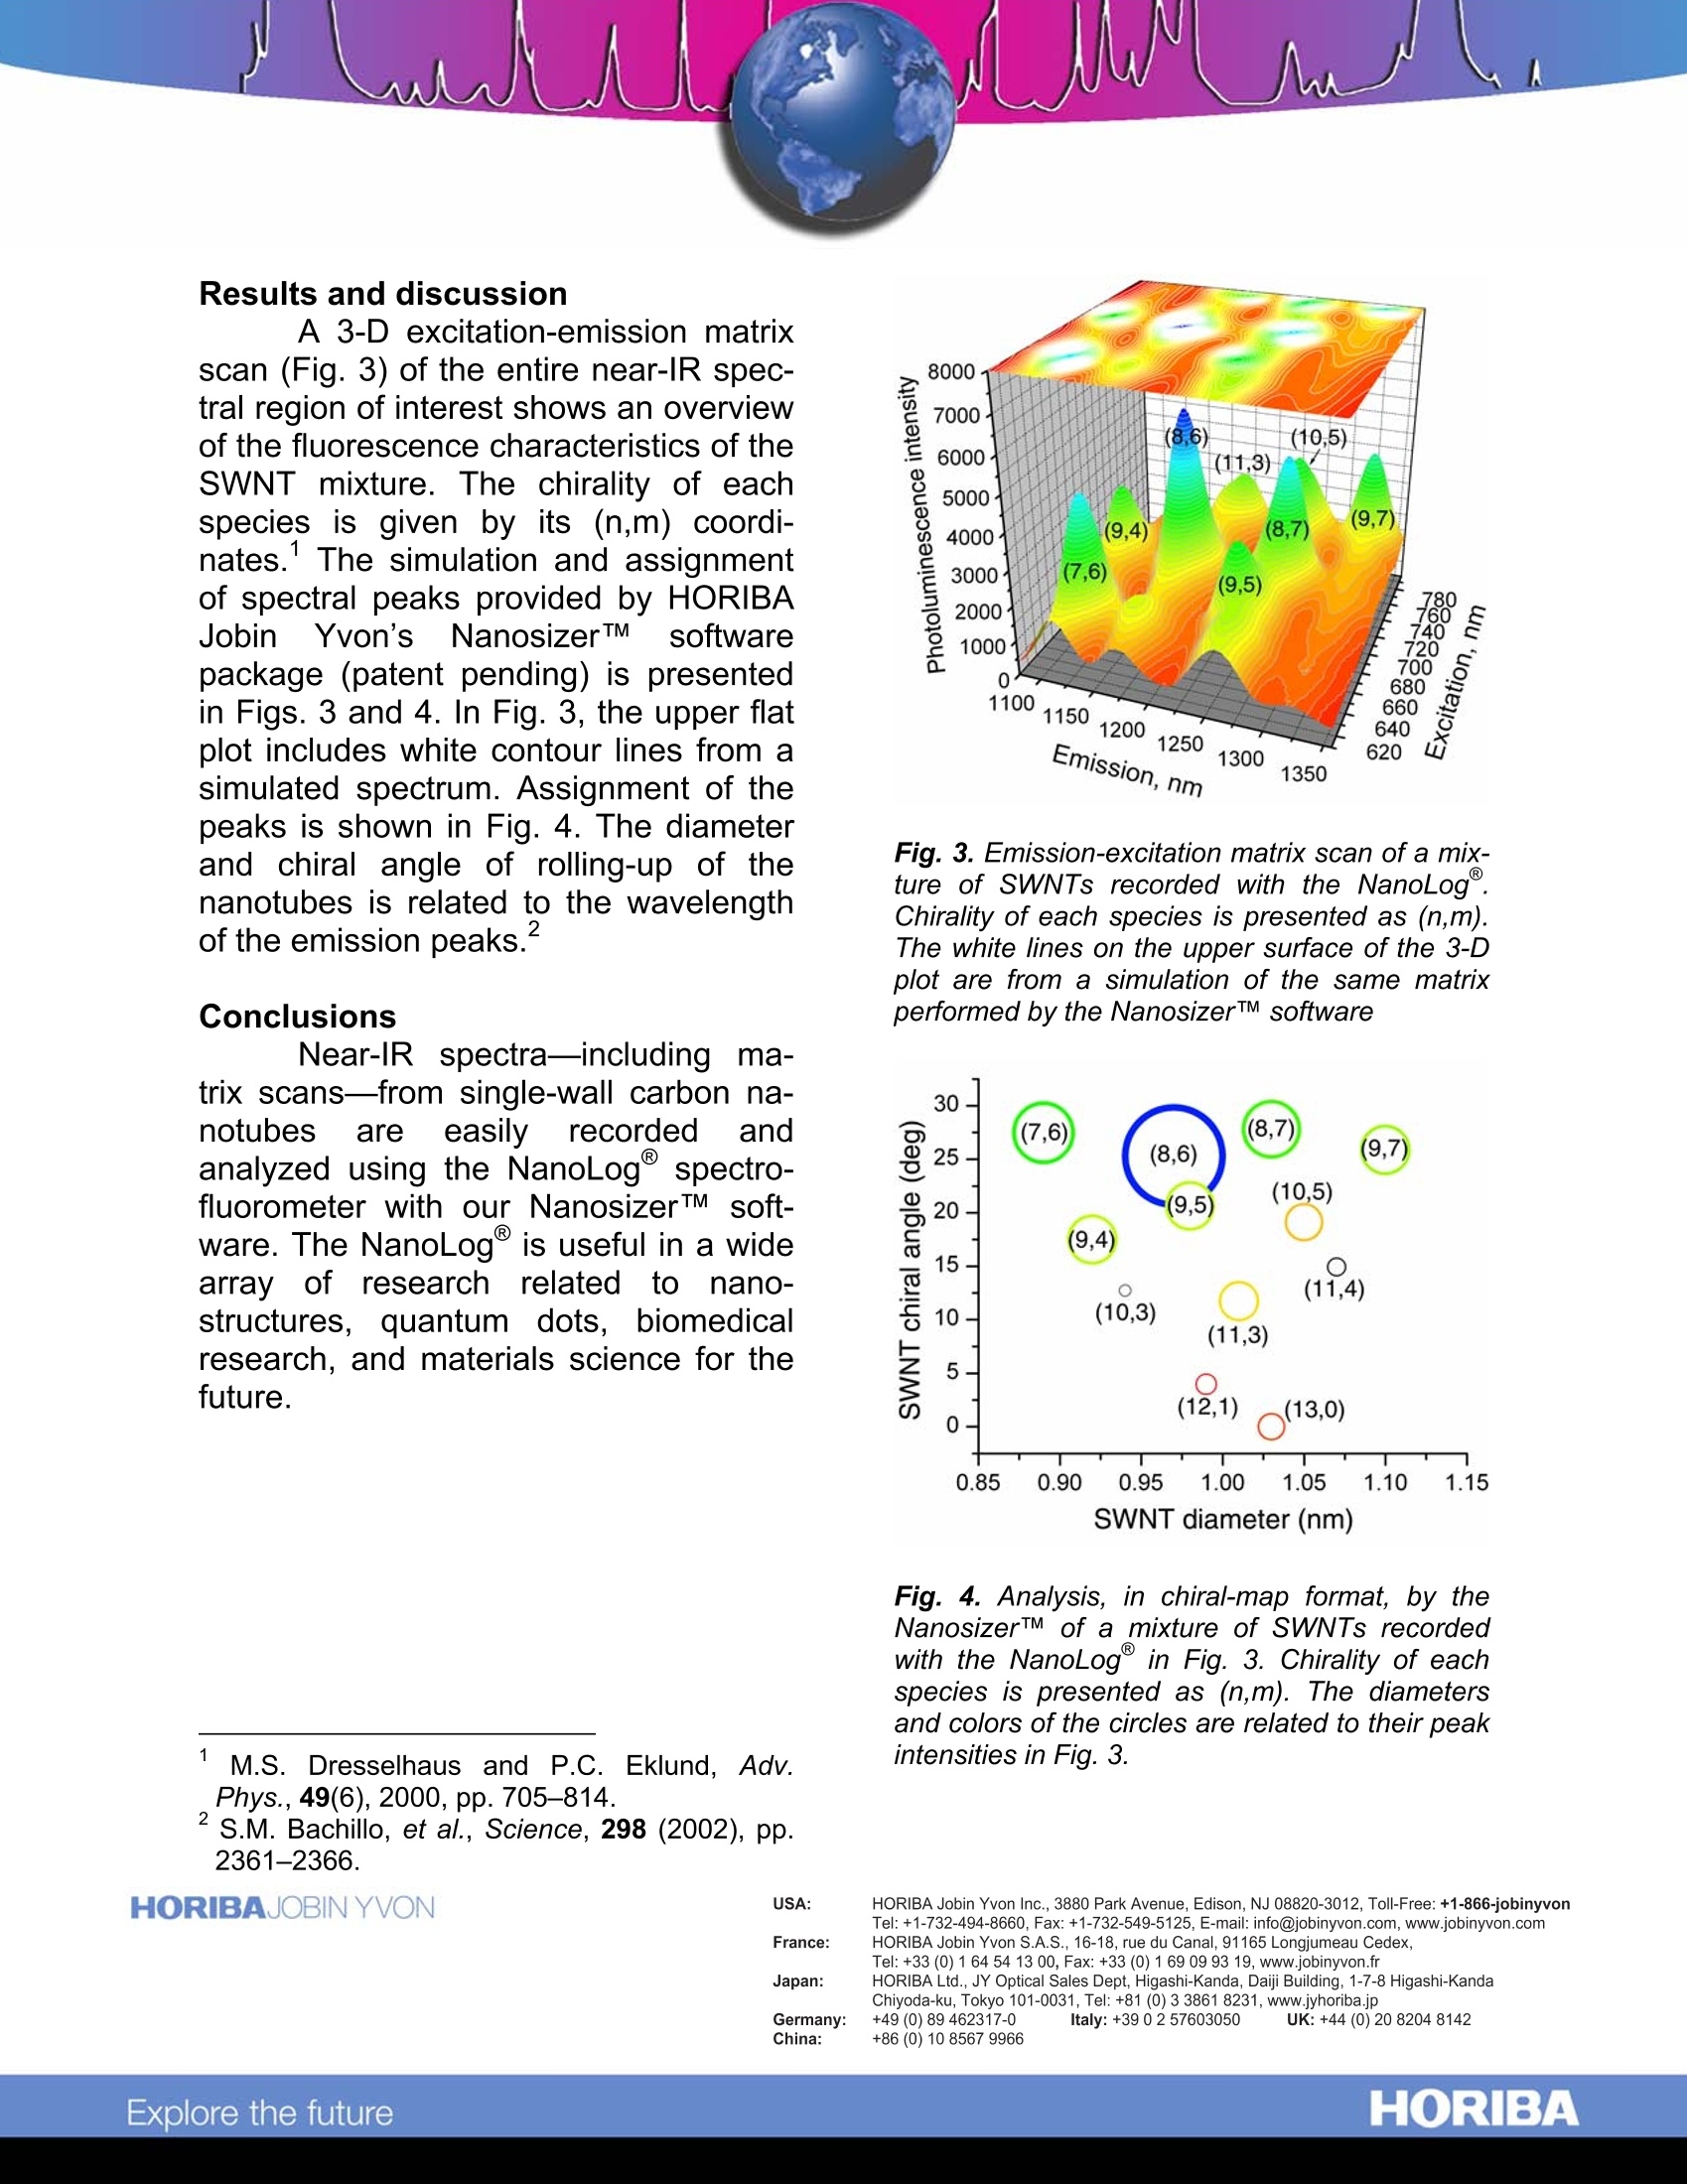
Introduction Single-wallcarbonnanotubes(SWNTs), consisting of rolled-up singlesheets of carbon atoms, have receivedmuch attention recently. SWNTs areknown to emit in the IR region, and theiremission can be used to characterizetheir diameter and other structural prop-erties. The NanoLog@(Fig. 1), themodular spectrofluorometer from HO-RIBA Jobin Yvon, is designed with near-IR detectors and an iHR spectrometerfor efficient spectral analysis of SWNTemis-sion. Near-IR detectors availableinclude both liquid-N2-cooled Symphonyseries of InGaAs arrays (Fig. 2), whichcan take a full spectrum rapidly, as wellas economical single-element InGaAsdetectors. These detectors are sensitiveto photons from 800-1700 nm, with op-tional detection to longer wavelengths.In addition, for extra sensitivity and time-resolvedmeasurements.anear-IR-sensitive photomultiplier-tube may beused as the detector. Fig. 1. NanoLognear-IR spectrofluorometer. Fig.2. SymphonyInGaAs array, thestandard detectoron the NanoLog. Experimental method Fluorescence spectra from high-pressure-carbon monoxide SWNTs (inaqueous1% sodium dodecyl sulfate)were recorded using a NanoLog, in-corporating a double-grating excitationmonochromator (600 grooves/mm,blazed at 1000 nm) and an emissionspectrograph (150 grooves/mm, blazedat 1200 nm) for emission. To detect thenanotubes’fluorescence, a Symphony-series near-IR InGaAs CCD-array (512pixels x 1"[2.54 cm], liquid-N2 cooled)was used, with 2 s integration time peremission scan. The slit-width was 4 mmon both excitation and emission. Thestep size was 2 nm between points foreach scan. Excitation was scanned from620-815i nm; emission was scannedfromn1080-1356nm.Photolumines-cence intensity was measured in terms . signal - dark counts ( of Total acquisition reference time for the data was about 10 min. ) Results and discussion A 3-D excitation-emission matrixscan (Fig. 3) of the entire near-IR spec-tral region of interest shows an overviewof the fluorescence characteristics of theSWNT mixture. The chirality of eachspecies is given by its (n,m) coordi-nates. The simulation and assignmentof spectral peaks provided by HORIBAJobin1 Yvon'sNanosizerTMsoftwarepackage (patent pending) is presentedin Figs. 3 and 4. In Fig. 3, the upper flatplot includes white contour lines from asimulated spectrum. Assignment of thepeaks is shown in Fig. 4. The diameterand chiral angle of rolling-up of thenanotubes is related to the wavelengthof the emission peaks. Conclusions Near-IR spectra-including ma-trix scans-from single-wall carbon na-notubesSareeasily recordedandanalyzed using the NanoLog spectro-fluorometer with our NanosizerTM soft-ware. The NanoLoge is useful in a widearray of researchrelated to nano-structures,quantum dots, biomedicalresearch, and materials science for thefuture. ( M.S. Dresselhauss and l P.C. Eklund, Adv.Phys.,49(6),2000, pp.705-814. ) ( S.M. Ba c hillo, e t al., Science, 2 9 8 (2002), pp . 2361-2366. ) Fig. 3. Emission-excitation matrix scan of a mix-ture of SWNTs recorded with the NanoLog.Chirality of each species is presented as (n,m).The white lines on the upper surface of the 3-Dplot are from a simulation of the same matrixperformed by the NanosizerTM software Fig.4. Analysis, in chiral-map format, by theNanosizerTM of a mixture of SWNTs recordedwith the NanoLog in Fig. 3. Chirality of eachspecies is presented as (n,m). The diametersand colors of the circles are related to their peakintensities in Fig.3. Copyright C HORIBA Jobin Yvon; version .HORIBAExplore the future HORIBAJOBIN YVON· China: +() ORIBAExplore the future Near-IR spectra—including matrix scans—from single-wall carbon nanotubes are easily recorded and analyzed using the NanoLog® spectrofluorometer with our Nanosizer™ software. The NanoLog® is useful in a wide array of research related to nanostructures, quantum dots, biomedical research, and materials science for the future.
确定
还剩1页未读,是否继续阅读?

产品配置单
HORIBA(中国)为您提供《碳纳米管中三维激发-发射矩阵扫描检测方案(分子荧光光谱)》,该方案主要用于纳米材料中三维激发-发射矩阵扫描检测,参考标准--,《碳纳米管中三维激发-发射矩阵扫描检测方案(分子荧光光谱)》用到的仪器有HORIBA NanoLog®近红外荧光光谱仪
相关方案
更多
该厂商其他方案
更多