当今合成树脂在牙科领域(代替合金)已经被广泛地应用。其树脂机械加工磨具十分依赖加工过程。因此,为了获得更佳的效率,针对树脂加工状态的实时监控就显得十分必要。我们使用拉曼和荧光光谱仪,对一些十分常见的牙科用树脂进行了检测,发现这些树脂本身所具有的荧光可以加以利用,比如荧光的变化。这种方法不要求任何事先的样品准备,十分适合现场的实时检测。
方案详情

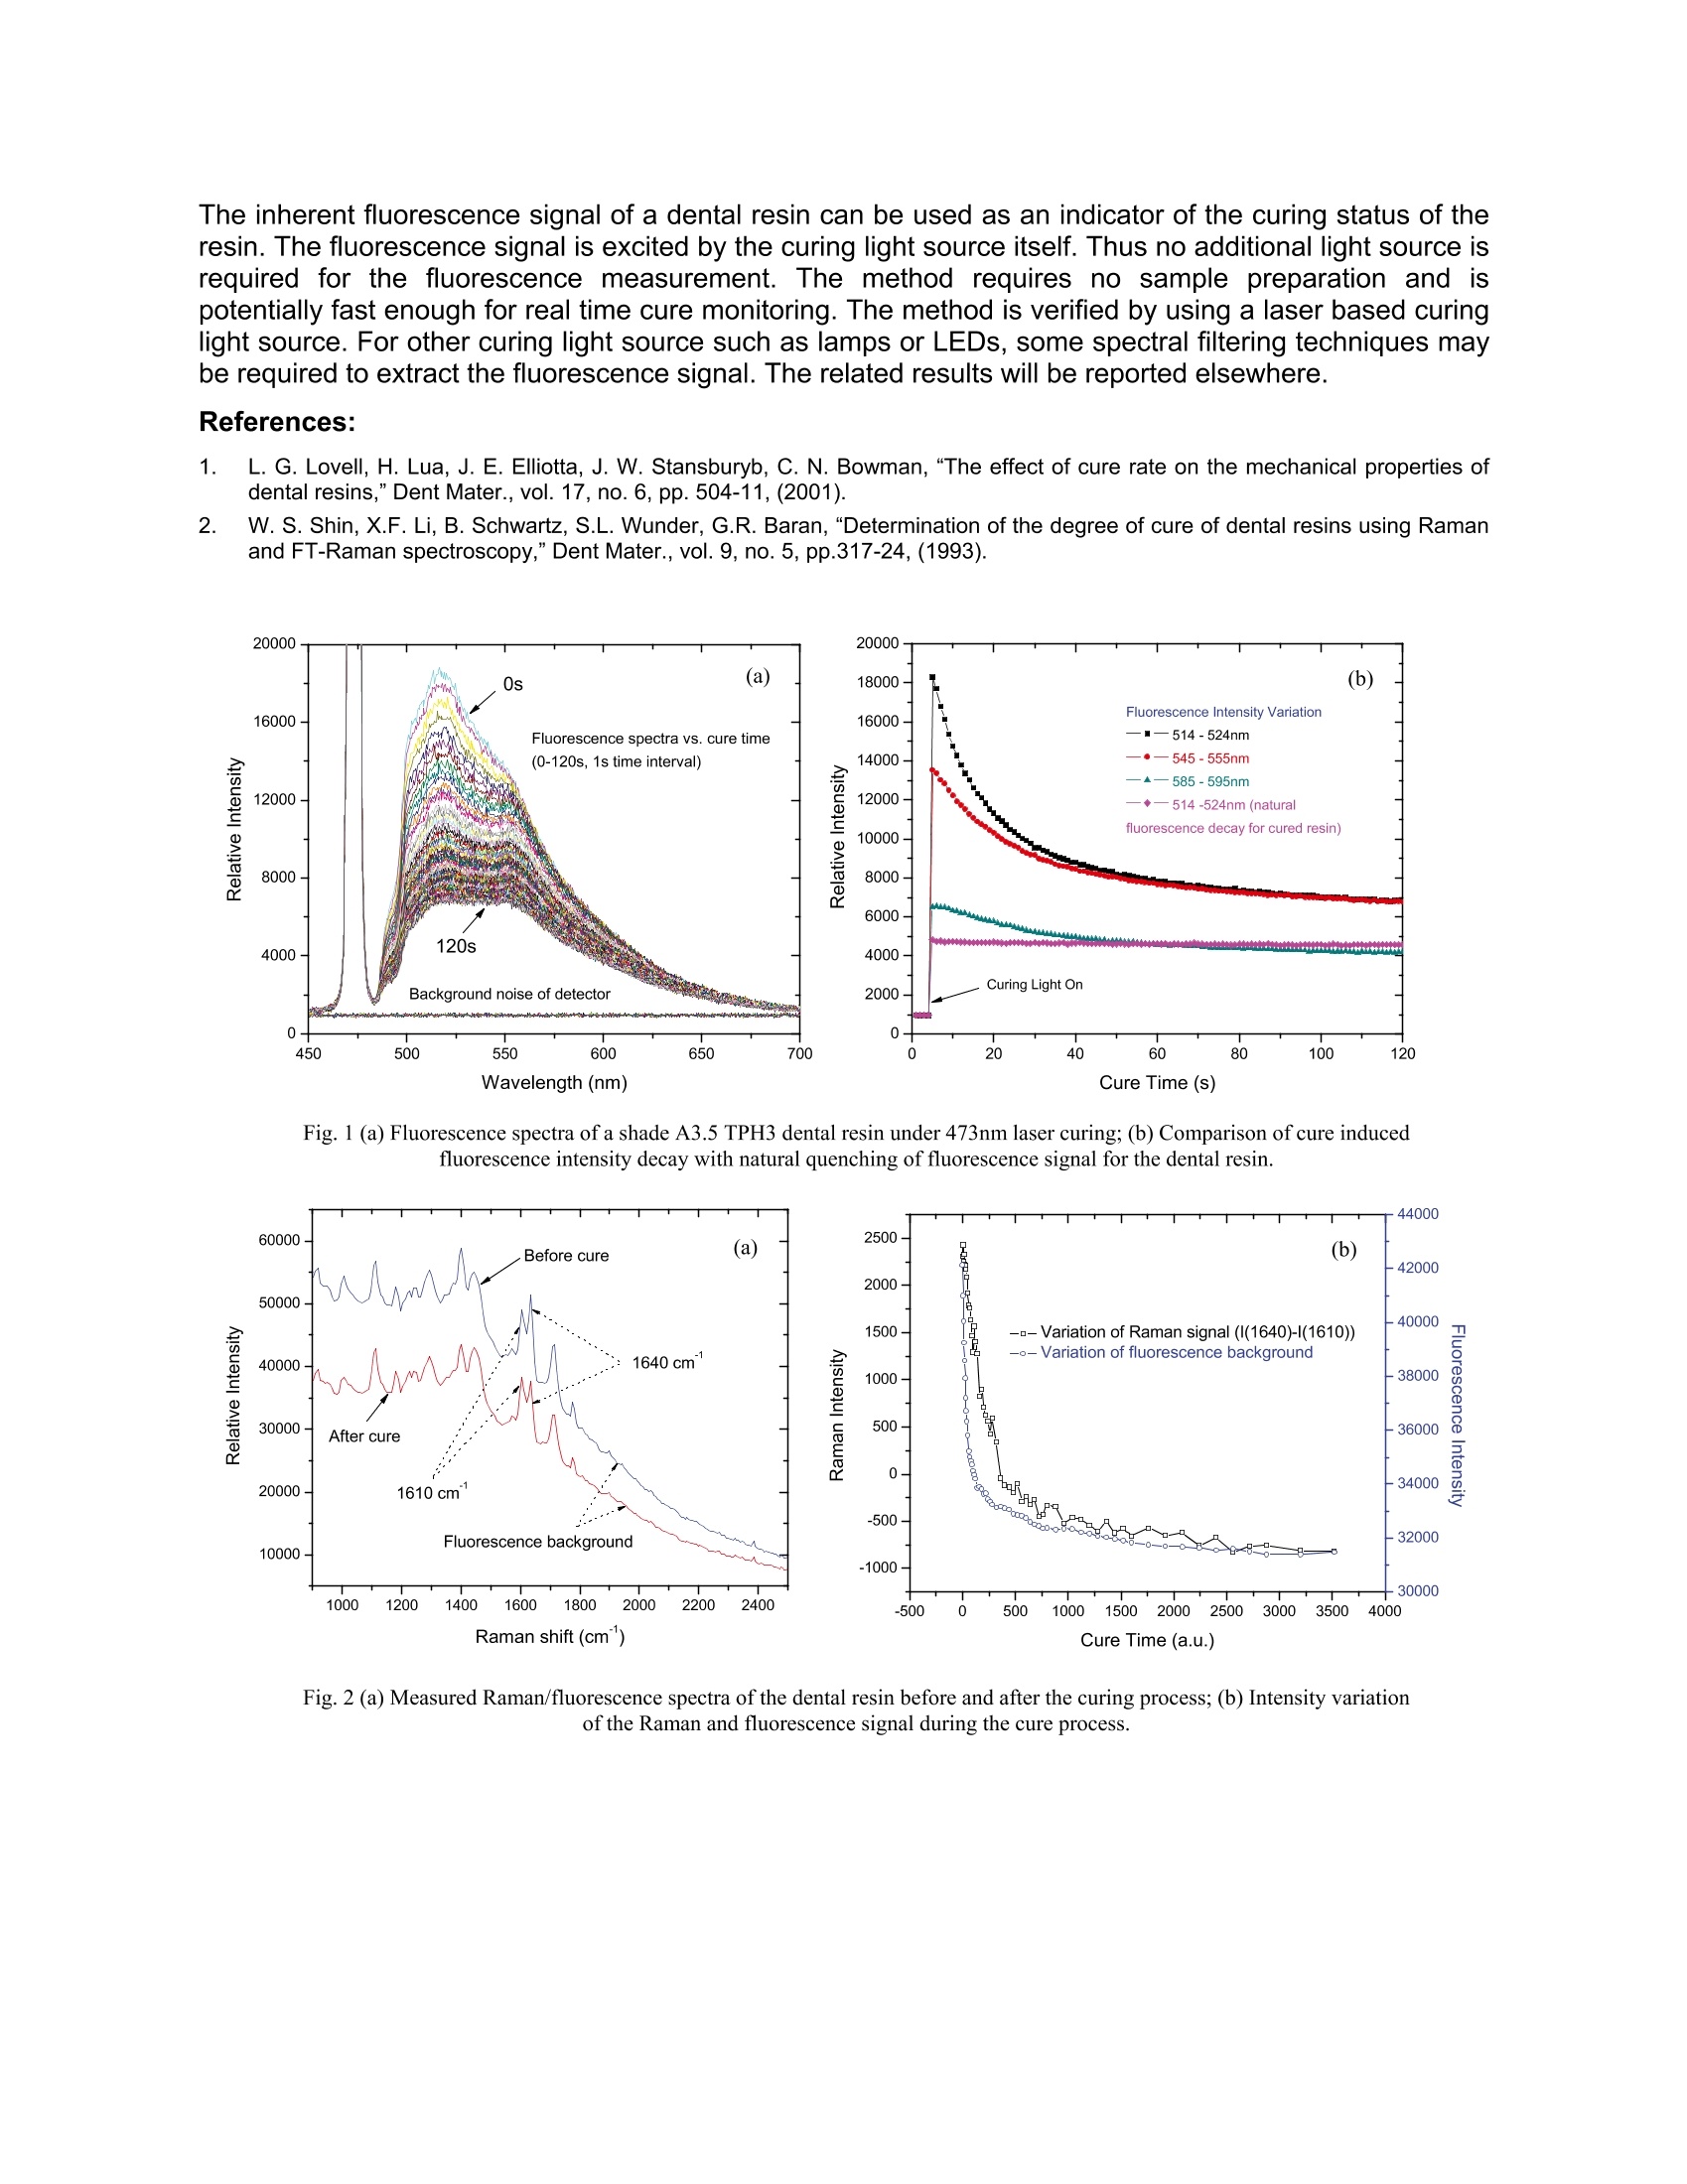
Dental Resin Polymerization Monitoring by Raman and Fluorescence spectroscopy B & W Tek, Inc., 19 Shea Way, Newark, DE 19713, info@bwtek.com,www.bwtek.com Introduction Composite resins are widely used today instead of amalgams for restorative dental practice. Themechanical properties of the cured composite resins are shown to be dependent on the curing process[1]. It is thus highly desirable to monitor the curing status of the resin in real time as to achieve theoptimum performance. We performed Raman and fluorescence spectroscopic analysis on some populardental resins and demonstrated that the inherent fluorescence of a dental resin can be utilized to monitorthe curing status, i.e. degree of conversion of the resin. The method does not require any samplepreparation and is potentially very fast for real time cure monitoring. Method and results We used TPH3 micro-matrix restorative resins from Dentsply International as the sample dental resins totest our method. A 473nm blue laser with an output power of 4mW was used as the curing light source aswell as the light source for fluorescence signal excitation. The fluorescence signal produced by the resinduring cure process was collected by a fiber optic probe and sent to a general purpose CCD arrayspectrometer (BTC112E from B&W Tek, Inc.) with a spectral coverage of 200-1050nm for real timefluorescence spectrum analysis. The spectrometer completes one fluorescence spectrum measurementwithin 40ms. Fig. 1 (a) shows the variation of the fluorescence spectra for a shade A3.5 TPH3 resin during a 120s cureprocess. The spectra were measured at a 1s time interval. From Fig. 1 (a), it can be clearly seen that theinherent fluorescence signal of the dental resin drops significantly as it is cured. This fluorescence signalreduction is accompanied by a change in the shape of the fluorescence spectra. This cure inducedfluorescence signal decay is further illustrated in Fig. 1 (b), where the fluorescence intensity at threecharacteristic wavelength regions of 514-524nm,545-555nm and 585-595nm are recorded in respect tothe cure time. For comparison purposes, the natural quenching of the fluorescence signal by the samelaser for a fully cured A3.5 resin is also illustrated in the figure. From Fig. 1 (b), it can be seen that thecure induced fluorescence decay is most prominent at 514-524nm. At longer wavelengths, the decay isless significant. But it is still much stronger than the natural quenching of the fluorescence signal. Thisindicates that the fluorescence decay is closely related to the curing process. Similar fluorescence decaywas observed on other branded composite resins such as Vit-I-escence from Ultradent Products, Inc. Weattribute this fluorescence decay to the status change of the photo initiator during the polymerizationprocess. Further investigations show that the fluorescence decay rate is influenced by the shade,thickness, filler size, material, and other parameters of the resin, which determine the cure speed of theresin. To further verify the feasibility of utilizing the inherent fluorescence signal for cure monitoring, wemeasured the Raman/fluorescence spectra of the resin by using a B&W Tek MiniRamTM Ramanspectrometer, which features a rugged turn-key design with a built-in 785nm narrow linewidth diode laserand a TE cooled CCD array spectrometer. The Raman spectrometer provides a spectral coverage of 225-3100cm and a spectral resolution of 10cm". A fiber optical probe with >60dB Rayleigh scatteringrejection was used to deliver the laser light and collect the Raman scattering signal from the dental resin.In this experiment, the dental resin was cured by an LED light source with a central wavelength of 470nm.The curing was performed in a stepwise manner and the Raman/fluorescence spectra were measured atthe interval of each step. Fig. 2(a) shows the measured Raman/fluorescence spectra of the dental resinbefore and after the curing process. A variation in the relative intensity of the 1610cm and 1640cmRaman band is used as an indicator of the degree of conversion for the dental resin [2]. In the mean time,the average intensity of the fluorescence background is recorded for each curing step. The result isfurther illustrated in Fig. 2 (b). It can be seen that the fluorescence decay of the dental resin shows goodconsistency with the variation of the Raman signal during the cure process. Conclusion The inherent fluorescence signal of a dental resin can be used as an indicator of the curing status of theresin. The fluorescence signal is excited by the curing light source itself.Thus no additional light source isrequired for the fluorescence measurement. The method requires no sample preparation and ispotentially fast enough for real time cure monitoring. The method is verified by using a laser based curinglight source. For other curing light source such as lamps or LEDs, some spectral filtering techniques maybe required to extract the fluorescence signal. The related results will be reported elsewhere. References: 1. L. G. Lovell, H. Lua, J. E. Elliotta, J. W. Stansburyb, C. N. Bowman, “The effect of cure rate on the mechanical properties ofdental resins,"Dent Mater., vol. 17, no.6, pp. 504-11, (2001). 2. W. S. Shin, X.F. Li, B. Schwartz, S.L. Wunder, G.R. Baran,“Determination of the degree of cure of dental resins using Ramanand FT-Raman spectroscopy," Dent Mater., vol.9, no.5, pp.317-24, (1993). Fig. 1 (a) Fluorescence spectra of a shade A3.5 TPH3 dental resin under 473nm laser curing; (b) Comparison of cure inducedfluorescence intensity decay with natural quenching of fluorescence signal for the dental resin. Fig.2(a) Measured Raman/fluorescence spectra of the dental resin before and after the curing process; (b) Intensity variationof the Raman and fluorescence signal during the cure process.
确定
还剩1页未读,是否继续阅读?
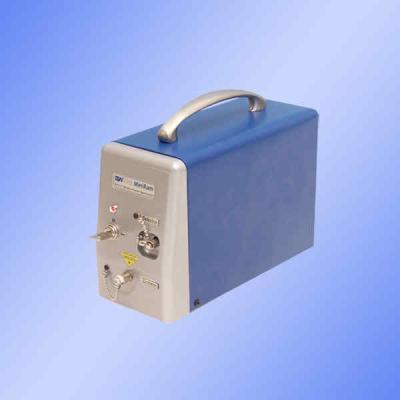
必达泰克光电设备(上海)有限公司为您提供《医用树脂中固化前后变化检测方案(激光拉曼光谱)》,该方案主要用于医疗/卫生中固化前后变化检测,参考标准--,《医用树脂中固化前后变化检测方案(激光拉曼光谱)》用到的仪器有MiniRam 微型近红外激光拉曼光谱仪、高灵敏度便携式拉曼光谱仪i-Raman Plus、高通量TE致冷控温CCD阵列光谱仪
推荐专场
相关方案
更多


