


方案详情
文
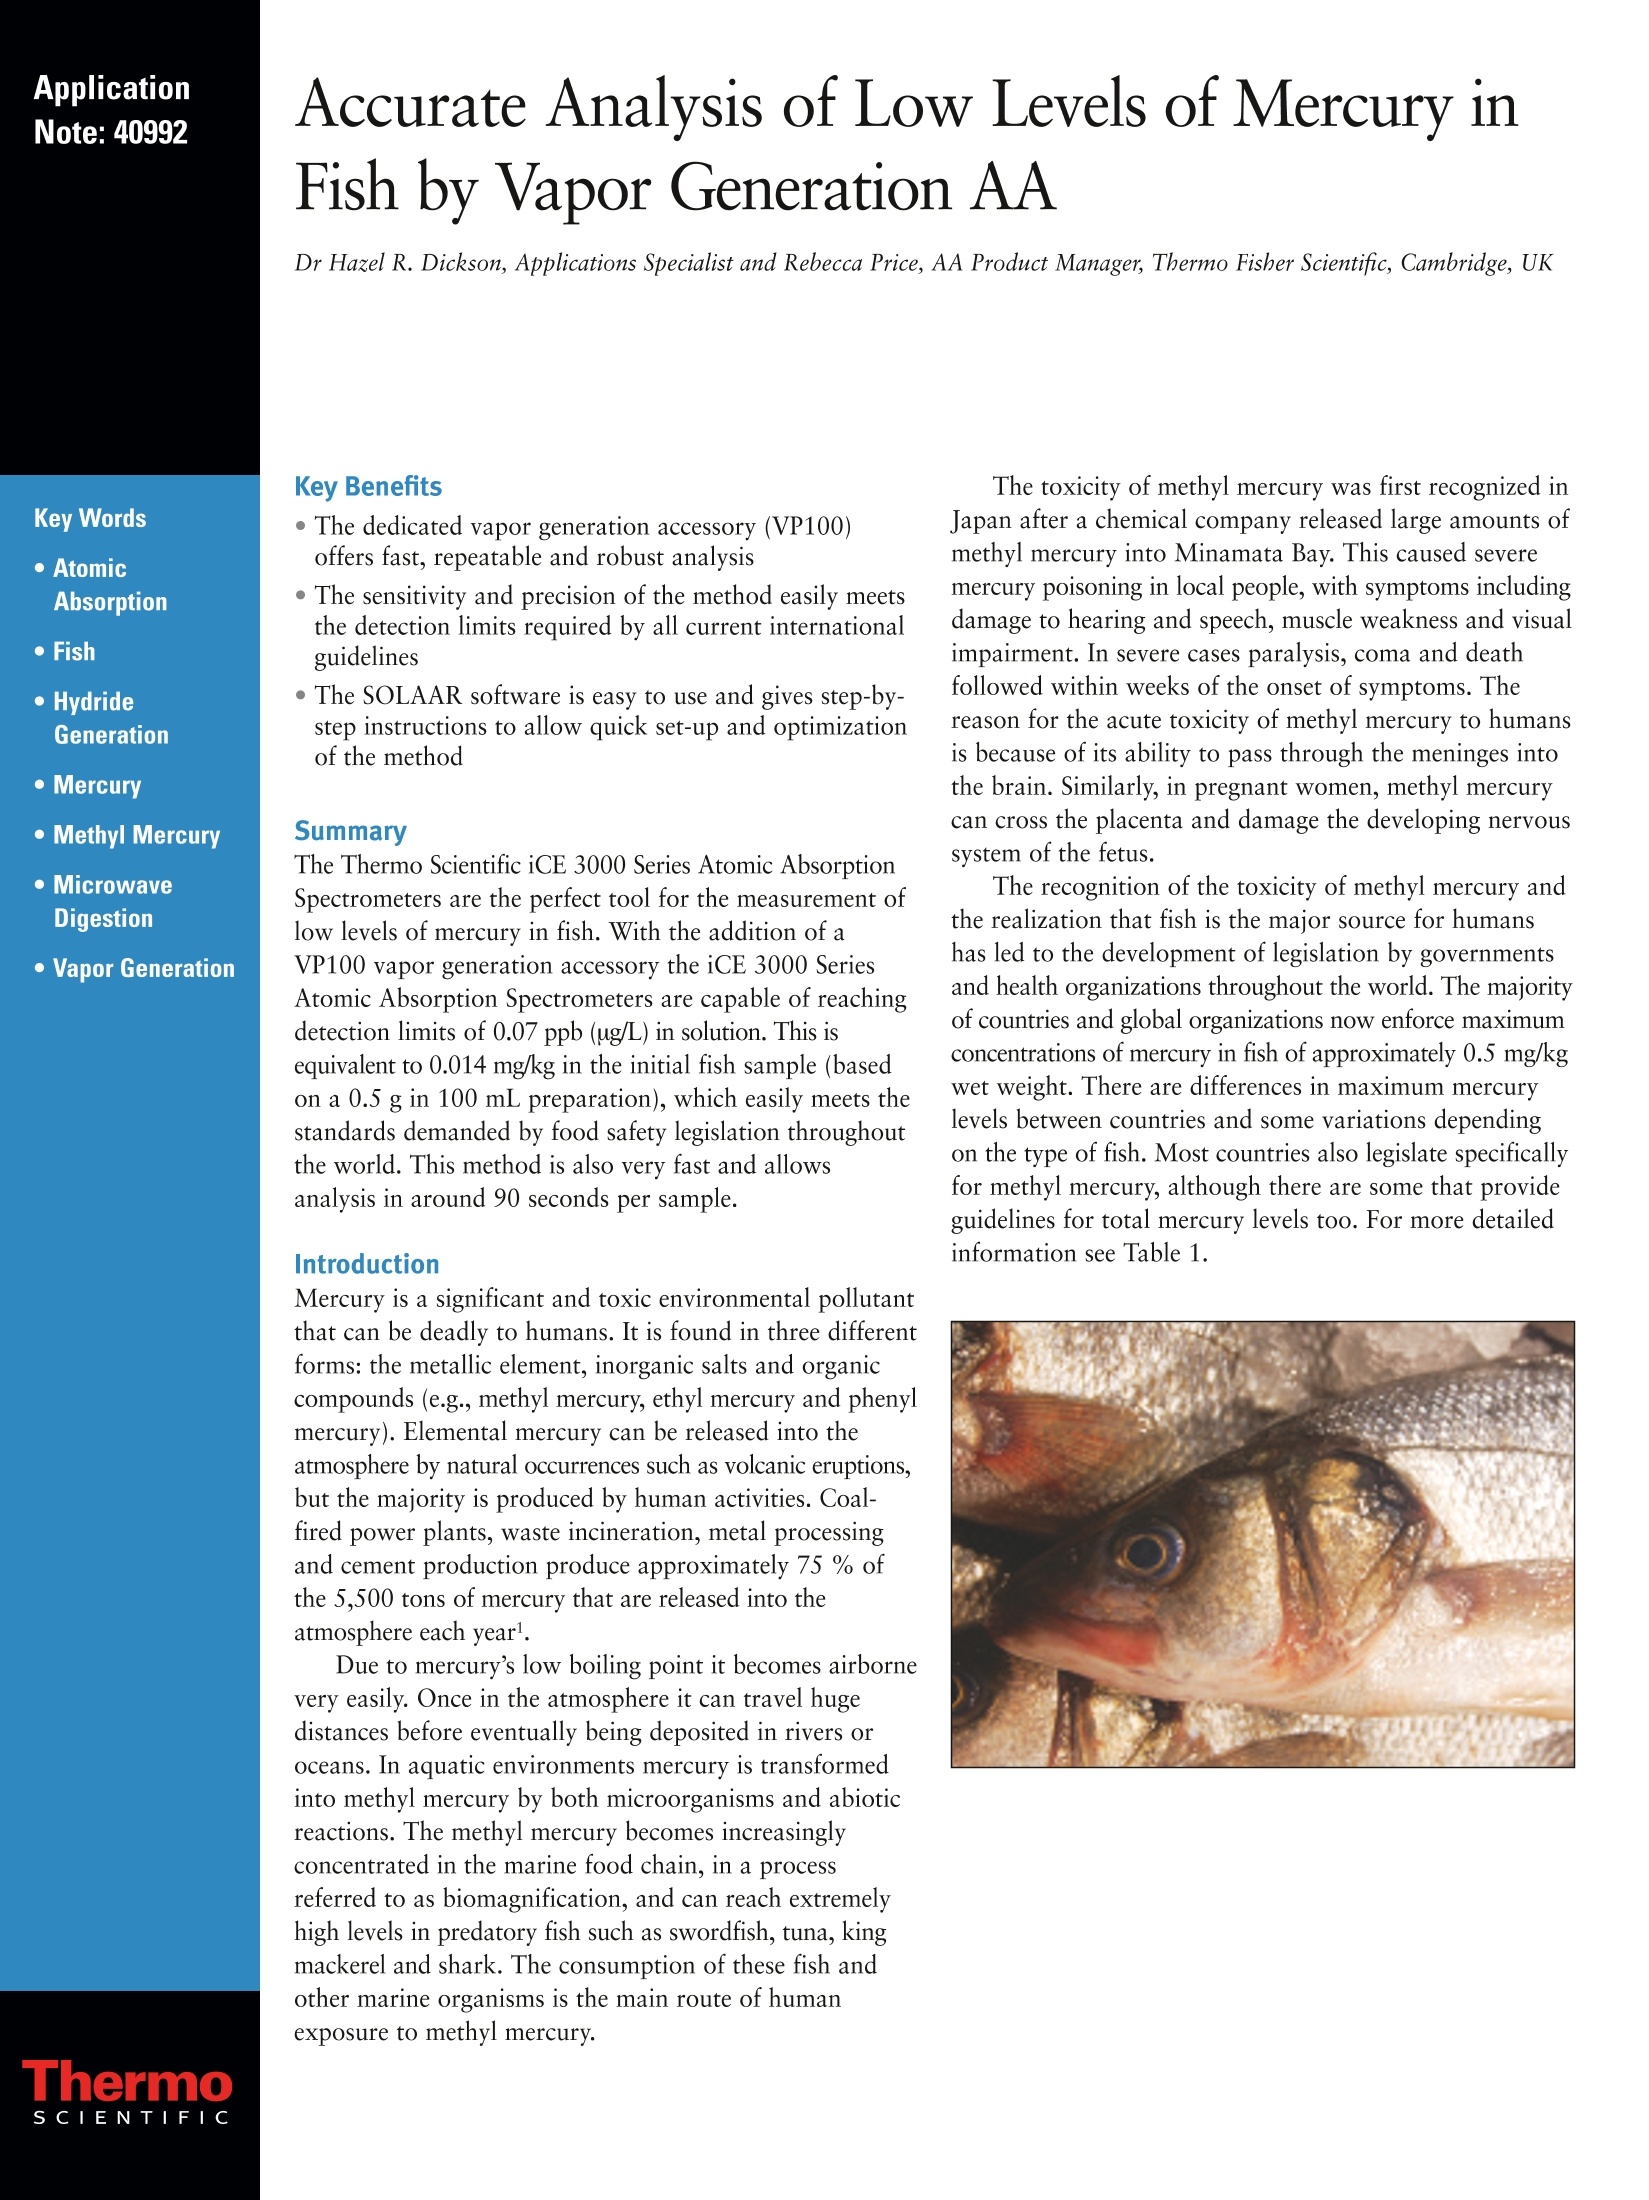
汞是一种重要的和有毒的环境污染物,对人类是致命的。它有三个不同的存在形式:金属元素、无机盐、有机食品化合物(例如,甲基汞,乙基汞和苯基汞)。元素汞是挥发性的,如火山喷发,但大多数是由人类的活动产生的。其中75%是发电厂、垃圾焚烧、五金加工和水泥生产产生的。
方案详情

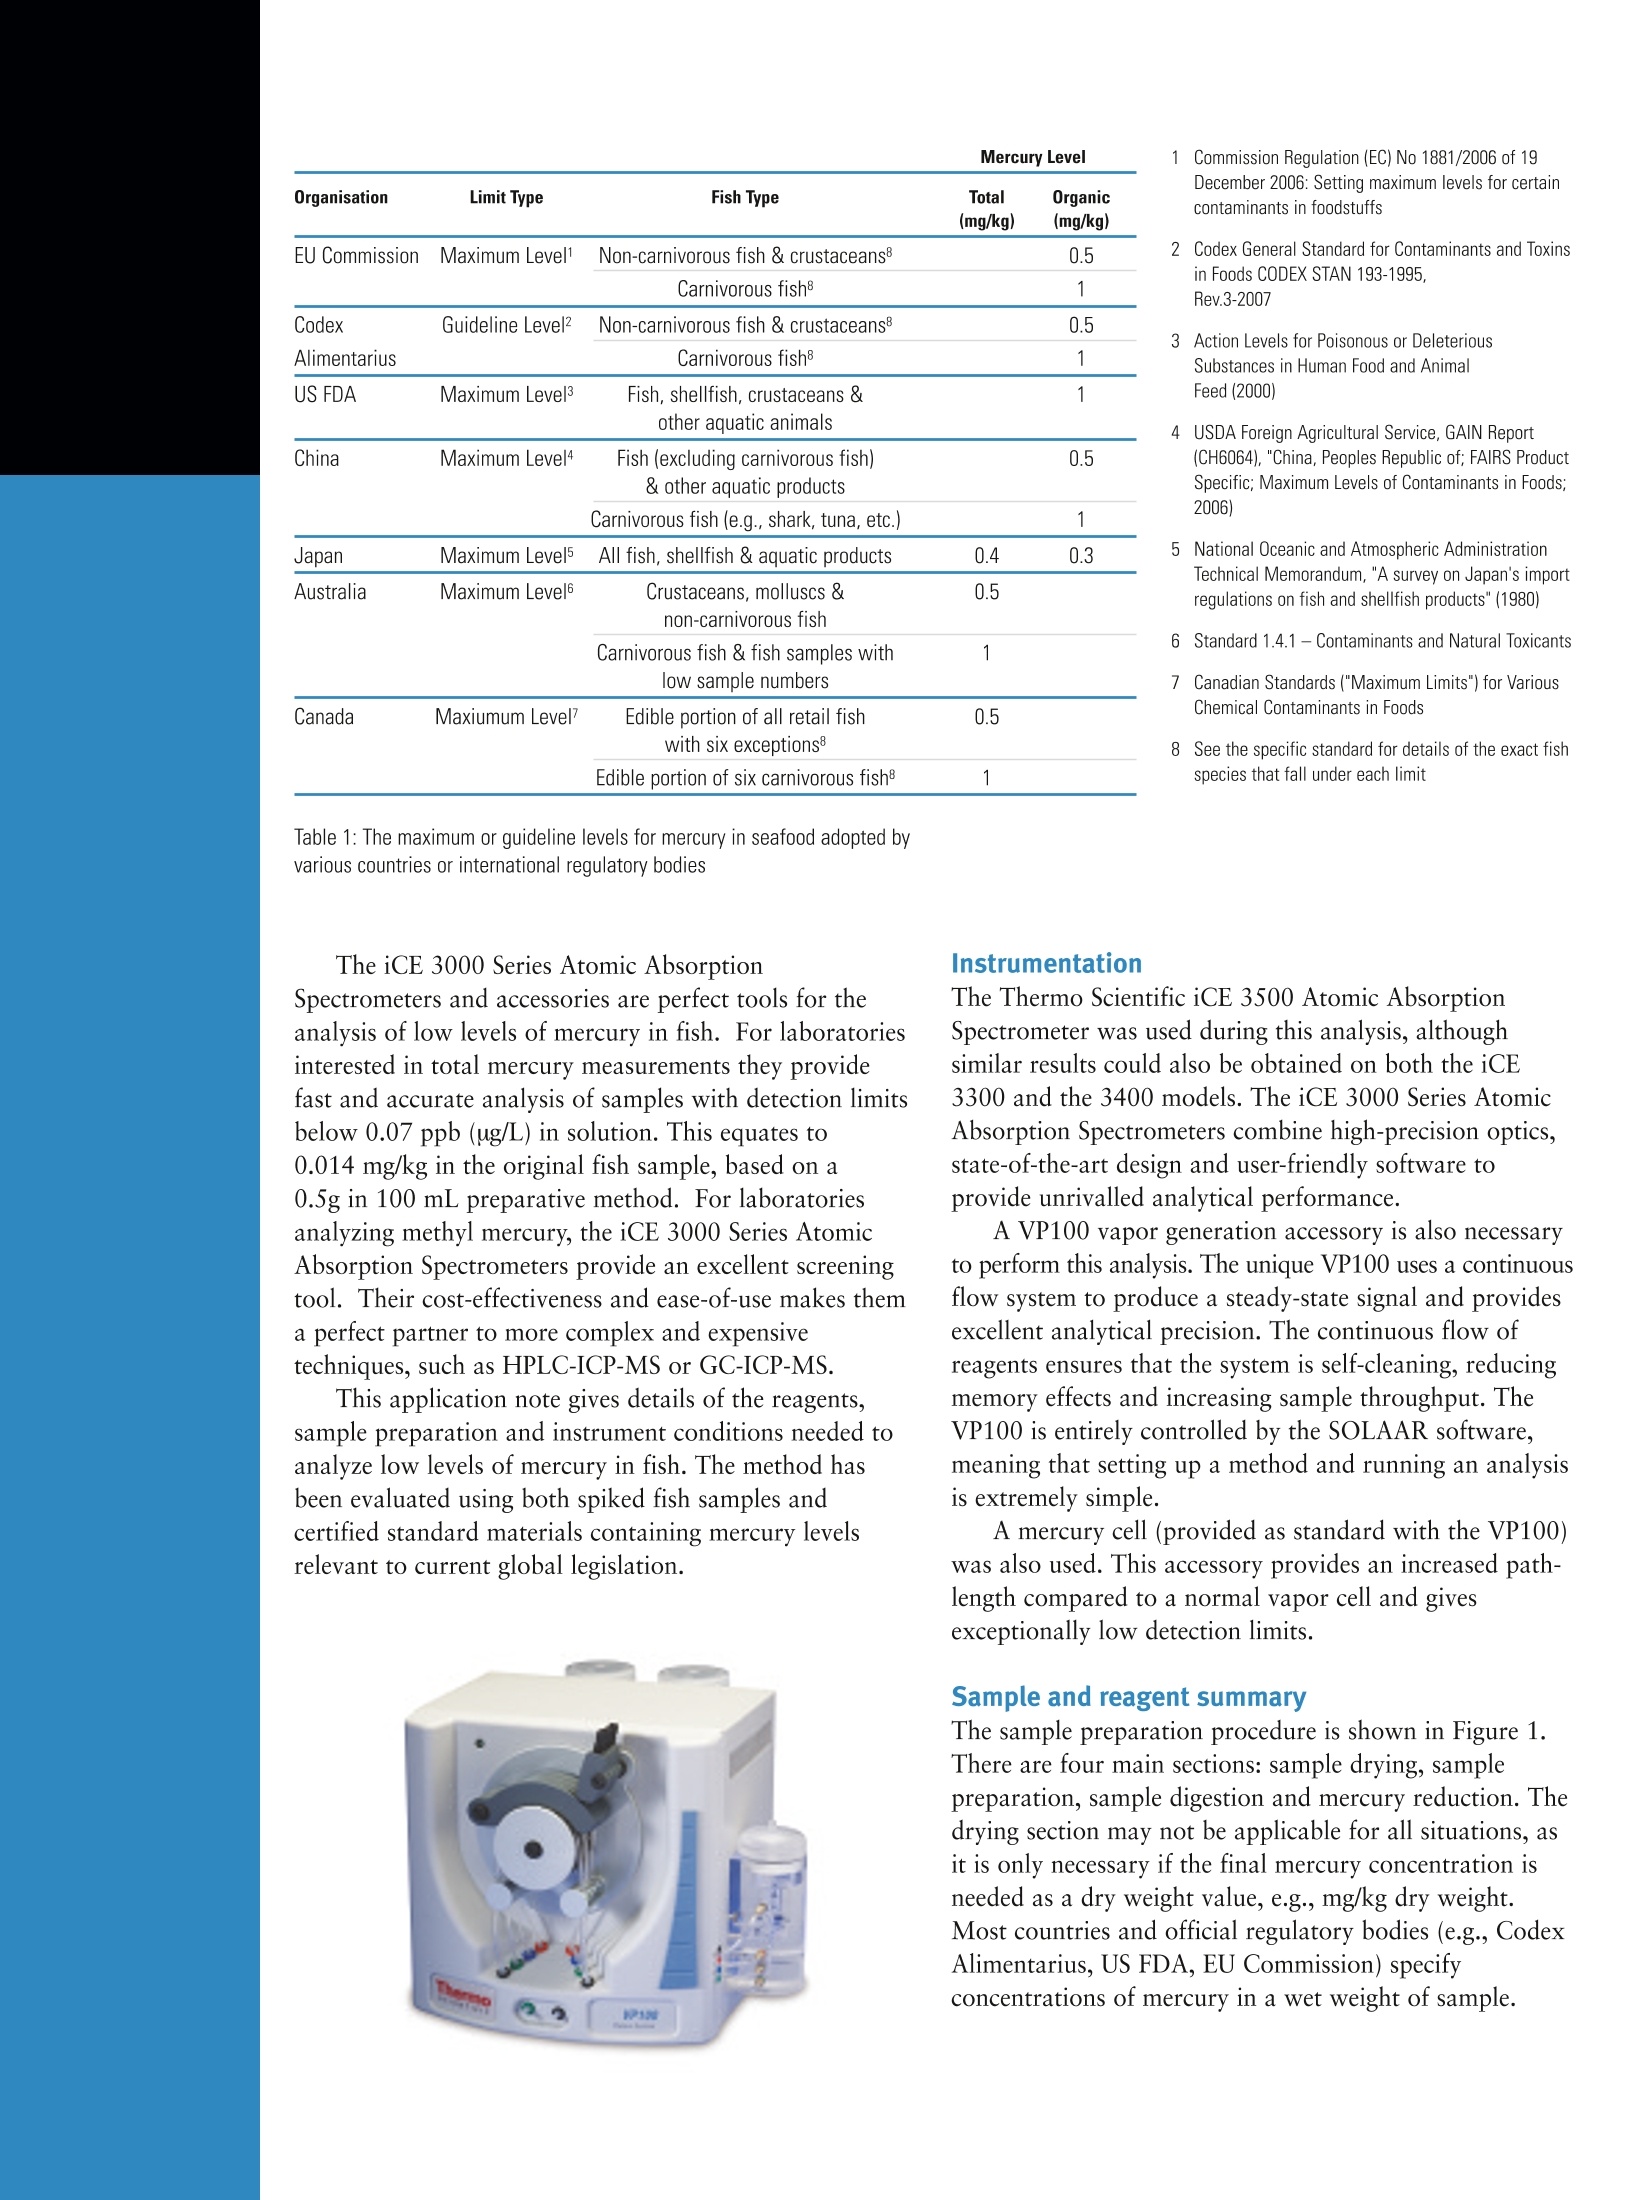
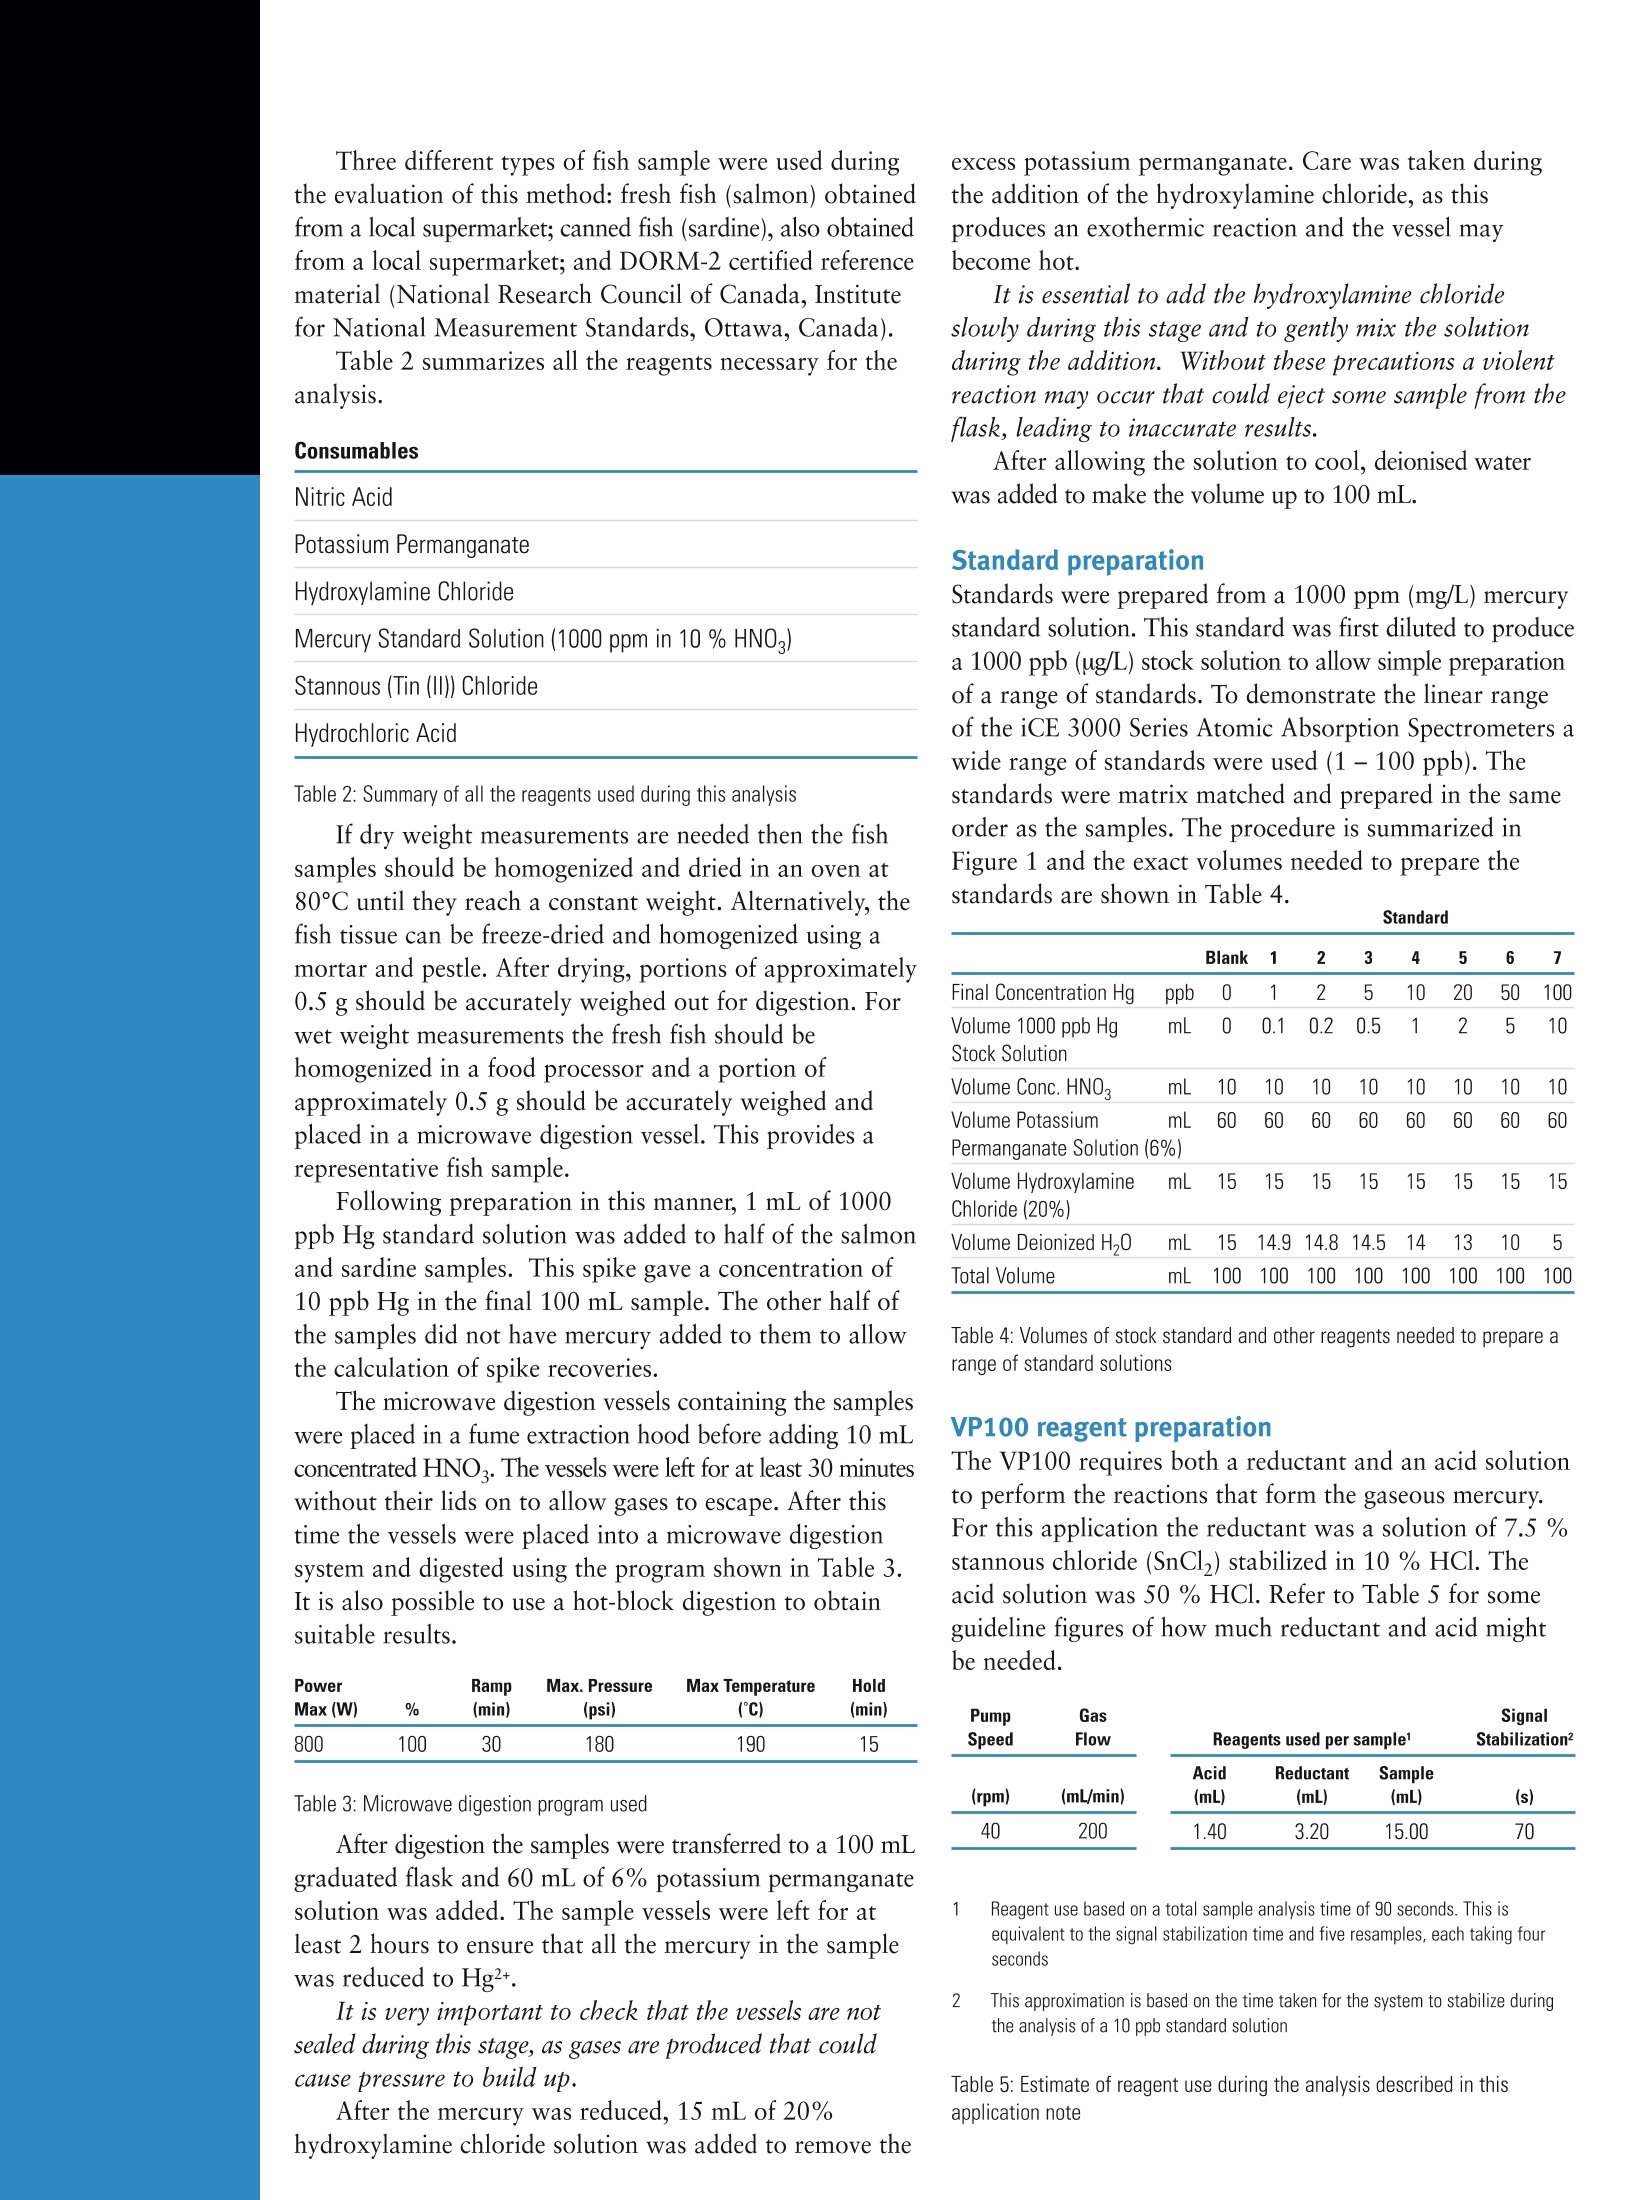
Mercury Levelwww.thermoscientific.comC2010 Thermo Fisher Scientific Inc. All rights reserved. All trademarks are the property of Thermo Fisher Scientific Inc. and its subsidiaries.Specifications, terms and pricing are subject to change.Not all products are available in all countries. Please consult your local sales representative for details. Accurate Analysis of Low Levels of Mercury inFish by Vapor Generation AA Dr Hazel R. Dickson, Applications Specialist and Rebecca Price, AA Product Manager, Thermo Fisher Scientific, Cambridge, UK Key Benefits ·The dedicated vapor generation accessory (VP100)offers fast, repeatable and robust analysis ·The sensitivity and precision of the method easily meetsthe detection limits required by all current internationalguidelines ·The SOLAAR software is easy to use and gives step-by-step instructions to allow quick set-up and optimizationof the method Summary The Thermo Scientific iCE 3000 Series Atomic AbsorptionSpectrometers are the perfect tool for the measurement oflow levels of mercury in fish. With the addition of aVP100 vapor generation accessory the iCE 3000 SeriesAtomic Absorption Spectrometers are capable of reachingdetection limits of 0.07 ppb (ug/L) in solution. This isequivalent to 0.014 mg/kg in the initial fish sample (basedon a 0.5 g in 100 mL preparation), which easily meets thestandards demanded by food safety legislation throughoutthe world. This method is also very fast and allowsanalysis in around 90 seconds per sample. Introduction Mercury is a significant and toxic environmental pollutantthat can be deadly to humans. It is found in three differentforms: the metallic element, inorganic salts and organiccompounds (e.g., methyl mercury, ethyl mercury and phenylmercury). Elemental mercury can be released into theatmosphere by natural occurrences such as volcanic eruptions,but the majority is produced by human activities. Coal-fired power plants, waste incineration, metal processingand cement production produce approximately 75 % ofthe 5,500 tons of mercury that are released into theatmosphere each year. Due to mercury's low boiling point it becomes airbornevery easily. Once in the atmosphere it can travel hugedistances before eventually being deposited in rivers oroceans. In aquatic environments mercury is transformedinto methyl mercury by both microorganisms and abioticreactions. The methyl mercury becomes increasinglyconcentrated in the marine food chain, in a processreferred to as biomagnification, and can reach extremelyhigh levels in predatory fish such as swordfish, tuna, kingmackerel and shark. The consumption of these fish andother marine organisms is the main route of humanexposure to methyl mercury. The toxicity of methyl mercury was first recognized inJapan after a chemical company released large amounts ofmethyl mercury into Minamata Bay. This caused severemercury poisoning in local people, with symptoms includingdamage to hearing and speech, muscle weakness and visualimpairment. In severe cases paralysis, coma and deathfollowed within weeks of the onset of symptoms. Thereason for the acute toxicity of methyl mercury to humansis because of its ability to pass through the meninges intothe brain. Similarly, in pregnant women, methyl mercurycan cross the placenta and damage the developing nervoussystem of the fetus. The recognition of the toxicity of methyl mercury andthe realization that fish is the major source for humanshas led to the development of legislation by governmentsand health organizations throughout the world. The majorityof countries and global organizations now enforce maximumconcentrations of mercury in fish of approximately 0.5 mg/kgwet weight. There are differences in maximum mercurylevels between countries and some variations dependingon the type of fish. Most countries also legislate specificallyfor methyl mercury, although there are some that provideguidelines for total mercury levels too. For more detailedinformation see Table 1. Organisation Limit Type Fish Type Total(mg/kg) Organic(mg/kg) EU Commission Maximum Level1 Non-carnivorous fish & crustaceans8 Carnivorous fish8 0.5 1 Codex Alimentarius Guideline Level2 Non-carnivorous fish & crustaceans8Carnivorous fish8 0.5 1 US FDA Maximum Level3 Fish, shellfish, crustaceans & other aquatic animals 1 China Maximum Level4 Fish (excluding carnivorous fish) & other aquatic products 0.5 Carnivorous fish (e.g., shark, tuna, etc.) 1 Japan Maximum Level5 All fish, shellfish & aquatic products 0.4 0.3 Australia Maximum Level6 Crustaceans, molluscs & non-carnivorous fish 0.5 Carnivorous fish & fish samples withlow sample numbers 1 Canada Maxiumum Level7 Edible portion of all retail fish with six exceptions8 0.5 Edible portion of six carnivorous fish8 1 Table 1: The maximum or guideline levels for mercury in seafood adopted byvarious countries or international regulatory bodies 1 Commission Regulation (EC) No 1881/2006 of 19December 2006: Setting maximum levels for certaincontaminants in foodstuffs 2 Codex General Standard for Contaminants and Toxinsin Foods CODEX STAN 193-1995.Rev.3-2007 3 Action Levels for Poisonous or DeleteriousSubstances in Human Food and AnimalFeed (2000) 4 USDA Foreign Agricultural Service, GAIN Report(CH6064), "China, Peoples Republic of; FAIRS ProductSpecific; Maximum Levels of Contaminants in Foods;2006) 5 National Oceanic and Atmospheric AdministrationTechnical Memorandum, "A survey on Japan's importregulations on fish and shellfish products" (1980) 6 Standard 1.4.1- Contaminants and Natural Toxicants 7 Canadian Standards ("Maximum Limits") for VariousChemical Contaminants in Foods 8SSee the specific standard for details of the exact fishspecies that fall under each limit The iCE 3000 Series Atomic AbsorptionSpectrometers and accessories are perfect tools for theanalysis of low levels of mercury in fish. For laboratoriesinterested in total mercury measurements they providefast and accurate analysis of samples with detection limitsbelow 0.07 ppb (ug/L) in solution. This equates to0.014 mg/kg in the original fish sample, based on a0.5g in 100 mL preparative method. For laboratoriesanalyzing methyl mercury, the iCE 3000 Series AtomicAbsorption Spectrometers provide an excellent screeningtool. Their cost-effectiveness and ease-of-use makes thema perfect partner to more complex and expensivetechniques, such as HPLC-ICP-MS or GC-ICP-MS. This application note gives details of the reagents,sample preparation and instrument conditions needed toanalyze low levels of mercury in fish. The method hasbeen evaluated using both spiked fish samples andcertified standard materials containing mercury levelsrelevant to current global legislation. Instrumentation The Thermo Scientific iCE 3500 Atomic AbsorptionSpectrometer was used during this analysis, althoughsimilar results could also be obtained on both the iCE3300 and the 3400 models. The iCE 3000 Series AtomicAbsorption Spectrometers combine high-precision optics,state-of-the-art design and user-friendly software toprovide unrivalled analytical performance. A VP100 vapor generation accessory is also necessaryto perform this analysis. The unique VP100 uses a continuousflow system to produce a steady-state signal and providesexcellent analytical precision. The continuous flow ofreagents ensures that the system is self-cleaning, reducingmemory effects and increasing sample throughput. TheVP100 is entirely controlled by the SOLAAR software,meaning that setting up a method and running an analysisis extremely simple. A mercury cell (provided as standard with the VP100)was also used. This accessory provides an increased path-length compared to a normal vapor cell and givesexceptionally low detection limits. Sample and reagent summary The sample preparation procedure is shown in Figure 1. There are four main sections: sample drying, samplepreparation, sample digestion and mercury reduction. Thedrying section may not be applicable for all situations, asit is only necessary if the final mercury concentration isneeded as a dry weight value, e.g., mg/kg dry weight.Most countries and official regulatory bodies (e.g., CodexAlimentarius, US FDA, EU Commission) specify concentrations of mercury in a wet weight of sample. Add deionised H,0 to bringsample volume to 100ml Slowly add 15 mlnydroxylamine chloridesolution (20%m/v)3 Add deionised H,0 to bringsample volume to 100ml Transfer digested sample intoa 100 ml volumetric flask 1Sample drying phase is not necessary if the final concentration of mercury is neededfor a wet-weight sample Figure 1: The procedure for preparing samples, sample spikes and matrix-matched standards for the analysis of mercury in fish 2 Refer to the manufacturers guidelines when designing a digestion program.An example of a program is given in Table 3 3 CARE: The reaction is exothermic and the flask may become hot. Also, make sureto add the hydroxylamine chloride slowly, otherwise the solution may foam andeject some sample from the flask. Three different types of fish sample were used duringthe evaluation of this method: fresh fish (salmon) obtainedfrom a local supermarket; canned fish (sardine), also obtainedfrom a local supermarket; and DORM-2 certified referencematerial (National Research Council of Canada, Institutefor National Measurement Standards, Ottawa, Canada). Table 2 summarizes all the reagents necessary for theanalysis. Consumables Nitric Acid Potassium Permanganate Hydroxylamine Chloride Mercury Standard Solution (1000 ppm in 10 % HNO,) Stannous (Tin (II)) Chloride Hydrochloric Acid Table 2: Summary of all the reagents used during this analysis If dry weight measurements are needed then the fishsamples should be homogenized and dried in an oven at8800°℃C uunnttil they reach a constant weight. Alternatively, thefish tissue can be freeze-dried and homogenized using amortar and pestle. After drying, portions of approximately0.5 g should be accurately weighed out for digestion. Forwet weight measurements the fresh fish should behomogenized in a food processor and a portion ofapproximately 0.5 g should be accurately weighed andplaced in a microwave digestion vessel. This provides arepresentative fish sample. Following preparation in this manner, 1 mL of 1000ppb Hg standard solution was added to half of the salmonand sardine samples. This spike gave a concentration of10 ppb Hg in the final 100 mL sample. The other half ofthe samples did not have mercury added to them to allowthe calculation of spike recoveries. The microwave digestion vessels containing the sampleswere placed in a fume extraction hood before adding 10 mLconcentrated HNO. The vessels were left for at least 30 minuteswithout their lids on to allow gases to escape. After thistime the vessels were placed into a microwave digestionsystem and digested using the program shown in Table 3.It is also possible to use a hot-block digestion to obtainsuitable results. Power Ramp Max. Pressure Max Temperature Hold Max (W) % (min) (psi) (C) (min) 800 100 30 180 190 15 Table 3: Microwave digestion program used After digestion the samples were transferred to a 100 mLgraduated flask and 60 mL of 6% potassium permanganatesolution was added. The sample vessels were left for atleast 2 hours to ensure that all the mercury in the samplewas reduced to Hg2+. It is very important to check that the vessels are notsealed during this stage, as gases are produced that couldcause pressure to build up. After the mercury was reduced, 15 mL of 20%hydroxylamine chloride solution was added to remove the excess potassium permanganate. Care was taken duringthe addition of the hydroxylamine chloride, as thisproduces an exothermic reaction and the vessel maybecome hot. It is essential to add the hydroxylamine chlorideslowly during this stage and to gently mix the solutionduring the addition. Without these precautions a violentreaction may occur that could eject some sample from theflask, leading to inaccurate results. After allowing the solution to cool, deionised waterwas added to make the volume up to 100 mL. Standard preparation Standards were prepared from a 1000 ppm (mg/L) mercurystandard solution. This standard was first diluted to producea 1000 ppb (ug/L) stock solution to allow simple preparationof a range of standards. To demonstrate the linear rangeof the iCE 3000 Series Atomic Absorption Spectrometers awide range of standards were used (1-100 ppb). Thestandards were matrix matched and prepared in the sameorder as the samples. The procedure is summarized inFigure 1 and the exact volumes needed to prepare thestandards are shown in Table 4. Standard Blank 1 2 3 4 5 6 7 Final Concentration Hg ppb 0 1 2 5 10 20 50 100 Volume 1000 ppb Hg mL 0 0.1 0.2 0.5 1 2 5 10 Stock Solution Volume Conc. HNO. mL 10 10 10 10 10 10 10 10 Volume Potassium mL 60 60 60 60 60 60 60 60 Permanganate Solution (6%) Volume Hydroxylamine Chloride (20%) mL 15 15 15 15 15 15 15 15 Volume Deionized H,0 mL 15 14.9 14.8 14.5 14 13 10 5 Total Volume mL 100 100 100 100 100 100 100 100 Table 4: Volumes of stock standard and other reagents needed to prepare arange of standard solutions VP100 reagent preparation The VP100 requires both a reductant and an acid solutionto perform the reactions that form the gaseous mercury.For this application the reductant was a solution of 7.5 %stannous chloride (SnCl2) stabilized in 10 % HCl. Theacid solution was 50 % HCl. Refer to Table 5 for someguideline figures of how much reductant and acid mightbe needed. Pump Gas Signal Speed Flow Reagents used per sample Stabilization² Acid Reductant Sample (rpm) (mL/min) (mL) (mL) (mL) (s) 40 200 1.40 3.20 15.00 70 Reagent use based on a total sample analysis time of 90 seconds. This isequivalent to the signal stabilization time and five resamples, each taking fourseconds 2 This approximation is based on the time taken for the system to stabilize duringthe analysis of a 10 ppb standard solution Table 5: Estimate of reagent use during the analysis described in thisapplication note Instrument Conditions The analysis was performed using the most sensitiveabsorption wavelength for mercury at 253.7 nm. Fiveresamples were used, with each resample taking four seconds.This was used to thoroughly assess the short-term stabilityof the instrument during the development of this method.For normal use, three resamples would be adequate.Deuterium background correction was used throughoutthe analysis. The parameters used for both the VP100 andspectrometer are shown in Table 6. For further details onhow to optimize the VP100 parameters for your analysis,please refer to the iCE 3000 Series Operator Manual. Spectrometer Parameters VP100 Parameters Wavelength 253.7nm Pump Speed 40 rpm Lamp Current 75% Gas Flow 200 ml/min Bandpass 0.5nm Acid Reagent 50% HCI Background D2 Quadline Reductant 7.5% stannous chloride Correction in 10 % HCI Resamples 5 Measurement Delay 70 Measurement 4.0s Table 6: Summary of the parameters used for the analysis of mercury in fishfor this application note. Results The calibration curve showed excellent linearity up to 100 ppb(Figure 2), which is equivalent to 20 mg/kg in a fish sample(assuming a sample weight of 0.5 g) with an R2 value of0.9989. This shows the superb performance of the iCE3000 Series Atomic Absorption Spectrometers over a wideconcentration range. This calibration is equivalent toconcentrations of 0 - 20 mg/kg mercury in the originalfish samples, assuming a sample mass of exactly 0.5 g.The % relative standard deviations (%RSDs) for each ofthe standards were less than 2.5%. This demonstratesthe excellent stability of both the spectrometer and theVP100 accessory. Figure 2: Calibration curve produced for the analysis of mercury in fishsamples. Matrix matched standards were used. The method detection limit (MDL) and characteristicconcentration were calculated using the automatedInstrument Performance’Wizard in the SOLAAR software.This user-friendly feature guides you through the stepsnecessary to quantify the performance of your method. Italso automates all of the data processing, making theentire procedure quick and easy. The method was found to have a detection limit of0.068 ppb (ug/L) in solution. This equates to a MDL of0.014 mg/kg in the original fish sample (assuming a samplemass of 0.5 g). The MDL provides a measure of the noiseand stability of the system. A lower detection limit allowsyou to confidently determine lower concentrations of mercuryin your samples. The characteristic concentration is related to thesensitivity of the method. The characteristic concentrationof this method was found to be 0.724 ppb in solution. Thiswould be the equivalent of 0.145 mg/kg in the initial fishsample (assuming a sample weight of 0.5 g). Speed Flow Limit Concentration Solution Sample Solution Sample (rpm) (ml/min) (ppb) (mg/kg) (ppb) (mg/kg) 40 200 0.07 0.01 0.7 0.1 1 The detection limit and characteristic concentration of the sample is based on asample mass of 0.5 g Table 7: Detection limit and characteristic concentration data Salmon and sardine samples were spiked with 10 ppbmercury prior to digestion and compared with unspikedsamples to calculate recoveries. These 10 ppb spikeswould correspond to a concentration of 2 mg/kg innormal fish samples (assuming a sample weight of 0.5 g)and demonstrate the accuracy of the analysis at levelsappropriate to current legislation. The spike recoveries areshown in Tables 8 and 9. The agreement with expectedresults is excellent, with the recovered values all fallingwithin 6 % of the expected values. This demonstratesthe repeatability and accuracy of both the sampledigestion procedure and the vapor analysis using theThermo Scientific iCE 3000 Series Atomic AbsorptionSpectrometers. Sample Expected Meaasured Percentage Concentration Concentration Recovery (mg/kg) (mg/kg) (%) Sardine 1 2 1.93 Sardine 2 2.08 Sardine 3 1.91 Table 8: Table of results showing the expected concentration, measuredconcentration and percentage spike recovery for three separate sardinesamples Sample Expected Meaasured Percentage Concentration Concentration Recovery (mg/kg) (mg/kg) (%) Salmon 1 2 1.89 94 Salmon 2 1.94 97 Salmon 3 2 1.99 99 Table 9: Table of results showing the expected concentration, measuredconcentration and percentage spike recovery for three separate salmonsamples To ensure the accuracy of the sample preparation,digestion and analysis, three separate samples of theDORM-2 standard reference material were also analyzed(Table 10). The recoveries from these samples were alsoexcellent, with an accuracy of ±2% or better. Sample Expected Concentration (mg/kg) Meaasured Concentration (mg/kg) Percentage Recovery (%) DORM-21 4.64±0.26 4.59 99 DORM-2 2 4.64±0.26 4.53 98 DORM-23 4.64±0.26 4.57 98 Table 10: Table of results showing the expected concentration, measuredconcentration and percentage spike recovery for three samples of theDORM-2 reference material Conclusions The results shown in this application note show that theiCE 3000 Series Atomic Absorption Spectrometers andVP100 vapor generation accessory offer excellent linearrange, stability and accuracy during the analysis of tracelevels of mercury in fish. Their superb sensitivity andexcellent detection limits easily meet the levels required forall current worldwide legislation (Table 1). The speed andefficiency of the VP100 allows the analysis of a sampleapproximately every 90 seconds. The SOLAAR softwarecontrols every aspect of the spectrometer and VP100 andmakes setting up the method quick and simple. Thesecharacteristics mean that the iCE 3000 Series AtomicAbsorption Spectrometers provide an ideal solution forthe screening and analysis of fish samples for potentialmercury contamination. 1 United Nations Environmental Programme (2002) Global MercuryAssessment, http://www.chem.unep.ch/MERCURY/Report/GMA-report-TOC.htm
确定


还剩4页未读,是否继续阅读?

产品配置单
赛默飞色谱与质谱为您提供《鱼肉中汞检测方案 》,该方案主要用于水产品中重金属检测,参考标准--,《鱼肉中汞检测方案 》用到的仪器有赛默飞 iCE 3500 原子吸收光谱仪
相关方案
更多
该厂商其他方案
更多