


方案详情
文
This Application Note examines the analysis repeatability of trace and major levels of elements in a water sample. The water sample was initially analyzed using a rapid semi-quantitative method to determine the concentration range for all the elements. Five successive analyses were then measured, using a quantitative method, to establish the repeatability of both low and high concentrations.
方案详情

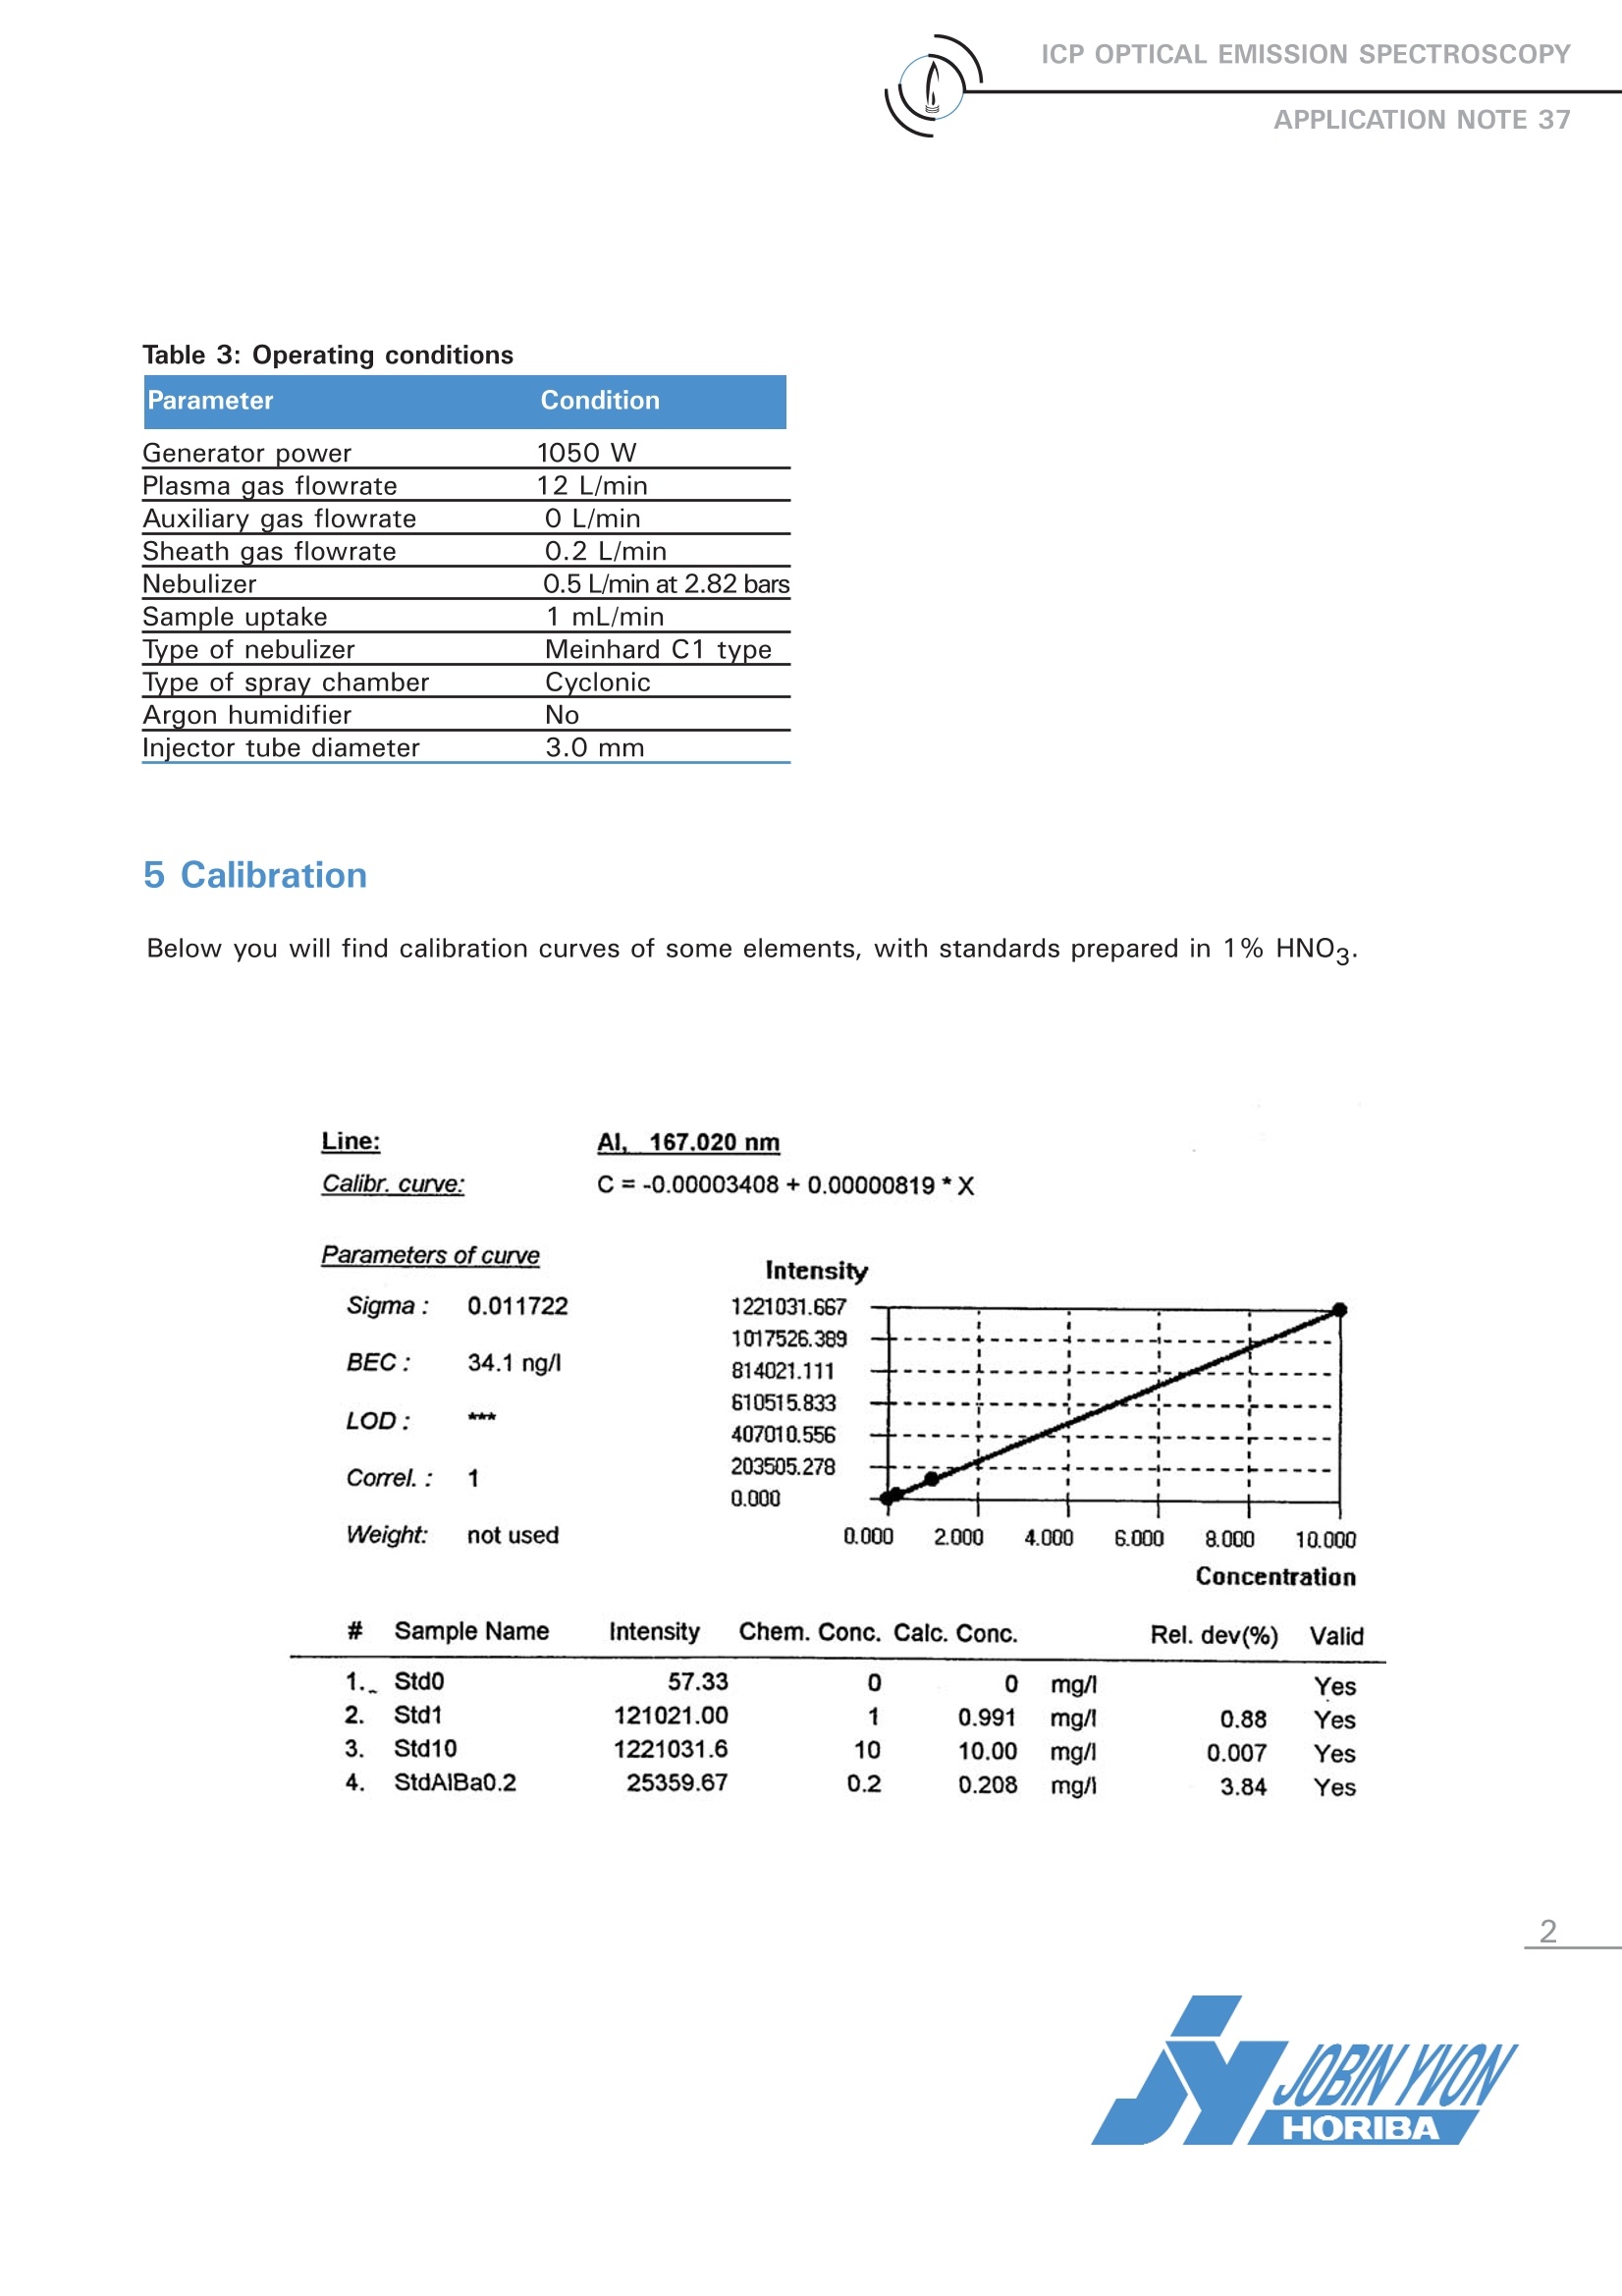
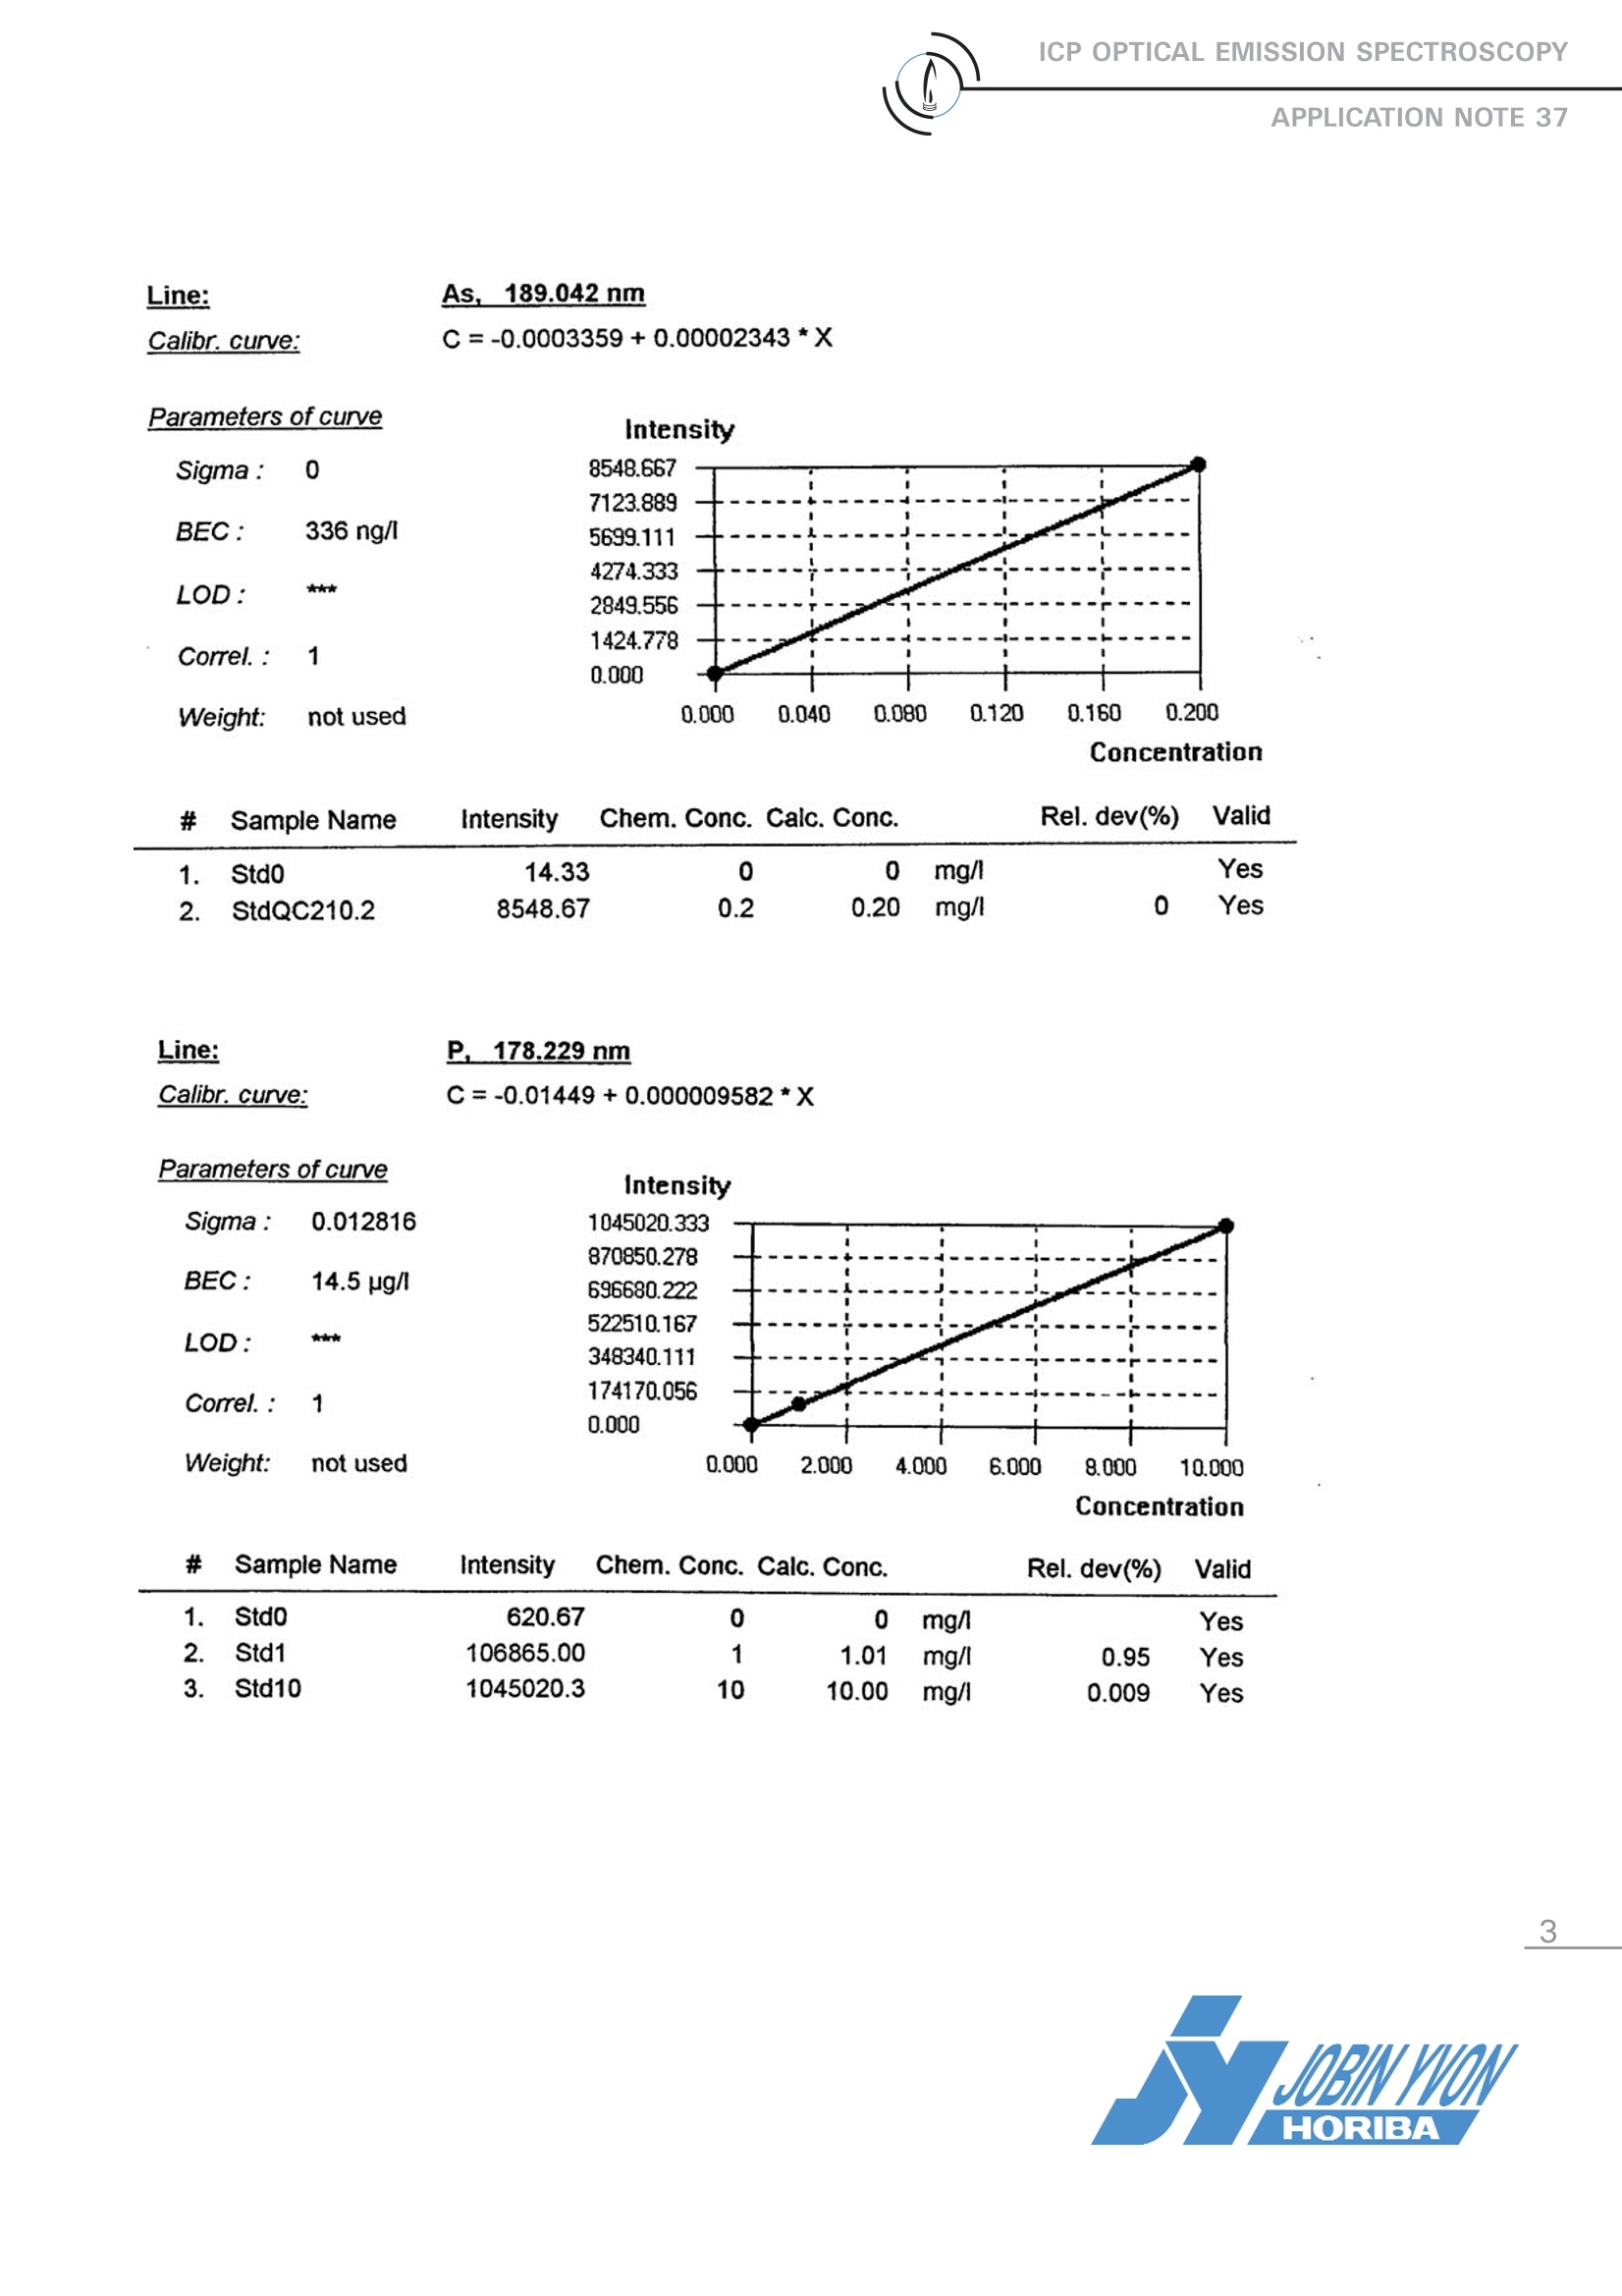
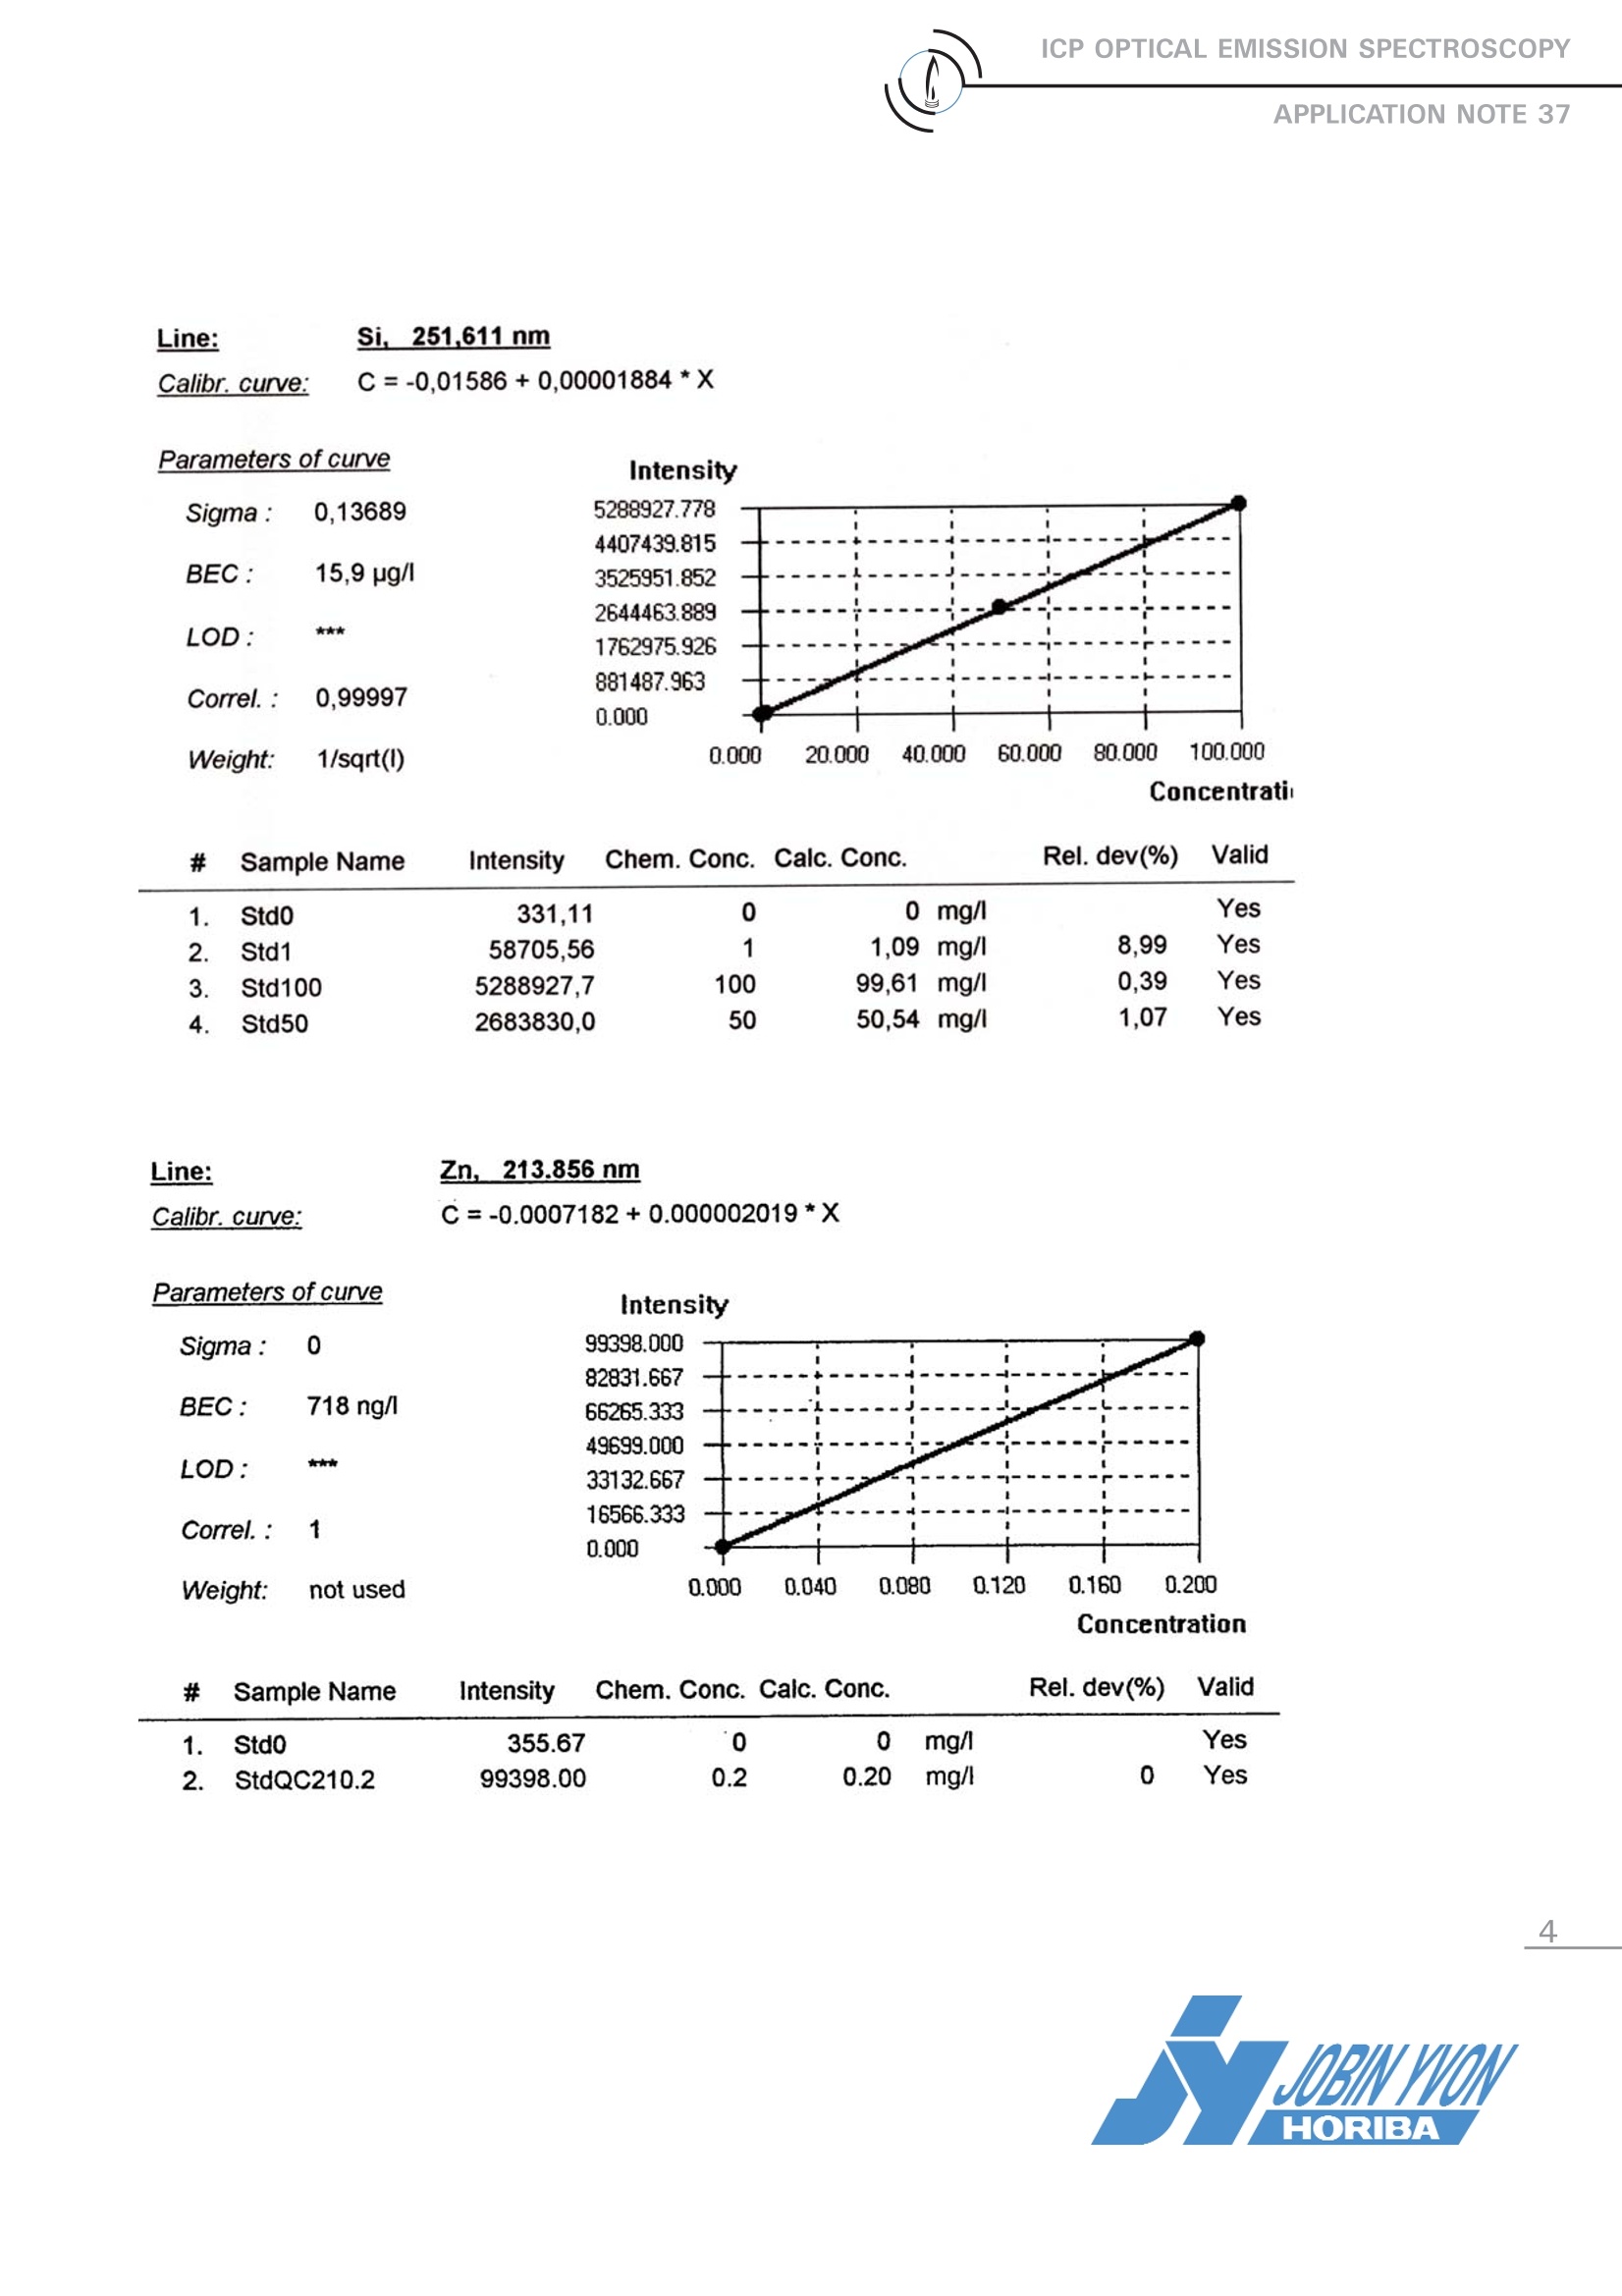
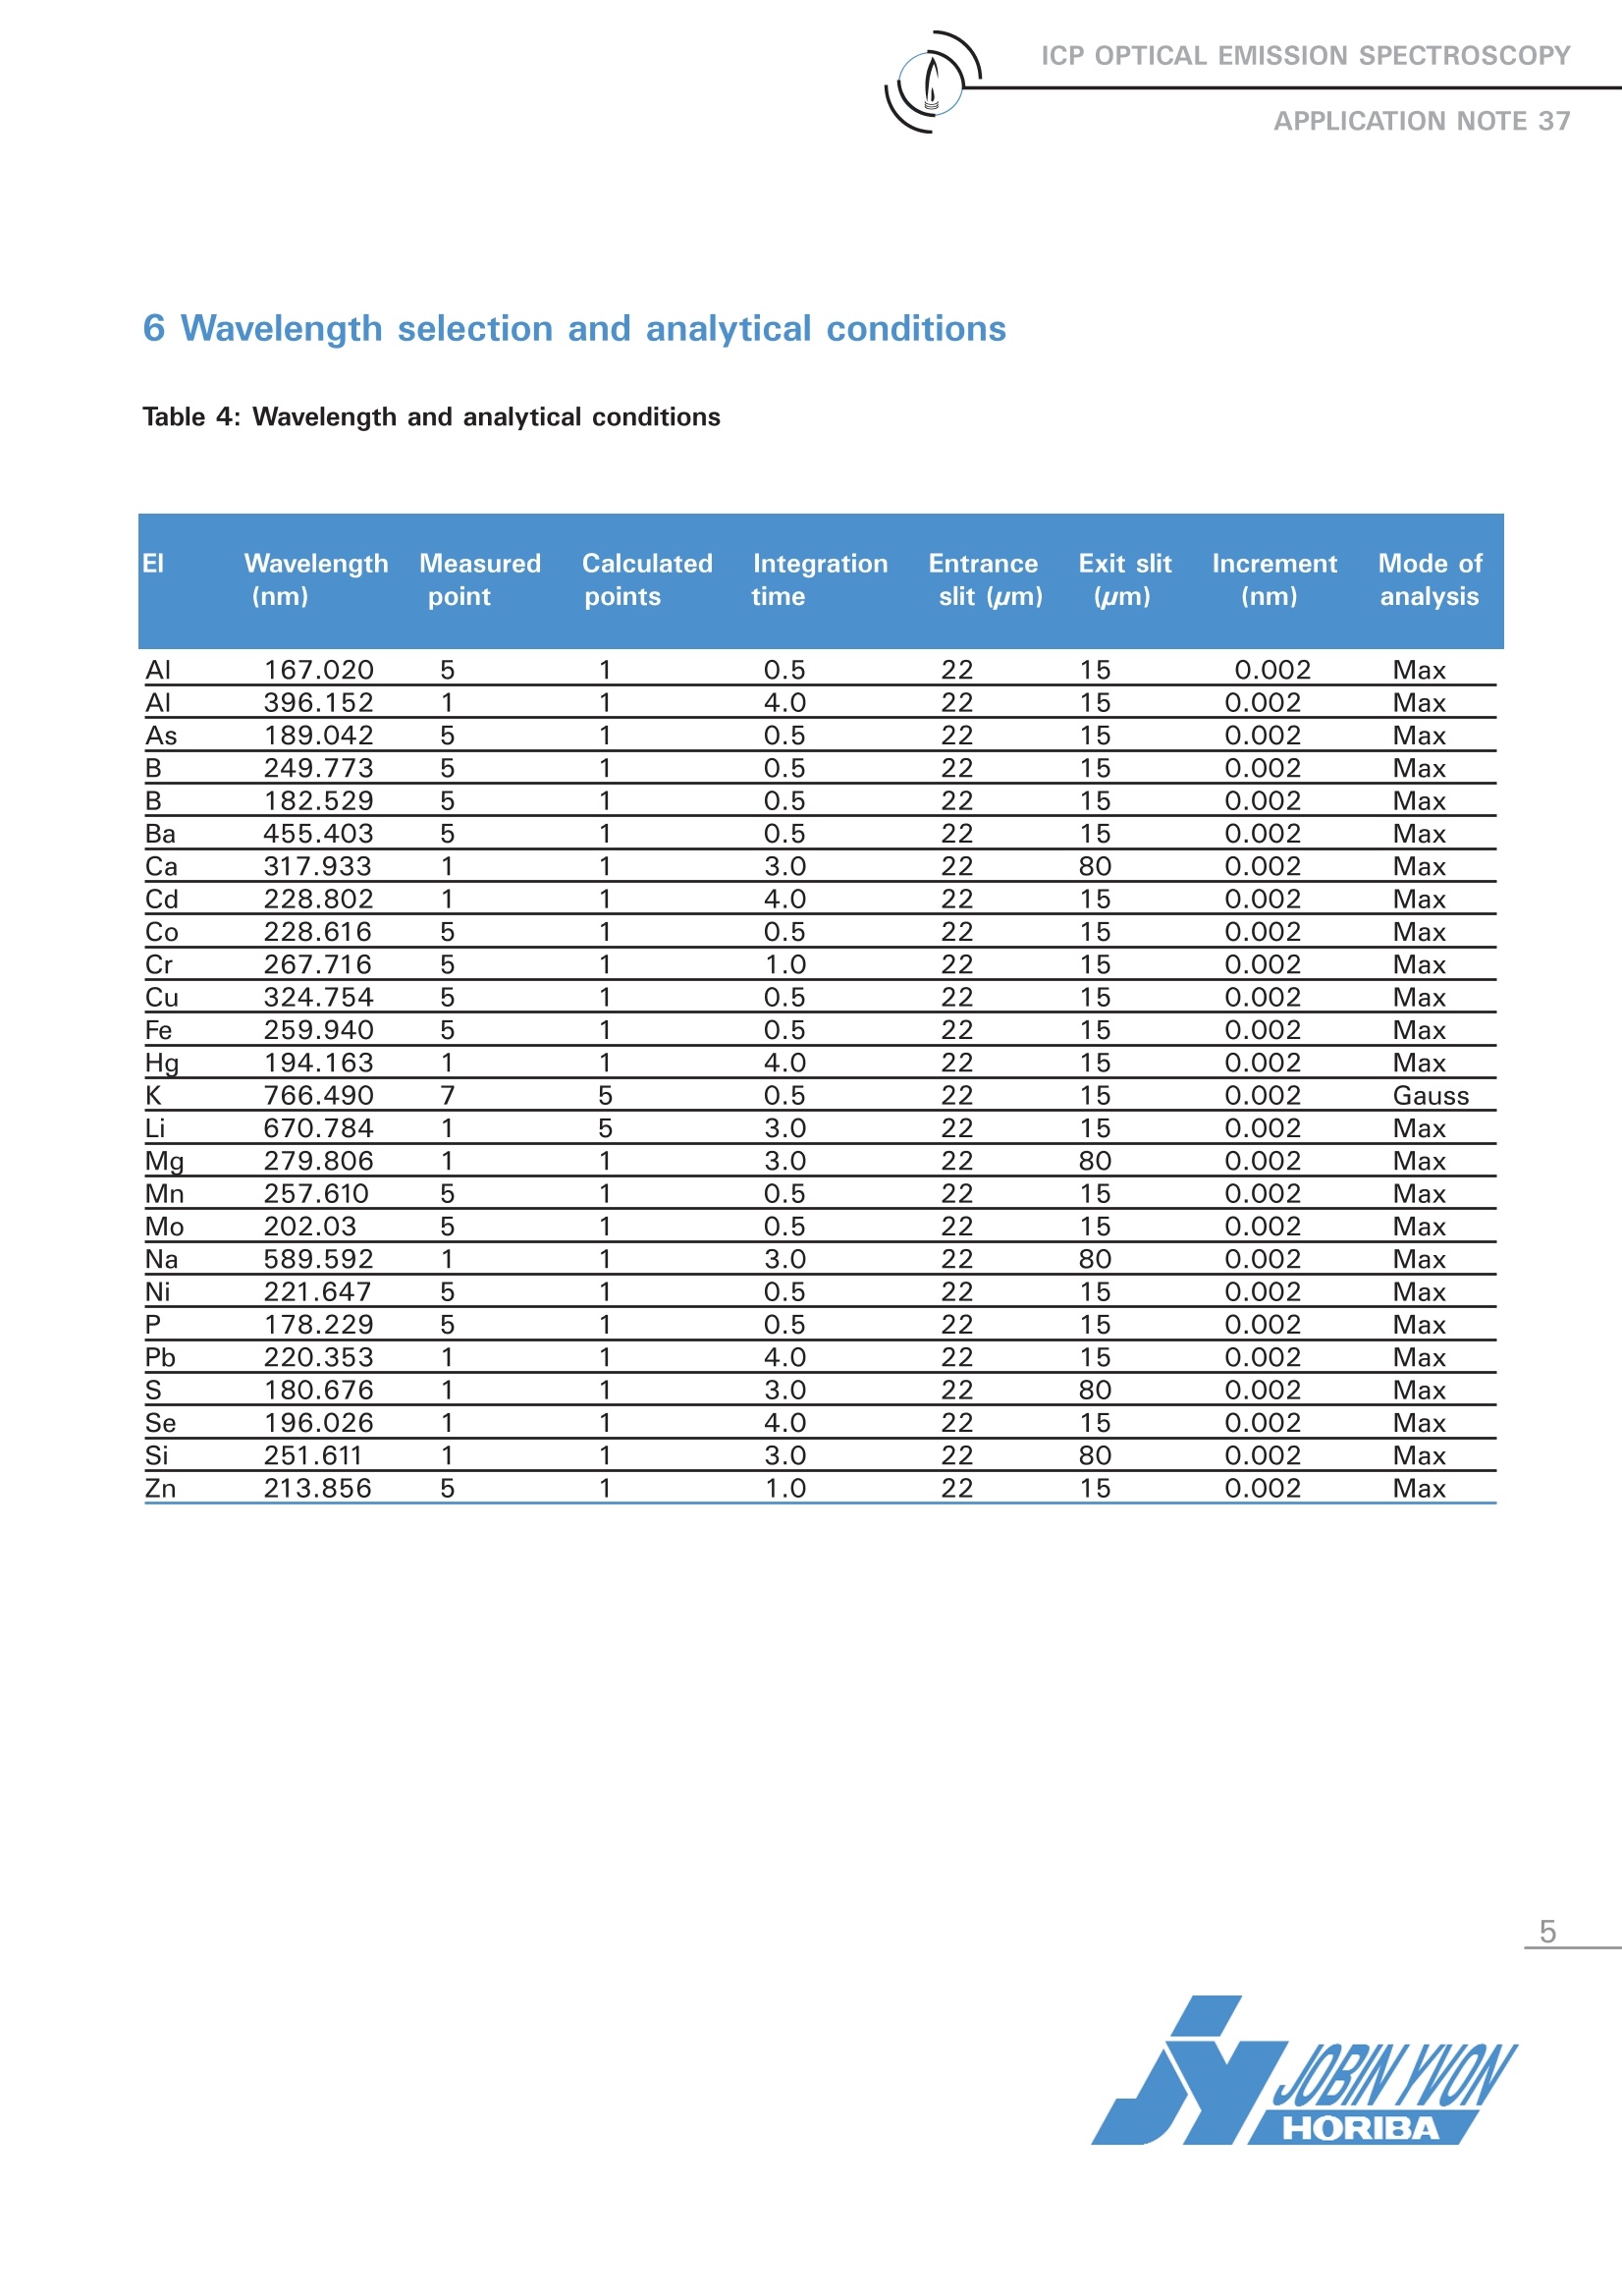
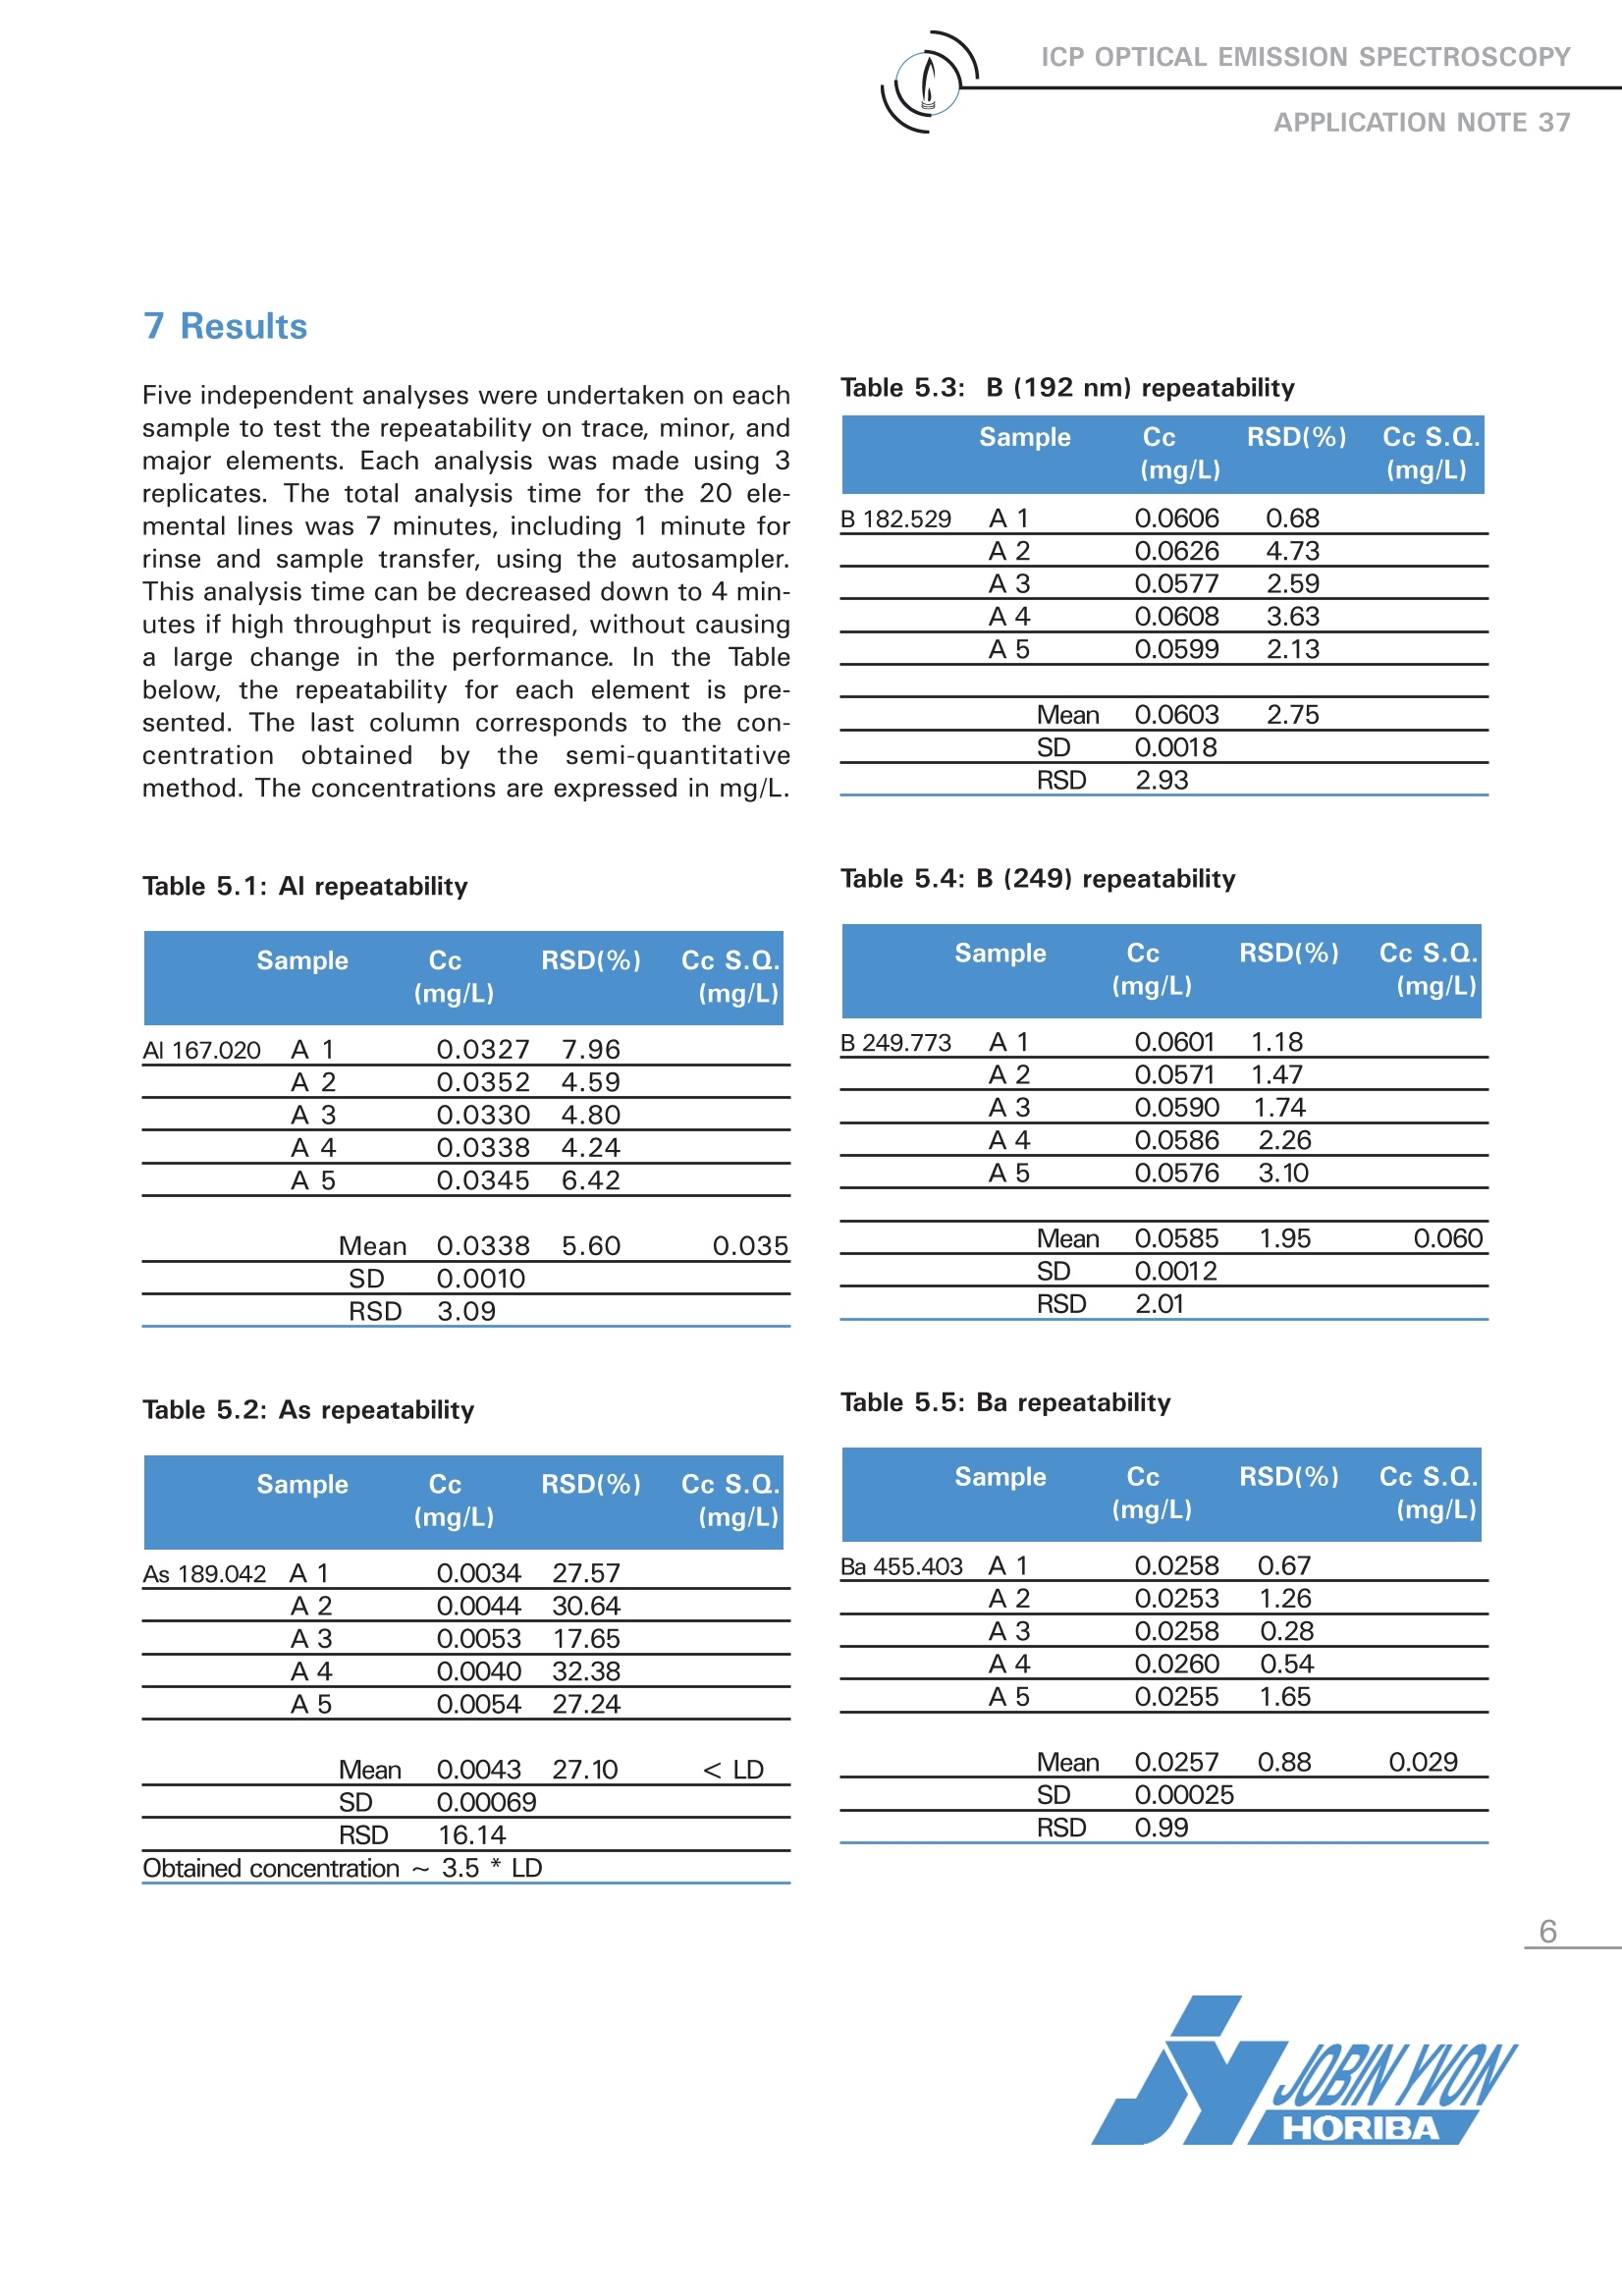
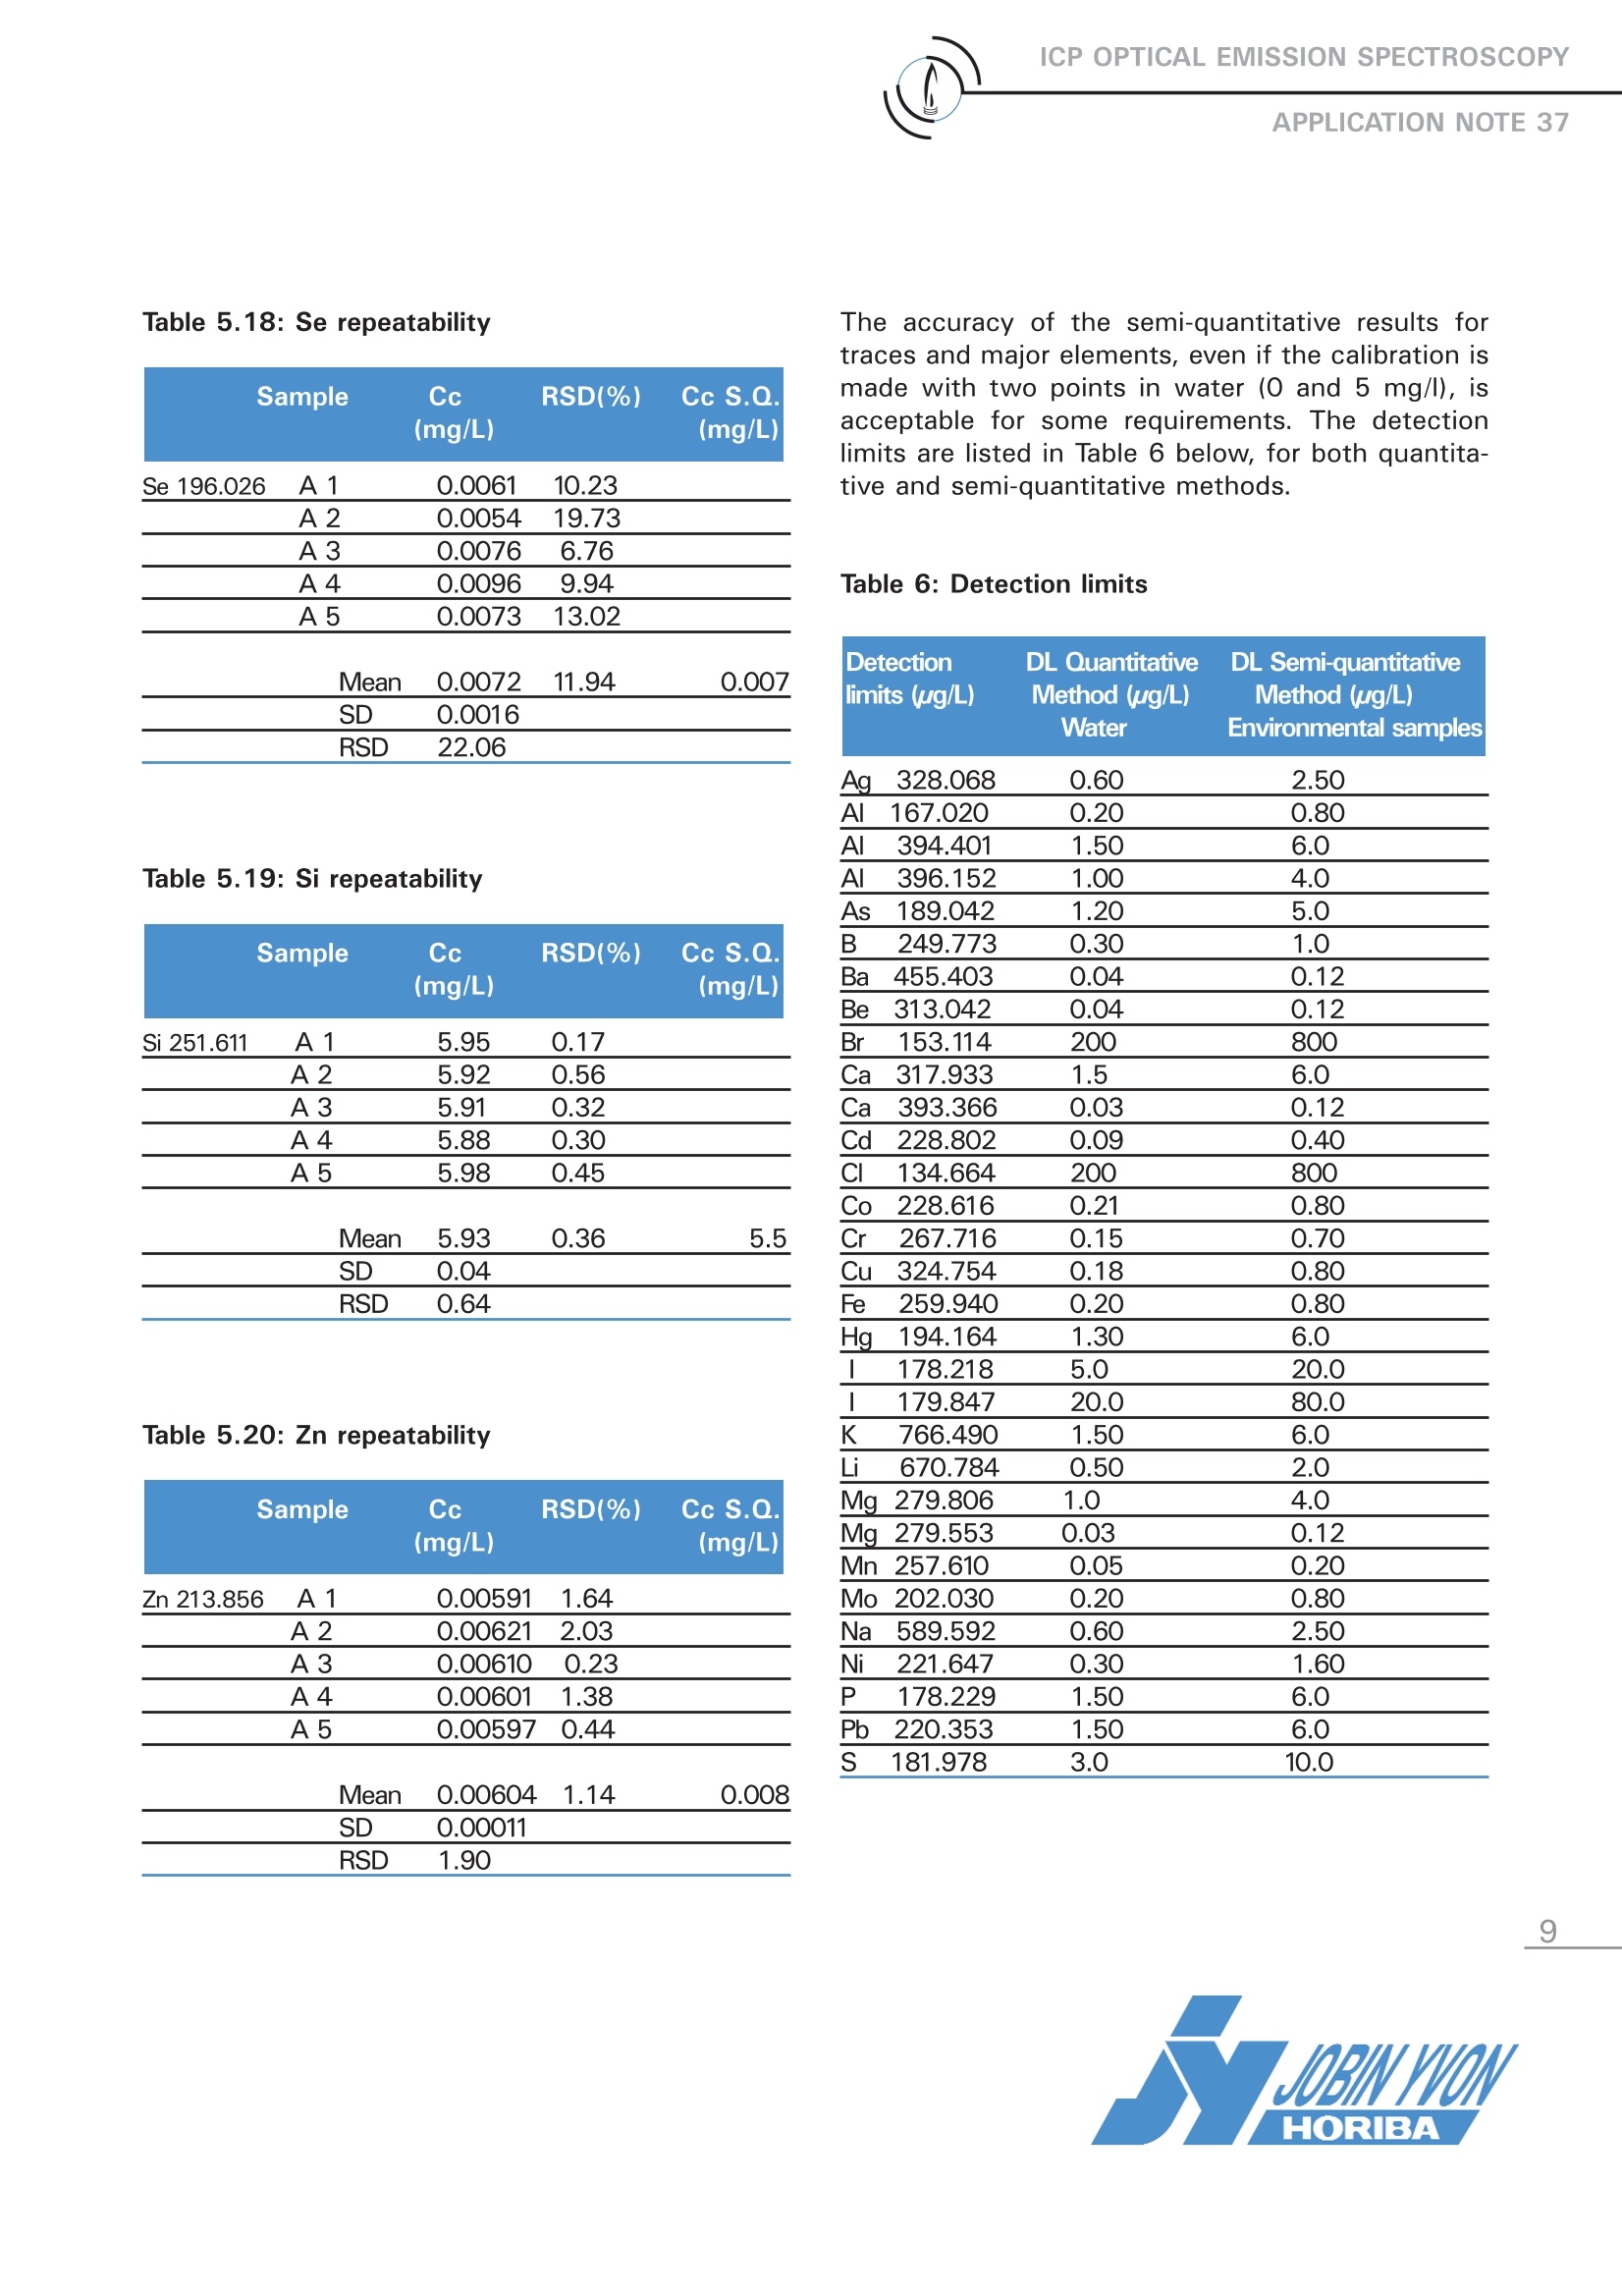
ICP OPTICAL EMISSION SPECTROSCOPYAPPLICATION NOTE 37 Analysis Repeatability of Trace and Major Elements in a WaterSample Agnes COSNIER Jobin Yvon S.A.S., Horiba Group Longjumeau, France Keywords: environment Elements: Al, As, B, Ba, Ca, Cd, Co, Cr, Cu, Fe, Hg, K, Li, Mg, Mn, Mo, Na, Ni, P, Pb, S, Se, Si, Zn This,Application Note examines the analysisrepeatability of trace and major levels of elementsin a water sample. The water sample was initial-ly analyzed using】arapidl semi-quantitativemethod to determine the concentration range forall the elements. Five successive analyses werethen measured, using a quantitative method, toestablish the repeatability of both low and highconcentrations. 2 Principle 2.1 Technique used The elemental analysis of these samples wasundertaken by Inductively Coupled PlasimaOptical Emission Spectrometry (ICP-OES). Thesample is nebulized then transferred to an argonplasma. It is decomposed, atomized and ionizedwhereby the atoms and ions are excited. Wemeasure the intensity of the light emitted whenthe atoms or ions return to lower levels of ener-gy· Each element emits light at characteristicwavelengths and these lines can be used forquantitative analysis after a calibration. 2.2 Wavelength choice The choice of the wavelength in a given matrixcan be made using the profile function, or byusing "Win-Image", which is rapid semi-quantita-tive analysis mode using multiple wavelengths.The principle is the same in either case: recordthe scans of analytes at low concentration, andof the matrix. By superimposing the spectra, wesee possible interferences. 3 Sample Preparation The water samples were stabilized in 1% HNO3. 4 Instrument specification The work was performed on a JY ULTIMA 2 withthe specifications shown below. Table 1: Specification of spectrometer Parameters Specifications Mounting Czerny-Turner Focal length 1 m Thermoregulation Yes Variable resolution Yes Nitrogen purge Yes Grating number of grooves 2400 gr/mm Orders 2 1st order resolution 0.005 nm 2nd order resolution 0.010 nm Table 2: Specification of RF Generator Parameters Specifications Type of generator Solid state Observation Radial Frequency 40.68 MHz Control of gas flowrate By computer Control of pump flow By computer Cooling Air The operating conditions of the spectrometer arelisted in Table 3. Table 3: Operating conditions Parameter Condition Generator power 1050 W Plasma gas flowrate 12 L/min Auxiliary gas flowrate 0 L/min Sheath gas flowrate 0.2 L/min Nebulizer 0.5 L/min at 2.82 bars Sample uptake 1 mL/min Type of nebulizer Meinhard C1 type Type of spray chamber Cyclonic Argon humidifier No Injector tube diameter 3.0 mm Below you will find calibration curves of some elements, with standards prepared in 1% HNO3. Line: Al, 167.020 nm Calibr. curve: C= -0.00003408+0.00000819*X Parameters of curve Intensity Concentration # Sa mple Name Intensity Chem. Conc. Calc. Conc. R e l . d e v (%) Valid 1. Std0 57.33 0 0 mg/l Yes Std1 121021.00 1 0.991 mg/l 0.88 Yes Std10 1221031.6 10 10.00 mg/l 0.007 Yes 4. StdAlBa0.2 25359.67 0.2 0.208 mg/l 3.84 Yes Line: As,189.042 nm Calibr.curve: C=-0.0003359+0.00002343*X Parameters of curve Intensity Sigma: 0 8548.6677123.889 1-BEC: 336 ng/ 5699.1114274.333LOD: ***2849.5561424.778Correl.:0.000Weight: not used 0.000 0.040 0.080 0.120 0.160 0.200ConcentrationYes # Stdo 14.33 0 0 mg/l Yes StdQC210.2 8548.67 0.2 0.20 mg/ 0 Yes Line: P. 178.229 nm Calibr. curve: C=-0.01449+0.000009582 *X Parameters of curve Intensity Sigma : 0.012816 1045020.333 870850.278 BEC: 14.5 pg/l 696680.222 LOD: ★ow 522510.167 348340.111 Correl.: 1 174170.056 0.000 Weight: not used 0.000 2.000 4.000 6.000 8.000 10.000 Concentration 2. Std0 620.67 0 0 mg/ Yes Std1 106865.00 1 1.01 mg/l 0.95 Yes Std10 1045020.3 10 10.00 mg/l 10.009 Yes Line: Si. 251.611 nmCalibr. curve: C=-0.01586+0,00001884*X Parameters of curve Intensity Weight: 1/sqrt(I) 0.000 20.000 40.000 60.000 80.000 100.000Concentratii # Sample Name Intensity Chem. Conc. Calc. Conc. Rel. dev(%) Valid Std0 331,11 0 0 mg/l Yes Std1 58705,56 1 1,09 mg/l 8.99 Yes Std100 5288927.7 100 99,61 mg/l 0.39 Yes Std50 2683830,0 50 50,54 mg/l 1,07 Yes Line: n, 213.856 nm Calibr. curve: C=-0.0007182+0.000002019*X Parameters of curve Intensity Weight: not used 0.000 0.040 0.080 0.120 0.160 0.200 Concentration # Sample Name 1ntensity Chem. Conc. Calc. Conc. Std0 355.67 0 0 mg/l Yes 2. StdQC210.2 99398.00 0.2 0.20 mg/l 0 Yes 6 Wavelength selection and analytical conditions Table 4: Wavelength and analytical conditions EI Wavelength Measured Calculated Integration EEntrance Exit slit Increment Mode of (nm) point points time slit (um) (um) (nm) analysis Al 167.020 5 1 0.5 22 15 0.002 Max AI 396.152 1 1 4.0 22 15 0.002 Max As 189.042 5 1 0.5 22 15 0.002 Max B 249.773 5 1 0.5 22 15 0.002 Max B 182.529 5 1 0.5 22 15 0.002 Max Ba 455.403 5 1 0.5 22 15 0.002 Max Ca 317.933 1 1 3.0 22 80 0.002 Max Cd 228.802 1 1 4.0 22 15 0.002 Max Co 228.616 5 1 0.5 22 15 0.002 Max Cr 267.716 5 1 1.0 22 15 0.002 Max Cu 324.754 5 1 0.5 22 15 0.002 Max Fe 259.940 5 1 0.5 22 15 0.002 Max Hg 194.163 1 1 4.0 22 15 0.002 Max K 766.490 7 5 0.5 22 15 0.002 Gauss Li 670.784 1 5 3.0 22 15 0.002 Max Mg 279.806 1 1 3.0 22 80 0.002 Max Mn 257.610 5 1 0.5 22 15 0.002 Max Mo 202.03 5 1 0.5 22 15 0.002 Max Na 589.592 1 1 3.0 22 80 0.002 Max Ni 221.647 5 1 0.5 22 15 0.002 Max P 178.229 5 1 0.5 22 15 0.002 Max Pb 220.353 1 1 4.0 22 15 0.002 Max S 180.676 1 1 3.0 22 80 0.002 Max Se 196.026 1 1 4.0 22 15 0.002 Max Si 251.611 1 1 3.0 22 80 0.002 Max Zn 213.856 5 1 1.0 22 15 0.002 Max Five independent analyses were undertaken on eachsample to test the repeatability on trace, minor, andmajor elements. Each analysis was made using 3replicates. The total analysis time for the 20 ele-mental lines was 7 minutes, including 1 minute forrinse and sample transfer, using the autosampler.This analysis time can be decreased down to 4 min-utes if high throughput is required, without causinga large change in the performance. In the Tablebelow, the repeatability for each element is pre-sented. The last column corresponds to the con-centration obtainedby the semi-quantitativemethod. The concentrations are expressed in mg/L. Table 5.1: Al repeatability AI167.020 Sample Cc RSD(%) Cc S.Q. (mg/L) (mg/L) A1 0.0327 7.96 A2 0.0352 4.59 A3 0.0330 4.80 A4 0.0338 4.24 A5 0.0345 6.42 SD 0.0010 Mean 0.0338 5.60 0.035 RSD 3.09 Table 5.2: As repeatability Sample Cc RSD(%) Cc S.Q. (mg/L) (mg/L) As 189.042 A 1 0.0034 27.57 A2 0.0044 30.64 A3 0.0053 17.65 A4 0.0040 32.38 A5 0.0054 27.24 Mean 0.0043 27.10
确定
还剩8页未读,是否继续阅读?

产品配置单

HORIBA(中国)为您提供《环境水中(类)金属及其化合物检测方案 》,该方案主要用于环境水(除海水)中(类)金属及其化合物检测,参考标准--,《环境水中(类)金属及其化合物检测方案 》用到的仪器有HORIBA Ultima Expert高性能ICP光谱仪
相关方案
更多
该厂商其他方案
更多